Design and Application of a Smart Diagnostic System for Parkinson's Patients
using Machine Learning
Article in International Journal of Advanced Computer Science and Applications · June 2019 DOI: 10.14569/IJACSA.2019.0100673 CITATIONS 0 READS 620 3 authors:
Some of the authors of this publication are also working on these related projects:
Kinect based ApplicationsView project
Electronic Automatic Gear Shifting System for a MotorcycleView project Asma Channa
Polytechnic University of Bucharest 10 PUBLICATIONS 16 CITATIONS
SEE PROFILE
Attiya Baqai
Mehran University of Engineering and Technology 35 PUBLICATIONS 46 CITATIONS SEE PROFILE Rahime Ceylan Selcuk University 52 PUBLICATIONS 1,036 CITATIONS SEE PROFILE
Design and Application of a Smart Diagnostic
System for Parkinson’s Patients using Machine
Learning
Asma Channa
1, Attiya Baqai
2Electronic Engineering, MUET Jamshoro, Pakistan
Rahime Ceylan
3Electrical & Electronics Engineering Selc¸uk University Konya, Turkey
Abstract—For analysis of Parkinson illness gait disabilities de-tection is essential. The only motivation behind this examination is to equitably and consequently differentiate among sound subjects and the one who is forbearing the Parkinson, utilizing IOT based indicative framework. In this examination absolute, 16 distinctive force sensors being attached with the shoes of subjects which documented the Multisignal Vertical Ground Reaction Force (VGRF). Overall sensors signals utilizing 1024 window estimate around the raw signals, utilizing the Packet wavelet change (PWT) five diverse characteristics that includes entropy, energy, variance, standard deviation and waveform length were derived and support vector machine (SVM) is to recognize Parkinson patients and healthy subjects. SVM is trained on 85% of the dataset and tested on 15% dataset. Preparation accomplice relies upon 93 patients with idiopathic PD (mean age: 66.3 years; 63% men and 37% ladies), and 73 healthy controls (mean age: 66.3 years; 55% men and 45% ladies). IOT framework included all 16 sensors, from which 8 compel sensors were appended to left side foot of subject and the rest of the 8 on the right side foot. The outcomes demonstrate that fifth sensor worn on a Medial part of the dorsum of right foot highlighted by R5 gives 90.3% accuracy. Henceforth this examination gives the knowledge to utilize single wearable force sensor. Hence, this examination deduce that a solitary sensor might help in differentiation amongst Parkinson and healthy subjects.
Keywords—Parkinson patients; force sensors; machine learn-ing; Wavelet Packet Transform (WPT)
I. INTRODUCTION
Presently, every one needs panacea of each illness. Illness is simply another denomination of distortion that happen due to any inner or outer factor. Nowadays, the world is endorsing a growing demand on quality and quantity of healthcare due to rise of elderly population, chronic diseases and health maintenance of people. As Parkinson disease is one of the most prevailing disorder and affects around 6.3 million people in world. Parkinsons illness is the most natural issue of the sensory system [1] in which neurons are harmed and an individual is unfit to do its day by day life exercises. Parkinson’s disease is cognitive impairment causing neurode-generative disease that effects the dopamine produced in nerve cells and there is no therapeutic authoritative trial exist to analyze Parkinson’s sickness.Indeed, even the single-photon outflow automated tomography (SPECT) examine named as a dopamine transporter (DAT) filter can not provide confirmation that the individual has Parkinson illness (PD). In spite of the fact that this can help to the odds and defines that the
subject may have Parkinson’s infection, yet it is really the side effects and neurological surveillance that ultimately decide the right diagnosis. A number of people do not require a DAT examine. The principle side effects of Parkinson ailment are gait, tremor, hardened muscles, moderate advancement and trouble in walking because of which fall occurs in patients. As per [2] the crippling marvel is gait which considered as the most widely recognized side effect among the patients suf-fering from Parkinson. It is regularly a troublesome occasion that surprisingly assaults the subjects and shakes their steps toward the beginning of strolling even in unhindered fixing, amid going around or bending and subsequently irritates the personal daily life activities. Therefore this research aims to establish a gait detection device using IOT which is capable of detecting the gait using the biomedical signals from the sensors attached with body of Parkinson patients. The data in IOT will be analyzed using signal processing technique that may help in finding the gait features. Finally the extracted features are classified using machine learning algorithm.
II. RELATEDWORK
Recently number of research studies have been conducted on PD detecting system with the help of multiple types of sensors, feature sets and analysis methods. For gait exam-ination, researchers in [3], [4] reasoned that the wearable technology is progressing decently by providing the better way to deal with pervasive, maintainable and adaptable monitoring of health. The results are more accurate because of their direct contact and rigid attachment with body, apart from this these wearables are lightweight and have good longevity. Distinctive calculations are implemented over wearable signals to explore, screen or perceive the Parkinson patients.The analysts [5] analyzed basic tremor and Parkinson infection utilizing particular singular value decomposition (SVD) to find highlights of intrinsic mode functions (IMFs) and SVM is proposed to recognize them. Hand quickened signals were gathered and pre-prepared by experimental mode disintegration (EMD) strategy and appropriated into various stationary IMF and contributed to SVM. For contrasting, they likewise utilized the particular esteem highlights of discrete wavelet transform (DWT) as contribution to the SVM. Cross-approved afteref-fects of EMD-SVD highlights extricated gives 98%, 97.5% and 98% exactness, affectability and particularity, which are higher than Discrete Wavelet Transform-SVD. This research is basi-cally focused on the collation of two approaches to overcome
misdiagnosis between essential tremor and Parkinson disease. Authors in [6] presented a novel methodology in which design acknowledgment of DTI information is performed utilizing AI. Information examination checks both level and dimension with respect to SVM order. The framework provides about 97.50% precision. The principle downside of this research is of few cases likewise the preparation and testing execution is on the equivalent dataset. Another issue is review nature of the present investigation. The specialists in [7] start an investi-gation for forecast of freezing of stride (FOG). The suspicion of this investigation is exclusively founded on the edge based model of FOG. Absolute six distinct highlights are siphoned from development signals recorded from wearable sensors and characterize calculation is created to anticipate FOG. The fundamental issue is few subjects and subjects having diverse sickness stages. The researchers in [8] put forward the framework consisting full body movement catch of six subjects is complied and utilized support vector machine classifier for segregating mellow against serious indications with a normal precision of around 90% for quantitative following of sickness movement. In any case, there are the confinements on various stances for recognizing the side effects. The exploration article [9] explicitly addresses smart shoe innovation using inertial sensors and Internet of things (IOT) to screen movement examples of subjects. This fundamentally serve as an analysis of Parkinson malady. Further developed calculations and test structures are needed for good results. The researchers in [10] proposed a movement checked framework to intently watch walking step in older subjects which comprises of body-worn labels and divider mounted sensors utilizing AI calculations so as to perceive explicit medical issue. Two kinds of studies are directed. In the possibility of programmed acknowledgment 12 labels, no commotion indicated k-closest neighbors and neural systems accomplished 100% exactness. Nonetheless, the second investigation depends on the effect of label arrangement and commotion level, this gives 99% precision utilizing AI cal-culation utilizing 8 additional labels with up to 15mm standard deviation of the clamor. So this demonstrates with more labels the classifiers perform more precisely. In [11] the Columbia University Robotics and Rehabilitation Lab introduced a ver-satile instrumented footwear named “SOLESOUND” which is equipped for estimating spatiotemporal walk parameters and dispatch activity related sound material appraisal. In the end, the execution of SOLESOUND under two alignments methodologies subject-explicit and conventional are estimated. With subject-explicit adjustment, the outcomes were increas-ingly precise. Consequently the gadget can possibly be utilized as quantitative walk investigation device. The analysts in [12] proposed a multivariate technique for breaking down stride utilizing gait influence graphs (GIDs).The specific case Weiner-Akaike-granger Schweder impacts estimates identified as ’Extended granger’ causality, examination is utilized that are competent to recognize essentially the healthy subject from Parkinson patients. In this investigation, the recurrence related parameters helped in arrangement between PD subjects with various Hoehn and Yahr stages. Subsequently in this investigation analysts just presented GIDs that can be utilized for recognizing Parkinson individuals and healthy controls. In [13], creators presented a framework in which anomalous stride designs are identified in Parkinson patients. Information has been gathered from an absolute 16 drive sensors located in feet.Extricating specification from the information taken from
sensors performing foot T-test and receiver operating charac-teristics (ROC) bend strategies being utilized to dissect time and recurrence highlights. The outcomes accomplished within the tests obviously confirm the power appropriation around feet adjusts amongst subjects of various phases of PD. The investigation is centered around recognizing diverse phases of PD. In [14] the scientists used PHYSIONET dataset and applied statistical analysis of variance (ANOVA) test to sepa-rate subjects depending on their mean qualities and example characterization utilizing using linear discrimination analysis (LDA) calculation. The precision percentage is accomplished just for three highlights i.e. specific in step separation, position and swing stages which is 94.4%, 77.8% and 86.1%. In [15] the researchers recommended that FOG recognition is performed utilizing profound learning. The specialists utilized wearable unit over midsection of subjects comprising tri-pivotal accelerometer, gyroscope and magnetometer. Despite of the fact that in this methodology the execution accomplished is tantamount to aftereffects of condition of workmanship which is 88.6% sensitivity and 78% specificity. Adhering a quantifi-able unit all over midsection might become oblique. The gait signal is really a development flag which we can get from the force sensitive resistor putting under the foot. The examination in [16] checked that recurrence spectra of left walk, right walk and left swing signs can be successfully inherit sepa-rate patients with amyotrophic sidelong sclerosis, Huntington infection or Parkinson’s illness from sound control subjects. Recurrence range has been isolated in ten different balances of measurable parameters of mean, difference, skewness, kurtosis of every part has been utilized to delineate appropriation of coefficients. Execution of classifiers depends on three distinct kinds of AI classifiers. Executing three classifier increment the multifaceted nature of framework. The examination in [17] characterized another arrangement of highlights to improve execution of past strategies for FOG identification. Spatial and transient highlights of the walk with vitality and physiological highlights (EMG) result in an increasingly strong grouping answer for recognizing solidifying scenes. Characterization techniques give affectability of around 90% and particularity of 92%. Be that as it may, including increasingly biomedical signals, for example, pulse and galvanic skin reaction may expand the grouping exactness. The specialists in [18] executed counterfeit neural system and SVM for distinguishing walk highlights. Spatiotemporal, kinematic, active highlights are utilized in ordering PD stride and healthy subjects. Multiple kinds of standardization titled as intergroup and intragrouph are utilized. In the fore-referenced two sorts are looked at out of which intragroup provides good precision. SVM provides 78.2% exactness, superior to ANN explicitly for combination of walk parameters. Fundamental spatiotemporal sacrifices as finest element for immaculate precision, explicitness and affectability. Three kinds of stride parameters are explored by creators in [19] from these progression lengths, strolling speed, knee edge and VGRF are affirmed as imperative highlights for PD subjects. The highlights are affirmed dependent on measur-able examination and arrangement rate utilizing ANN classifier which gives around 95.63% exactness with utilizing four huge highlights determination through factual investigation. Consequently this exploration only centered around highlights identification and investigation. The creators in [20] proposed the framework which depends on Kinect sensor which is a 3D sensor that can extract complete step data from entire
Fig. 1. Block diagram of proposed system.
body by estimating stride interims. Two analyses are directed, one for exactness and other for strength. In any case, the examination is performed on virtual skeleton as contribution in learned model. Henceforth following technique might help in additionally reaching out with estimating properties inclusive of lower limit rakish speeds and center stance. As previously research has been done on investigation of gait in Parkinson patients yet they all are either complicated, comprising of more than one inertial sensor and actualize different classifiers for the location and breaking down the walk parameters.
Given paper is being sorted out in 5 areas: Section 2 shows the proposed strategy and its portrayal, outcomes and exchanges are given in Section 3. While, Section 4 sum up the work and provides bearings for future work.
III. MATERIALS ANDMETHODS
In this research work the inertial force sensors dataset is acquired from PHYSIONET [21] for Parkinson’s patients.The characteristics which are being isolated are entropy, en-ergy,variance, standard deviation, and waveform length using WPT. Full scale eight sensors are attached to feet. Along this way, the 16 sensors’ outputs are investigated using machine learning algorithm. Fig. 1 shows the block diagram of proposed system.
A. Database Description
Dataset in this examination is secured from PHYSIONET [21]. Previously the research on relationship between hand pre-dominance and Parkinson’s ailment is not being conducted in a systematic way. As in [22] research gives the conceivable re-lationship of handedness out of which 254 right-gave patients, 158 were right-sided while 96 patients had left-lateralized side effect strength. Right-handedness in this manner is by all accounts related with right-sided predominance of PD side effects, although the gathering of left-gave patients were too little to even think about drawing ends from. The dataset depiction has been provided in Table I.
The database comprises of absolute 199 documents of pa-tients and almost 78 records of healthy subjects the description of dataset is cited in Table [23]
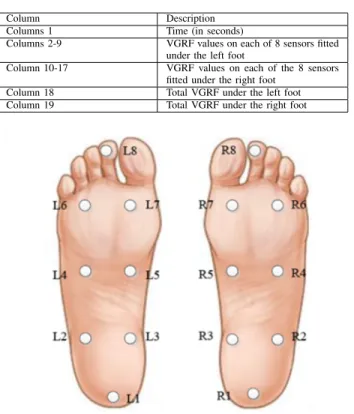
TABLE I. DATA DESCRIPTION
Column Description
Columns 1 Time (in seconds)
Columns 2-9 VGRF values on each of 8 sensors fitted under the left foot
Column 10-17 VGRF values on each of the 8 sensors fitted under the right foot
Column 18 Total VGRF under the left foot
Column 19 Total VGRF under the right foot
Fig. 2. Force sensors exact locations.
B. Force Sensor and Data Acquisition
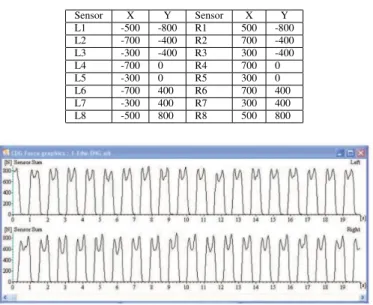
There were 8 sensors situated on the lower portion of left and the right foot, separately. The surmised areas of the sensors have been mentioned in Fig. 2, and the precise areas of sensors are provided in Table II. The white dabs are indicating the force sensors (the sensors situated underneath the feet). The distinctive places of foot at which sensors are joined is shown in Fig. 3. The 16 channels of CDG (Computer Dyno Graphy, recording the powerful dissemination under the foot amid walk). The chronicle unit was carried on the abdomen amid the walk, and after the walk. Collected data was being recorded in a memory card that was transferred to a PC for additional investigation.
The forces summed over all sensors of one foot measured as a function of time are shown in Fig. 4. In this graph, a narrow calculation of force with respect to time values is shown by the Time Cursor. This is crucial for suppressing start and end effects. However the forces, selectable per sensor
TABLE II. POSITION OFSENSORS WITHINLEFT ANDRIGHTFOOT Sensor X Y Sensor X Y L1 -500 -800 R1 500 -800 L2 -700 -400 R2 700 -400 L3 -300 -400 R3 300 -400 L4 -700 0 R4 700 0 L5 -300 0 R5 300 0 L6 -700 400 R6 700 400 L7 -300 400 R7 300 400 L8 -500 800 R8 500 800
Fig. 4. Total summed up forces on one foot
displayed as a matter of time is shown in Fig. 5.
C. Feature Extraction using Wavelet Packet Transform Feature extraction is the most crucial part for machine learning algorithms.The question with respect to feature ex-traction and selection is which algorithm is best for feature extraction and the answer is it depends on what type of problem we are solving. However, it depends on few factors which are:
1. What kind of problem one is trying to solve? e.g. classification, regression, clustering, etc. 2. Type of dataset. 3. Is data having very high dimensionality? 4. Is data labeled? After knowing this the next questions to deal with are 1. Either to perform feature extraction or feature selection? 2. Have to use a supervised or unsupervised method?
Fig. 5. The forces, selectable per sensor, displayed as function of time
Hence it is concluded that there is no generic feature extraction scheme which works in all cases.Lots of methods have been introduced for extracting features and their results may vary with respect to applications.
Fourier change is for the most part utilized for signal processing since 1950’s, however latest change called wavelet transform in [24] brings another stage towards denoising, com-pression, and characterization. Wavelet change’s fundamental objective is to personify a signal which might be dissected as superposition of wavelet. The DWT of signal x is determined by going through a number of filters. First, samples are gone through a low pass channel with impulse response bringing in convolution of two: y[n] = (x ∗ g)[n] = ∞ X −∞ x[k]g[n − k]
The signal in a similar manner deteriorated almost at the same time managing a high-pass filter. The resulted signal provide complete information regarding coefficients (from the high-pass channel) and guess coefficients (from the low-pass). It is imperative that both channels are determined with one another and recognized as quadrature mirror filter. In spite of this, since a huge part of frequencies of the signal is now been expelled, majority of the portion of examples might be discarded of as determined by Nyquist’s standard. The channel yield of the low-pass filter g is then sub sampled and further managed through a new low-pass filter g and a high-pass filter h with half off the cut of frequency of previous one i.e.
Y low = ∞ X −∞ x[k]g[2n − k] Y high = ∞ X −∞ x[k]h[2n − k]
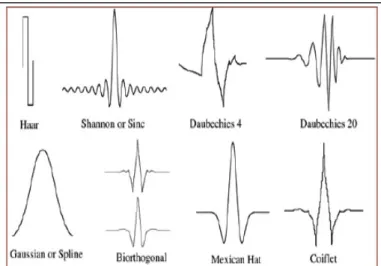
Wavelet Packet Transformer is used in this research with the aim to decompose the sensors data. The decomposition of level 3 is explained in Fig. 6. Fig. 7 depicts how wavelets packets are organized in form of tree where j defines depth and frequency n defines positions in tree.There are number of various wavelet families which are useful in different applications few of them are shown in Fig. 7 and in Fig. 8. Choosing a specific wavelet type for analyzing the data depends on what we want to do with the available dataset. This research requires the wavelet that finds the closely spaced features of interest. Hence ’db2’wavelet is preferred to detect gait intervals of Parkinson patients.
As in gait signal, a specific occasion comparatively hap-pening at a moment can be exceptionally compelling. So WPT gives a bundle of vital signs that helped in the discovery of stride interims and concentrate their features.In this exploration wavelet packet transform change is utilized to decay signal.
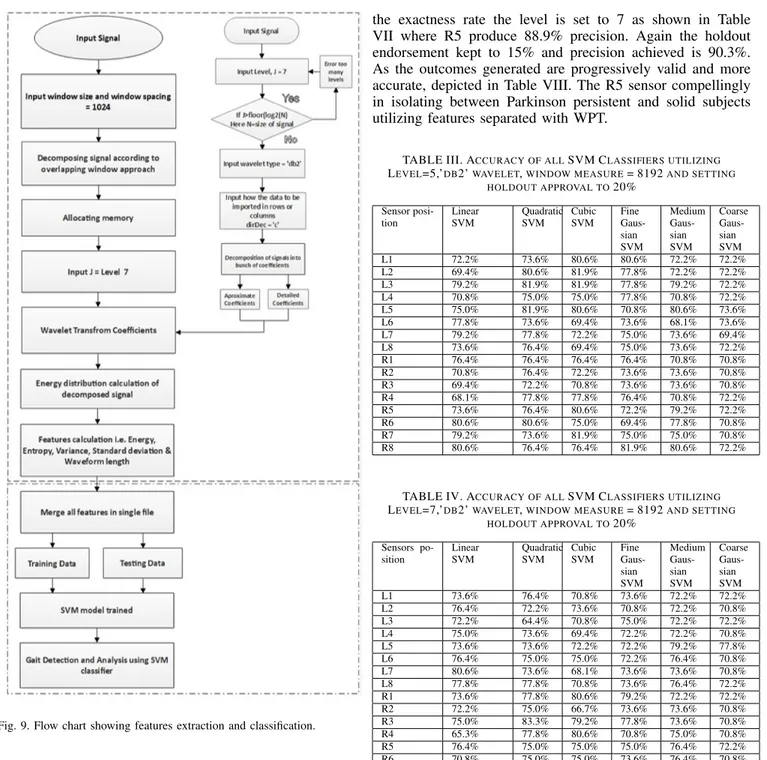
The decay of information of subjects utilizing WPT is shown in Fig. 9. In flowchart first, data is served as an input to WPT a short time later the level is chosen. Additionally, the type of wavelet is selected i.e. ‘db2’. Subsequently utilizing along these ways, we get various coefficients as clarified in [19].
Fig. 6. Wavelet Packet Decomposition Tree at Level 3.
Fig. 7. Wavelet Packet organized in form of tree.
Fig. 8. Wavelet families.
D. Extracted Features
For identification of gait signs the information is processed utilizing WPT in [25][26]. The procedure is clarified in Fig. 9. In beginning window dimension and dispersion are selected i.e. 1024 and level is kept to J=7 for better precision. Com-prehensively, characteristics are extricated utilizing WPT. E. Classification
Support vector machine is the standout amongst the ul-timate considerate and straightforward calculations [27]. At the point when the information is tangled and can not be isolated effectively, SVM is the best alternative to pick. In Fig. 9 we have utilized SVM classifier. As all out of 8 sensors are utilized on each foot and our objective is to figure out which sensor identifies gait superior to the others. The WPT determined the highlights from every sensor. Utilizing these separated highlights, the SVM shown in [28] is trained utilizing classifier learner app in MATLAB.
F. Steps Performed In MATLAB Classifier Learner App 1. First, the data is prepared. We have N samples of training data and M samples of test data, the data was combined together to make it MxN samples. The rows represent each sample and the columns the different types of features detected from a sample. 2. The next step was to add an extra column at First or Last of the data (preferably): This column represents the desired labels for the data. So, now the total number of columns = number of features + 1. While importing the data into the Classification Learner App, the data was supported as a table. 3. Then, data was fixed to be used by the Classification Learner App. By default, all columns are selected as predictors. The app prompts to select the responses. A response is the one which we added as an extra column (the label). So, we changed the label-column to make it point as a response. 4. Before starting the session, there was a need to set up the Cross Validation strategy adopted. A k-fold validation divides the total MXN data into k-parts and begins by taking the first part of testing and rest k-1 parts for training. Then, again it takes the second part for testing and rest k-1 parts for training and so on. Finally, average of all the accuracy’s obtained was taken as final accuracy. However the Holdout validation method asked to test the percent of the input data as testing data. 5. After selecting the validation method and choosing their rate start session, next was to select the classifier (i.e. SVM) that is used in this study and finally hit the training button.
IV. RESULTS ANDDISCUSSIONS
The extracted features were expelled from the sensors which were hooked to subjects feet. The essential target is to find the sensor that shows good exactness percentage.
At first initializing 8192 window measure utilizing dimen-sion 5 and ‘db2’ type the precidimen-sion of each wearable gotten by setting 20% holdout approval as shown in Table III. According to this table L2, L3 sensors and R7 sensor gives 81.9% accuracy using Cubic SVM classifier. While L3 and L5 give 81.9% accuracy using Quadratic SVM classifier. The R8 sensor also gives 81.9% accuracy using Fine Gaussian SVM. As the multiple sensors give same accuracy rate with different type of classifier so as to improve exactness rate the Wavelet packet
Fig. 9. Flow chart showing features extraction and classification.
transformers parameters are changed to Level = 7, wavelet = ‘db2’, window estimate = 8192 and holdout approval rate to 20% as appeared in Table IV. The results achieved shows R7 sensor gives 84.7% accuracy using cubic SVM. Eventually the accuracy is good but in order to validate it the validation method is changed to K-fold method and level = 7 is changed to level = 5. Then the trained model give 81.8% for L1, using Cubic SVM as shown in Table V. Hence this proves k-fold validation method does not give accurate results as compared to holdout validation method.
Other than setting 1024 window estimate keeping dimen-sion 5 and ‘db2’ type the precidimen-sion rates of sensors as appeared in Table VI, which depicts that L1 and L2 produce 84.9% precision with help of Cubic SVM classifier. To improve
the exactness rate the level is set to 7 as shown in Table VII where R5 produce 88.9% precision. Again the holdout endorsement kept to 15% and precision achieved is 90.3%. As the outcomes generated are progressively valid and more accurate, depicted in Table VIII. The R5 sensor compellingly in isolating between Parkinson persistent and solid subjects utilizing features separated with WPT.
TABLE III. ACCURACY OF ALLSVM CLASSIFIERS UTILIZING
LEVEL=5,’DB2’WAVELET,WINDOW MEASURE= 8192AND SETTING HOLDOUT APPROVAL TO20% Sensor posi-tion Linear SVM Quadratic SVM Cubic SVM Fine Gaus-sian SVM Medium Gaus-sian SVM Coarse Gaus-sian SVM L1 72.2% 73.6% 80.6% 80.6% 72.2% 72.2% L2 69.4% 80.6% 81.9% 77.8% 72.2% 72.2% L3 79.2% 81.9% 81.9% 77.8% 79.2% 72.2% L4 70.8% 75.0% 75.0% 77.8% 70.8% 72.2% L5 75.0% 81.9% 80.6% 70.8% 80.6% 73.6% L6 77.8% 73.6% 69.4% 73.6% 68.1% 73.6% L7 79.2% 77.8% 72.2% 75.0% 73.6% 69.4% L8 73.6% 76.4% 69.4% 75.0% 73.6% 72.2% R1 76.4% 76.4% 76.4% 76.4% 70.8% 70.8% R2 70.8% 76.4% 72.2% 73.6% 73.6% 70.8% R3 69.4% 72.2% 70.8% 73.6% 73.6% 70.8% R4 68.1% 77.8% 77.8% 76.4% 70.8% 72.2% R5 73.6% 76.4% 80.6% 72.2% 79.2% 72.2% R6 80.6% 80.6% 75.0% 69.4% 77.8% 70.8% R7 79.2% 73.6% 81.9% 75.0% 75.0% 70.8% R8 80.6% 76.4% 76.4% 81.9% 80.6% 72.2%
TABLE IV. ACCURACY OF ALLSVM CLASSIFIERS UTILIZING
LEVEL=7,’DB2’WAVELET,WINDOW MEASURE= 8192AND SETTING HOLDOUT APPROVAL TO20% Sensors po-sition Linear SVM Quadratic SVM Cubic SVM Fine Gaus-sian SVM Medium Gaus-sian SVM Coarse Gaus-sian SVM L1 73.6% 76.4% 70.8% 73.6% 72.2% 72.2% L2 76.4% 72.2% 73.6% 70.8% 72.2% 70.8% L3 72.2% 64.4% 70.8% 75.0% 72.2% 72.2% L4 75.0% 73.6% 69.4% 72.2% 72.2% 70.8% L5 73.6% 73.6% 72.2% 72.2% 79.2% 77.8% L6 76.4% 75.0% 75.0% 72.2% 76.4% 70.8% L7 80.6% 73.6% 68.1% 73.6% 73.6% 70.8% L8 77.8% 77.8% 70.8% 73.6% 76.4% 72.2% R1 73.6% 77.8% 80.6% 79.2% 72.2% 72.2% R2 72.2% 75.0% 66.7% 73.6% 73.6% 70.8% R3 75.0% 83.3% 79.2% 77.8% 73.6% 70.8% R4 65.3% 77.8% 80.6% 70.8% 75.0% 70.8% R5 76.4% 75.0% 75.0% 75.0% 76.4% 72.2% R6 70.8% 75.0% 75.0% 73.6% 76.4% 70.8% R7 79.2% 83.3% 84.7% 77.8% 77.8% 72.2% R8 79.2% 79.2% 66.7% 70.8% 76.4% 70.8%
The tested model portrayal of right foot sensor positioned at 5 is shown in Fig. 10. The model represents six kinds of SVM classifiers among these Cubic and medium Gaussian SVM classifiers give around 88% while Quadratic SVM gives 90.3% exactness utilizing kernel function with box requirement dimension of 1 and its training time is 6.1981 seconds.
A confusion matrix is fundamentally a table that gives performance of a classification model on a group of test data. It is given the name as confusion matrix since it is generally easy to see, however the related wording can be confusing. Subsequent to setting up the model, the disarray network in Fig. 11(a) shows the performance of a classifier. As lines of disorder arrange show true class and area addresses prescient
TABLE V. ACCURACY OF ALLSVM CLASSIFIERS UTILIZING
LEVEL=5,’DB2’WAVELET,WINDOW MEASURE= 1024AND SETTING K-FOLD APPROVAL TO5 Sensors po-sition Linear SVM Quadratic SVM Cubic SVM Fine Gaus-sian SVM Medium Gaus-sian SVM Coarse Gaus-sian SVM L1 72.5% 80.3% 81.8% 79.1% 78.5% 72.2% L2 75.6% 79.1% 79.5% 78.5% 77.7% 71.6% L3 71.6% 74.1% 77.1% 77.5% 73.4% 71.6% L4 78.4% 80.3% 79.7% 75.9% 79.1% 74.4% L5 78.3% 80.0% 78.9% 75.9% 78.7% 74.6% L6 77.0% 80.8% 79.5% 77.8% 79.3% 77.0% L7 76.3% 78.9% 79.9% 76.9% 77.7% 73.2% L8 76.4% 78.7% 79.5% 78.1% 77.0% 73.0% R1 72.5% 77.3% 78.5% 77.5% 75.1% 72.4% R2 72.5% 75.8% 78.6% 77.3% 74.% 72.3% R3 71.6% 78.4% 78.4% 77.8% 75.9% 71.6% R4 74.1% 77.6% 78.9% 75.9% 76.7% 71.6% R5 75.5% 79.5% 79.4% 76.4% 77.7% 71.7% R6 76.2% 79.1% 79.4% 77.4% 78.1% 71.6% R7 76.4% 79.9% 79.8% 77.7% 79.2% 71.6% R8 77.0% 79.7% 80.5% 78.3% 78.3% 71.8%
TABLE VI. ACCURACY OF ALLSVM CLASSIFIERS UTILIZING
LEVEL=5,’DB2’WAVELET,WINDOW MEASURE= 1024AND SETTING HOLDOUT APPROVAL TO20% Sensor posi-tion Linear SVM Quadratic SVM Cubic SVM Fine Gaus-sian SVM Medium Gaus-sian SVM Coarse Gaus-sian SVM L1 73.50% 83.20% 84.90% 79.20% 78.30% 73.40% L2 77.50% 81.20% 84.90% 78.10% 81.50% 72.80% L3 72.80% 74.00% 73.40% 76.30% 74.40% 72.70% L4 81.10% 83.00% 83.20% 75.00% 82.00% 75.30% L5 78.30% 81.90% 28.70% 77.70% 81.50% 74.30% L6 77.20% 81.10% 82.00% 81.30% 81.00% 77.50% L7 78.70% 81.10% 81.50% 77.00% 79.80% 73.90% L8 756.50% 77.30% 78.20% 79.20% 77.70% 74.90% R1 73.50% 77.20% 81.30% 78.10% 75.40% 73.50% R2 74.40% 76.60% 78.90% 78.50% 76.50% 74.10% R3 72.50% 77.20% 77.00% 77.30% 75.10% 72.50% R4 74.10% 77.60% 77.80% 76.60% 76.80% 72.70% R5 76.20% 78.10% 75.60% 77.20% 78.70% 72.80% R6 76.20% 77.20% 78.80% 76.90% 78.10% 72.50% R7 76.00% 78.40% 77.40% 77.50% 77.10% 72.50% R8 76.30% 81.50% 82.50% 78.60% 78.10% 73.20%
TABLE VII. ACCURACY OF ALLSVM CLASSIFIERS UTILIZING
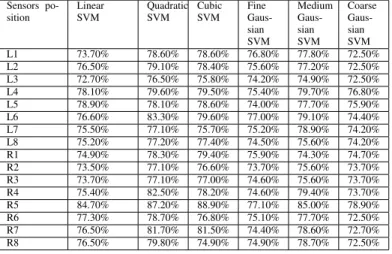
LEVEL=7,’DB2’WAVELET,WINDOW ESTIMATE= 1024AND SETTING HOLDOUT APPROVAL TO20% Sensors po-sition Linear SVM Quadratic SVM Cubic SVM Fine Gaus-sian SVM Medium Gaus-sian SVM Coarse Gaus-sian SVM L1 73.70% 78.60% 78.60% 76.80% 77.80% 72.50% L2 76.50% 79.10% 78.40% 75.60% 77.20% 72.50% L3 72.70% 76.50% 75.80% 74.20% 74.90% 72.50% L4 78.10% 79.60% 79.50% 75.40% 79.70% 76.80% L5 78.90% 78.10% 78.60% 74.00% 77.70% 75.90% L6 76.60% 83.30% 79.60% 77.00% 79.10% 74.40% L7 75.50% 77.10% 75.70% 75.20% 78.90% 74.20% L8 75.20% 77.20% 77.40% 74.50% 75.60% 74.20% R1 74.90% 78.30% 79.40% 75.90% 74.30% 74.70% R2 73.50% 77.10% 76.60% 73.70% 75.60% 73.70% R3 73.70% 77.10% 77.00% 74.60% 75.60% 73.70% R4 75.40% 82.50% 78.20% 74.60% 79.40% 73.70% R5 84.70% 87.20% 88.90% 77.10% 85.00% 78.90% R6 77.30% 78.70% 76.80% 75.10% 77.70% 72.50% R7 76.50% 81.70% 81.50% 74.40% 78.60% 72.70% R8 76.50% 79.80% 74.90% 74.90% 78.70% 72.50%
TABLE VIII. ACCURACY OF ALLSVM CLASSIFIERS UTILIZING
LEVEL=7,’DB2’WAVELET,WINDOW ESTIMATE= 1024AND SETTING HOLDOUT APPROVAL TO15% Sensors po-sition Linear SVM Quadratic SVM Cubic SVM Fine Gaus-sian SVM Medium Gaus-sian SVM Coarse Gaus-sian SVM L1 73.10% 78.30% 78.40% 74.50% 76.20% 73.10% L2 77.00% 78.60% 77.90% 75.80% 78.30% 72.70% L3 72.70% 74.60% 74.60% 73.90% 734.90% 72.50% L4 80.70% 80.00% 78.90% 74.30% 78.90% 75.00% L5 75.70% 79.80% 78.90% 76.60% 80.00% 74.50% L6 78.00% 81.20% 81.60% 75.70% 78.30% 74.00% L7 77.00% 79.60% 75.90% 74.50% 78.90% 73.40% L8 73.40% 76.30% 76.80% 74.30% 74.70% 73.40% R1 73.60% 75.70% 81.00% 76.30% 74.00% 72.70% R2 72.70% 76.10% 80.70% 74.50% 76.30% 73.70% R3 72.70% 76.80% 78.40% 75.40% 74.50% 72.70% R4 74.70% 80.70% 82.60% 75.00% 78.00% 72.70% R5 88.40% 90.30% 87.60% 76.70% 87.80% 83.10% R6 77.30% 77.70% 76.80% 75.40% 78.00% 72.40% R7 76.10% 81.60% 78.70% 73.80% 78.70% 71.70% R8 75.05 79.30% 78.00% 75.40% 78.20% 72.90%
Fig. 10. Trained model descriptions.
class. The green boxes clearly exhibit good performance of classifier and pink boxes demonstrates incorrect execution. In class 1 the described impression of the correct class proves as 91 while mistaken expectations concludes 32. Be that as it may, for class 2 the arranged right perceptions are 301 and wrong perceptions are 10. Positive prescient qualities are shown in Fig. 11(b) the green boxes are for the effectively anticipated focuses in each class, which is 90% for each class.
The incorrect revelation measures are seemed pink for wrongly prediction appeared in Fig. 11(b). For both classes it is 10%. Classifier results reliant on each class is found in Fig. 11(c) exhibits True Positive Rates and False Negative Rates. The plot depicts genuine class in two segments on the right. The plot verifies for class 1 classifier classifies 74%
Fig. 11. (a) Confusion Matrix; (b) Positive Predictive Values and False Discovery Rates; (c) True Positive Rate and False Negative Rate.
Fig. 12. (a) Original data in normalized scaling; (b) Original data in standardized scaling.
precisely and 26% erroneously and for class 2 it performs well 97% successfully while 3% mistakenly. Anyway regardless, the parallel co-ordinate show the components through which the model is arranged and checked. Fig. 12(a) and (b) exhibits the principal data in the normalized structure and standardized structure exclusively. Fig. 13(a) and (b) indicates exhibit the first information in the normalized structure and standardized structure individually. Blue shading addresses the class 1 and red shading addresses the class 2. The x-turn the factors (with-draw highlights) and the y-hub speaks to their potential.The cross defines the erroneous expectations of prepared model. The delayed consequences of Quadratic SVM are better than other SVM.
The results of Quadratic SVM are better than other SVM classifiers can also be verified using the ROC curves. Fig. 14 shows AUC of Linear, Qudratic and Cubic SVM classifiers and Fig. 15 shows AUC of Fine, Medium and Coarse Gaussian SVM classifeirs. AUC of Quadratic SVM classifier is 0.94 which is greater than other SVM classifiers.
Fig. 13. (a) Model predictions in normalized scaling; (b) Model predictions in standardized scaling.
Fig. 14. (a) Linear SVM; (b) Quadratic SVM (c) Cubic SVM.
Fig. 15. (a) Fine Gaussian SVM; (b) Medium Gaussian SVM (c) Coarse Gaussian SVM.
V. CONCLUSION
As Parkinson is dynamic ailment for that the gait exam-ination is basic step. Gait is the method for strolling. It’s an eccentricity which may adequately helps in location of Parkin-son subject. As this examination was centered around exact and accurate investigation of gait that guides in separating between Parkinson patient and control subject. As most of the previous research uses kinect sensors or accelerometers for detecting gait and for recognition and processing multiple and complex algorithms are used this proposed system utilized the appropriate dataset of VGRF from feet. The features are extracted utilizing WPT. Five sorts of features are extracted. The amount of features depends on the window size and the level. For the best results level=7 and 1024 window size is used. The wavelet type preferred is “db2”. For classification and comparisons of sensors SVM is used.
Assessment of the outcomes demonstrated that a solitary force sensor on right foot at position 5 evidently recognize persistent and sound subject by by analyzing gait features in Parkinson patient. The aftereffects of an examination demon-strated that SVM classifier shows 90.3% exactness that is superior to different classifiers being tested. Assessment of the outcomes demonstrated that a solitary constrain sensor located at right foot’s medial portion conclusively recognize Parkinson’s patient because of stride features incorporates into Parkinson patients. In future, the training of input features can be performed for the need of latest training algorithms. The resulted features can be trained utilizing deep learning to produce extensive results and making framework increasingly precise to manage substantial dataset and deliver progressively best outcomes.
REFERENCES
[1] M. Hariharan, K. Polat, and R. Sindhu, “A new hybrid intelligent system for accurate detection of parkinson’s disease,” Computer methods and programs in biomedicine, vol. 113 3, pp. 904–13, 2014.
[2] M. Plotnik, N. Giladi, Y. Balash, C. Peretz, and J. M. Hausdorff, “Is freezing of gait in parkinson’s disease related to asymmetric motor function?,” Annals of neurology, vol. 57, pp. 656–63, May 2005. [3] W. Tao, T. Liu, R. Zheng, and H. Feng, “Gait analysis using wearable
sensors.,” Sensors (Basel, Switzerland), vol. 12, no. 2, pp. 2255–83, 2012.
[4] A. Godfrey, “Wearables for independent living in older adults: Gait and falls,” Maturitas, vol. 100, pp. 16 – 26, 2017.
[5] L. Ai, J. Wang, and R. Yao, “Classification of parkinsonian and essential tremor using empirical mode decomposition and support vector machine,” Digit. Signal Process., vol. 21, pp. 543–550, July 2011. [6] S. Haller, S. Badoud, D. Nguyen, V. Garibotto, K. Lovblad, and
P. Burkhard, “Individual detection of patients with parkinson disease using support vector machine analysis of diffusion tensor imaging data: Initial results,” American Journal of Neuroradiology, 2012.
[7] L. Palmerini, L. Rocchi, S. Mazilu, E. Gazit, J. Hausdorff, and L. Chiari, “Identification of characteristic motor patterns preceding freezing of gait in parkinson’s disease using wearable sensors,” Frontiers in Neurology, vol. 8, p. 394, 08 2017.
[8] S. Das, L. Trutoiu, A. Murai, D. Alcindor, M. Oh, F. De la Torre, and J. Hodgins, “Quantitative measurement of motor symptoms in parkinson’s disease: A study with full-body motion capture data,” in Engineering in Medicine and Biology Society, EMBC, 2011 Annual International Conference of the IEEE, pp. 6789–6792, 2011.
[9] B. M. Eskofier, S. I. Lee, M. Baron, A. Simon, C. F. Martindale, H. Gaßner, and J. Klucken, “An overview of smart shoes in the internet of health things: Gait and mobility assessment in health promotion and disease monitoring,” Applied Sciences, vol. 7, no. 10, 2017.
[10] B. Pogorelc, Z. Bosni´c, and M. Gams, “Automatic recognition of gait-related health problems in the elderly using machine learning,” Multimedia Tools Appl., vol. 58, pp. 333–354, May 2012.
[11] S. Minto, D. Zanotto, E. M. Boggs, G. Rosati, and S. K. Agrawal, “Validation of a footwear-based gait analysis system with action-related feedback,” IEEE Transactions on Neural Systems and Rehabilitation Engineering, vol. 24, pp. 971–980, Sept 2016.
[12] P. Ren, E. Karahan, C. Chen, R. Luo, Y. Geng, J. F. B. Bayard, M. L. Bringas, D. Yao, K. M. Kendrick, and P. A. Valdes-Sosa, “Gait influence diagrams in parkinson’s disease,” IEEE Transactions on Neural Systems and Rehabilitation Engineering, vol. 25, pp. 1257–1267, 2017. [13] R. Soubra, M. O. Diab, and B. Moslem, “Identification of parkinson’s
disease by using multichannel vertical ground reaction force signals,” in 2016 International Conference on Bio-engineering for Smart Tech-nologies (BioSMART), pp. 1–4, Dec 2016.
[14] S. V. Perumal and R. Sankar, “Gait monitoring system for patients with parkinson’s disease using wearable sensors,” in 2016 IEEE Healthcare Innovation Point-Of-Care Technologies Conference (HI-POCT), pp. 21– 24, Nov 2016.
[15] J. Camps, A. Sam`a, M. Mart´ın, D. Rodr´ıguez-Mart´ın, C. P´erez-L´opez, S. Alcaine, B. Mestre, A. Prats, M. C. Crespo, J. Cabestany, `A. Bay´es, and A. Catal`a, “Deep learning for detecting freezing of gait episodes in parkinson’s disease based on accelerometers,” in Advances in Compu-tational Intelligence(I. Rojas, G. Joya, and A. Catala, eds.), (Cham), pp. 344–355, Springer International Publishing, 2017.
[16] K. D. Das, A. J. Saji, and C. S. Kumar, “Frequency analysis of gait sig-nals for detection of neurodegenerative diseases,” in 2017 International Conference on Circuit ,Power and Computing Technologies (ICCPCT), pp. 1–6, April 2017.
[17] P. Tahafchi, R. Molina, J. Roper, K. Sowalsky, C. Hass, A. Gunduz, M. Okun, and J. W. Judy, “Freezing-of-gait detection using temporal, spatial, and physiological features with a support-vector-machine clas-sifier,” 07 2017.
[18] N. Tahir and H. Manap, “Parkinson disease gait classification based on machine learning approach,” Journal of Applied Sciences, vol. 12, no. 2, pp. 180–185, 2012.
[19] H. H. Manap, N. M. Tahir, and A. I. M. Yassin, “Statistical analysis of parkinson disease gait classification using artificial neural network,” in 2011 IEEE International Symposium on Signal Processing and Information Technology (ISSPIT), pp. 060–065, Dec 2011.
[20] M. Gabel, R. Gilad-Bachrach, E. Renshaw, and A. Schuster, “Full body gait analysis with kinect,” in 2012 Annual International Conference of the IEEE Engineering in Medicine and Biology Society, pp. 1964–1967, Aug 2012.
[21] A. Goldberger, L. Amaral, L. Glass, J. Hausdorff, P. Ivanov, R. Mark, J. Mietus, G. Moody, C. Peng, and H. Stanley, “Physiobank, phys-iotoolkit, and physionet: Components of a new research resource for complex physiologic signals,” Circulation, vol. 101, no. 23, pp. e215– e220, 2000.
[22] A. van der Hoorn, A. L. Bartels, K. L. Leenders, and B. M. de Jong, “Handedness and dominant side of symptoms in parkinsons disease.,” Parkinsonism and related disorders, vol. 17, pp. 58–60, Jan 2011. [23] “Infotronic.nl - infotronic resources and information’,
http://www.infotronic.nl/cdg,”
[24] Y. Rong, D. Hao, X. Han, Y. Zhang, J. Zhang, and Y. Zeng, “Clas-sification of surface emgs using wavelet packet energy analysis and a genetic algorithm-based support vector machine,” Neurophysiology, vol. 45, pp. 39–48, Jan 2013.
[25] R. Polikar, The wavelet tutorial. 1996. [26] “Wavelet packets transform-mathswork,” 2018. [27] “Support vector machine for binary classification,” 2018. [28] “Train classification models in classification learner app,” 2018.