Journal of Radioanalytical and Nuclear Chemistry, Vol. 259, No. 1 (2004) 177–180
0236–5731/2004/USD 20.00 Akadémiai Kiadó, Budapest
© 2004 Akadémiai Kiadó, Budapest Kluwer Academic Publishers, Dordrecht
Dating of Black Sea sediments from Romanian coast
using natural
210Pb and fallout
137Cs
G. A. Ayç#k,1* D. Çetaku,2 H. N. Erten,2 *. Saliho,lu3
1 Turkish Atomic Energy Authority, Ankara Nuclear Research and Training Center, 06100 Ankara, Turkey 2 Bilkent University, Faculty of Science, Chemistry Department, Ankara, Turkey
3 Middle East Technical University, Institute of Marine Science, Mersin, Turkey (Received July 21, 2003)
The sediment samples collected near the shore from Romania were used for the determination of levels of natural 210Pb, 226Ra and fallout 137Cs
radionuclides. The sediment samples were dried and ground to a fine powder. Airtight sealed samples were counted by gamma-spectrometer with 110 cm3 well-type HPGe detector for one week each. By using the isotopic analysis results, sediment accumulation rate was determined. A
sedimentation rate of 0.20±0.01 cm.y–1 was determined using 210Pb method and 0.15±0.03 cm.y–1 using 137Cs isotope. Fallout peak from
Chernobyl reactor accident, as well as the peaks due to nuclear tests, act as time markers.
Introduction
Concentrations of pollutants in sediments of a water body are a valuable source for obtaining information about rate of accumulation, distribution, behavior and flux of pollutants and in general, the impact of natural and man-made events that have been occurring in the surrounding ecosystem.
Sediment composition can be used for the assessment of marine pollution, particularly in terms of mostly metallic trace elements. Metals enter into the marine environment from sources such as river runoff, wind, hydrothermal venting and man-made activities etc., and also because of human activities by introducing through river and atmospheric transport. Rivers are the major source of particulate and dissolved metals. The dissolved metals that reach the open sea are adsorbed onto the surfaces of clay minerals and are quite reactive, so they are converted to the solid form. Therefore, the sedimentary rocks are enriched in trace metals.
Measurements of natural radionuclides in the marine environment continue to be one of the major tasks for a large number of laboratories throughout the world. The commonly used radioisotope for dating sediments 210Pb, is a member of the naturally occurring 238U (T1/2=4.47.109 y) series. 210Pb is involved in the sedimentary processes through the following events. The noble gas nuclide 222Rn (T
1/2=3.82 d), a member of 238U decay chain, diffuses out of the earth’s crust and is emitted to the atmosphere from the lithosphere surface water and airborne dust. Radon remains in the atmosphere until it decays. Decay products of 222Rn, including 210Pb, are removed from the atmosphere by dry fallout and precipitation. Thus, it is provided a continuous flux of 210Pb to land and water surfaces. The 210Pb, which is precipitated from the atmosphere is defined as “unsupported” 210Pb. The 210Pb, which is * E-mail: [email protected]
directly resulted from the decay of 238U series in the geographical region as a background radioactivity is defined as “supported” 210Pb. In water-marine environment 210Pb is scavenged by suspended particulate matter by several mechanisms and accumulated in the sediments. It decays there with a half-life of 22.3 years and can be used for the determination of sediment accumulation rate and dating upper layers of sediments on a time scale of 100–200 years, in pre-industrial and industrial area.1–7
The distribution pattern of 137Cs (T
1/2=30.14 y) present in sediments represents time markers and this is used as a method of dating. The introduction of 137Cs into the atmosphere occurred as a result of nuclear tests after 1950s and in 1986 as a result of Chernobyl accident.
In this paper, we report the accumulation rate of Black Sea sediments obtained from the Romanian shores using 210Pb, 226Ra and 137Cs radioisotopes by gamma-ray spectrometry. We studied with these sediments because Danube River, which flows into the Black Sea on the shore of Romania, is one of the main sources of pollution for the Black Sea by transporting the pollutants passing through European countries.
Experimental
The marine sediment core was collected from North-Western Black Sea, near Danube Delta in 1994. The exact location of the sampling point is 43° 81 70’ in latitude (N), 30° 37 40’ in longitude (E). A gravity corer was used to get a vertical sampling. It had a PVC tube with inner diameter of 6.5 cm. The PVC tube was put inside another metallic tube and was connected to a 30 kg lead weight to get greater degree of penetration. The undisturbed sediment was collected in the PVC tube.
G. A. AYÇIK et al.: DATING OF BLACK SEA SEDIMENTS FROM ROMANIAN COAST
178
After collection, samples were dried and sectioned at 1 cm intervals. Subsamples of each slice were open-air dried for 5–6 days and were ground to a fine powder by using agate mortar and pestle. Airtight sealed samples in counting tubes were stored for 2–3 weeks to establish secular equilibrium between 226Ra, 222Rn and its short-lived progeny 214Pb and 214Bi. Then the samples were measured by direct gamma-ray spectrometry. In the spectroscopic system, the detector used for gamma-measurements was a 110 cm3 well-type high purity germanium p-type HPGe detector with an energy resolution of 2.1 keV at 1.33 MeV of 60Co. The dimensions of well were: 16 mm of inner diameter, 40 mm of height. Materials used in the detector assembly and cryostat was selected for low radioactivity content. The shield was made of 10 cm of lead and was lined with 1 mm of cadmium and 0.5 mm of copper. The detector coupled to a 64k channel analyzer and associated input/output data units with built-in microprocessor which automatically analyzed the photopeak areas. Dead times were typically less than 1.5% due to the low specific activity. The counting time was one week for each sample. Since the count rates from the samples were very low, the counting times
were quite long to achieve statistical uncertainties less than 1% on even the most intense lines. Ortec Omnigam B-30 computer program was used to check the peak’s shape and full-width at half-maximum, and to calculate peak areas. Using this gamma analysis program it was possible to resolve overlapped peaks.
The background was measured with the sugar-filled aforementioned counting tubes under identical geometry and it was collected for the same time as that for the samples. Self-absorption effect was assumed to be negligible since sediment samples of about 1 g were used.
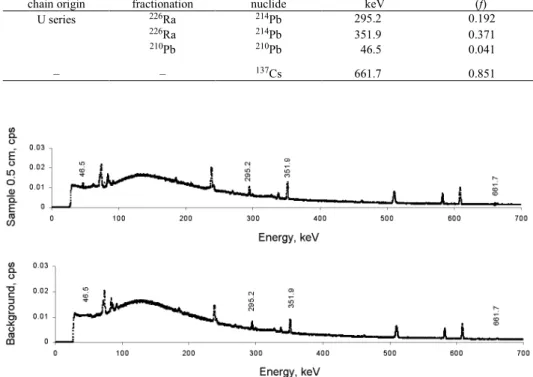
Calibration of the experimental setup with primer standards for well-type tube geometry was done initially. Unknown concentrations were then determined by counting their gamma-rays in the same geometry. The results were also verified with values determined by the use of IAEA-315 Marine and IAEA-SL-2 Lake Sediment standards. All gamma-ray data were used in the gamma-ray spectral analyses as presented in Table 1. The gamma-spectra of background and sediment sample in depth of 0.5 cm are shown in Fig. 1.
Table 1. Gamma-rays employed for radiation counting Natural decay chain origin Source after fractionation Gamma producing nuclide Gamma energy, keV Gamma yield (f) U series 226Ra 214Pb 295.2 0.192 226Ra 214Pb 351.9 0.371 210Pb 210Pb 46.5 0.041 – – 137Cs 661.7 0.851
G. A. AYÇIK et al.: DATING OF BLACK SEA SEDIMENTS FROM ROMANIAN COAST
179
Results and discussion
The gamma-ray analysis aimed the identification and analysis of radioactive particles in the cores studied. Sediment accumulation rates were determined by using these isotopes. “Unsupported” 210Pb activities were obtained by subtracting the “supported” value of 210Pb activities from the total 210Pb activity of each sample. Supported value of 210Pb is best determined by assay of 226Ra, assuming secular equilibrium. The supported 210Pb activity, on the other hand, was determined from the lowest, constant activity region by taking the average values of the last two slices, which were assumed to contain negligible amounts of unsupported 210Pb.
The activity concentrations of 210Pb, 226Ra and 137Cs measured in sediments are given in Tables 2 and 3. The results are given with an error of ±2 . “Depth” values on the tables are the actual depths of the sediment samples in the gravity corer below the sediment–water interface. In order to correct for the compaction effect, CETAKU8 obtained the corrected depth (cm) and mass depth (g.cm–2) by using porosity profile and assuming the densities of water and sediment to be 1.02 and
2.65 g.cm–3, respectively. It is observed that the total 210Pb activity is nearly constant within about 10 cm from the sediment–water interface. The total activity includes an “unsupported” activity fraction, which decreased with depth and in addition to the constant region in the uppermost sediment sections. Similar constant activity regions were reported in the literature.9 The supported 210Pb may be assumed to be constant within the length of the core.
A semi-log plot of specific activities of unsupported 210Pb versus corrected depth in the gravity core was obtained and the rate of sediment accumulation rate was computed as 0.20±0.01 cm.y–1 from the slope of activities in the exponential decay region and a lower region and the half-life of 210Pb (22.3 y).
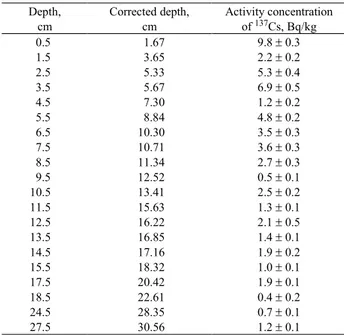
Table 3 shows the 137Cs activity distribution in each section of the sediment core. The first higher value belongs to the upmost surface and is certainly due to the Chernobyl accident on 1986, while the others at 4–5 cm depth arise from nuclear tests during 1954–1964. According to this distribution pattern of 137Cs, a sedimentation rate of 0.15±0.03 cm.y–1 was determined. This is in good agreement with the sedimentation rate determined using the 210Pb method.
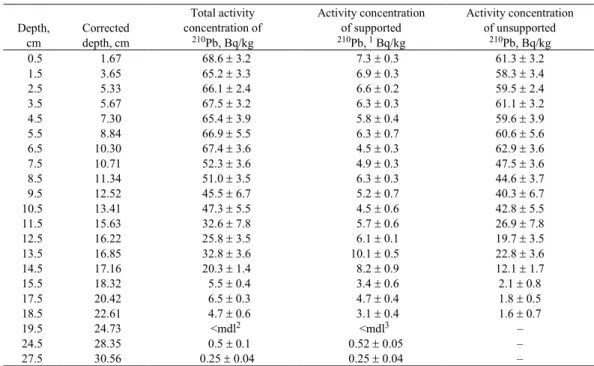
Table 2. Activity concentrations of total 210Pb, supported 210Pb (226Ra) and unsupported 210Pb for each cm section of
sediment core and corrected linear depth in correspond Depth, cm Corrected depth, cm Total activity concentration of 210Pb, Bq/kg Activity concentration of supported 210Pb, 1 Bq/kg Activity concentration of unsupported 210Pb, Bq/kg 0.5 1.67 68.6 ± 3.2 7.3 ± 0.3 61.3 ± 3.2 1.5 3.65 65.2 ± 3.3 6.9 ± 0.3 58.3 ± 3.4 2.5 5.33 66.1 ± 2.4 6.6 ± 0.2 59.5 ± 2.4 3.5 5.67 67.5 ± 3.2 6.3 ± 0.3 61.1 ± 3.2 4.5 7.30 65.4 ± 3.9 5.8 ± 0.4 59.6 ± 3.9 5.5 8.84 66.9 ± 5.5 6.3 ± 0.7 60.6 ± 5.6 6.5 10.30 67.4 ± 3.6 4.5 ± 0.3 62.9 ± 3.6 7.5 10.71 52.3 ± 3.6 4.9 ± 0.3 47.5 ± 3.6 8.5 11.34 51.0 ± 3.5 6.3 ± 0.3 44.6 ± 3.7 9.5 12.52 45.5 ± 6.7 5.2 ± 0.7 40.3 ± 6.7 10.5 13.41 47.3 ± 5.5 4.5 ± 0.6 42.8 ± 5.5 11.5 15.63 32.6 ± 7.8 5.7 ± 0.6 26.9 ± 7.8 12.5 16.22 25.8 ± 3.5 6.1 ± 0.1 19.7 ± 3.5 13.5 16.85 32.8 ± 3.6 10.1 ± 0.5 22.8 ± 3.6 14.5 17.16 20.3 ± 1.4 8.2 ± 0.9 12.1 ± 1.7 15.5 18.32 5.5 ± 0.4 3.4 ± 0.6 2.1 ± 0.8 17.5 20.42 6.5 ± 0.3 4.7 ± 0.4 1.8 ± 0.5 18.5 22.61 4.7 ± 0.6 3.1 ± 0.4 1.6 ± 0.7 19.5 24.73 <mdl2 <mdl3 – 24.5 28.35 0.5 ± 0.1 0.52 ± 0.05 – 27.5 30.56 0.25 ± 0.04 0.25 ± 0.04 –
1 Obtained from 226Ra measurements. 2 mdl in 210Pb measurements is 0.20 Bq/kg. 3 mdl in 226Ra measurements is 0.15 Bq/kg.
G. A. AYÇIK et al.: DATING OF BLACK SEA SEDIMENTS FROM ROMANIAN COAST
180
Table 3. Activity concentration of 137Cs for each cm section of
sediment core and corrected linear depth in correspond Depth, cm Corrected depth, cm Activity concentration of 137Cs, Bq/kg 0.5 1.67 9.8 ± 0.3 1.5 3.65 2.2 ± 0.2 2.5 5.33 5.3 ± 0.4 3.5 5.67 6.9 ± 0.5 4.5 7.30 1.2 ± 0.2 5.5 8.84 4.8 ± 0.2 6.5 10.30 3.5 ± 0.3 7.5 10.71 3.6 ± 0.3 8.5 11.34 2.7 ± 0.3 9.5 12.52 0.5 ± 0.1 10.5 13.41 2.5 ± 0.2 11.5 15.63 1.3 ± 0.1 12.5 16.22 2.1 ± 0.5 13.5 16.85 1.4 ± 0.1 14.5 17.16 1.9 ± 0.2 15.5 18.32 1.0 ± 0.1 17.5 20.42 1.9 ± 0.1 18.5 22.61 0.4 ± 0.2 24.5 28.35 0.7 ± 0.1 27.5 30.56 1.2 ± 0.1 Conclusions
The sedimentation rates obtained in this study can be considered as a relatively high sedimentation rate for the Black Sea region compared to the values of sedimentation rates given in other studies.10–12 The main reason of this high value is probably consequence
of collecting samples from an area close to Danube River’s delta. Danube is a large river, passing through several European countries, thus it carries large flux of particulate matter into the sea.
According to our results, the 137Cs method as 210Pb method can also be considered as a useful method in the chronology of the sea sediments where the average depth of the region is of the order of that of lakes.
137Cs and 210Pb results are complemented by XRF and XRD techniques and it is observed that there is a good correlation between the results obtained by gamma-spectrometry and by XRF and XRD techniques.8
References
1. E. D. GOLBERG, Radioactive Dating, IAEA, Vienna, 1963, p. 121. 2. H. GAGGELER, H. R. VON GUNTEN, U. NYFELE, Earth Planet. Sci.
Lett., 33 (1976) 110.
3. P. G. APPLEBY, P. J. NOLAN, D. W. GRIFFORD, M. J. GODFREY, F. OLDFIELD, N. J. ANDERSON, R. W. BATTARBEE, Hydrobiologia, 143 (1986) 21.
4. C. L. SCHELSKE, A. PEPLOW, M. BRENNER, G. N. SPENCER, J. Paleolimnol., 10 (1994) 115.
5. H. N. ERTEN, Pure Appl. Chem., 69 (1997) 71.
6. J. A. ROBBINS, J. R. KREZOSKI, S. C. MOZLEY, Earth Planet. Sci. Lett., 36 (1977) 325.
7. J. N. SMITH, A. WALTON, Geochim. Acta, 44 (1980) 225. 8. D. CETAKU, Radiochronology of Marine Sediments Using Pb-210
and Cs-137, Complemented by XRF and XRD Techniques, Ms. Thesis, Bilkent University, Ankara, 2002.
9. W. W. FLYNN, Anal. Chim. Acta, 43 (1968) 221.
10. B. R. HARVEY, A. K. YOUNG, Sci. Total Environ., 69 (1988) 13. 11. IAEA TC-RER/2/003, Marine Environmental Assesment in the
Black Sea Region, Progress Report, Vienna, 2000.
12. H. N. ERTEN, A. GOKMEN, M. YILDIZ, I. SALIHOGLU, J. Environ. Radioact., 33 (1995) 91.