RISK ANALYSIS IN CONSTRUCTION BUSINESS
THESIS
SUBMITTED TO THE DEPARTMENT OF MANAGEMENT
AND THE GRADUATE SCHOOL OF BUSINESS
ADMINISTRATION OF BILKENT UNIVERSITY
IN PARTIAL FULFILLMENT OF THE REQUIREMENTS FOR
THE DEGREE OF MASTER OF BUSINESS ADMINISTRATION
By
MEHMET ALİ ERSARI
I certify that I have read this thesis and in my opinion it is fully adequate, in scope
and in quality, as a thesis for the degree of Master of Business Administration.
Dr. Erdal Erel
I certify that I have read this thesis and in my opinion it is fully adequate, in scope
and in quality, as a thesis for the degree of Master of Business Administration.
Dr. Zeynep Önder
I certify that I have read this thesis and in my opinion it is fully adequate, in scope
and in quality, as a thesis for the degree of Master of Business Administration.
Dr. Yeşim Çilesiz
Approved for the Graduate School of Business Administration
\f
(/
^'1
/
\ U
¿1
ABSTRACT
RISK ANALYSIS IN CONSTRUCTION BUSINESS
MEHMET ALİ ERSARI
Master of Business Administration
Supervisor; Dr. ERDAL EREL
November 1996
In this study, the concept of risk management in construction industry is
introduced with a presentation of the classification of risks and their possible
counteractions. Among the three major processes of risk management framework
(risk identification, risk analysis and risk response), risk analysis is demonstrated for
a building construction which has a unit price contract. Probability Analysis/Monte
Carlo Simulation is used for the analysis by means of computer software “Predict”.
The analysis is carried out for design risks. Then, some scenarios are developed
with certain assumptions, and the analysis is performed with financial risks and acts
of God risks introduced. The results of the analysis show that, the cost of
construction may vary a lot. The results are presented as probability distributions
with comments and recommendations.
Keywords: Risk Management, Risk Analysis. Monte Carlo Simulation, Construction
ÖZET
İNŞAAT SEKTÖRÜNDE RİSK ANALİZİ
MEHMET ALİ ERSARI
Yüksek Lisans Tezi, İşletme Enstitüsü
Tez Yöneticisi; Dr. ERDAL EREL
Kasım 1996
Bu çalışmada, inşaat sektöründe risk yönetimi kavramı açıklanmış ve riskler
sınıflandırılarak takip edilebilecek muhtemel stratejiler ile birlikte sunulmuştur. Risk
yönetimi modelinin esasını oluşturan üç bölümünden (riskin tanımlanması, riskin
analizi ve karar verme), risk analizi, birim fiyat sözleşmeli bir bina inşaatına
uygulanmıştır. Olasılık Analizi/Monte Carlo Benzetimi kullanılmış, uygulamada
“Predict” adlı bilgisayar programından yararlanılmıştır. Analiz önce tasarım kaynaklı
riskler için yapılmış, daha sonra belirli varsayımlarla oluşturulan senaryolarda
finansal riskler ve doğal riskler de dahil edilmiştir. Analiz sonuçları, maliyetlerin
oldukça değişken olabileceğini göstermektedir. Sonuçlar, yorum ve önerilerle birlikte
olasılık dağılımları olarak sunulmuştur.
Anahtar terimler: Risk Yönetimi, Risk Analizi, Monte Carlo Benzetimi, İnşaat
ACKNOWLEDGEMENTS
I would like to express my gratitude to my family for everything they have
done for me. I would like to thank to Çağan Güngör for his assistance. I would also
like to thank to all members of the Department of Management of Bilkent University.
TABLE OF CONTENTS
LINTRODUCTION... 1
1.1. Thesis Objective... 3
1.2. Thesis Outline... 4
II. RISK MANAGEMENT IN CONSTRUCTION BUSINESS... 5
11.1. Risk Identification... 7
11.2. Risk Analysis and Evaluation Process... 11
11.3. Risk Response... 13
ll.4.System Administration... 17
II. S.The importance of the type of contract... 19
III. METHODOLOGY... 22
III. 1.Sensitivity Analysis...23
111.2. Probability Analysis... 25
111.3. Aggregation, disaggregation...29
IV. APPLICATION...31
IV.I.Aboutthe contractor firm...31
IV.2.Description of Project...31
IV.3.A specific look at the risk categories... 34
IV.4.The reasons of the changes in the first estimate... 36
IV.S.Analysis... 38
IV.6.Further analysis...43
IV.6.1.Analysis with financial risks introduced...43
IV.6.2.Analysis with acts of God risks introduced... 49
V. CONCLUSION... 53
BIBLIOGRAPHY...56
LIST OF TABLES
1. Risk categories and their management strategies...10
2. First estimate figures of the application project...32
3. The coefficients of each risk element which are used to
obtain their minimum and maximum values... 40 4. Summary of analysis... 52
LIST OF FIGURES
1. Risk management framework... 7
2. An illustration of the Monte Carlo method... 28
3. An illustration of the probability distribution for any cost element... 40
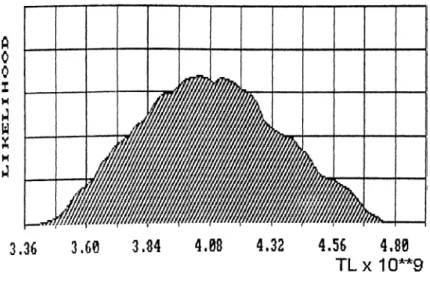
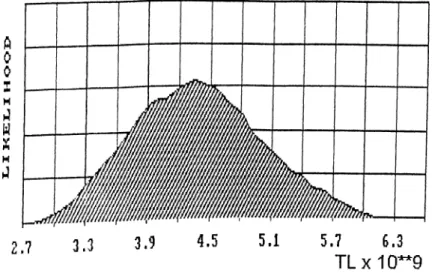
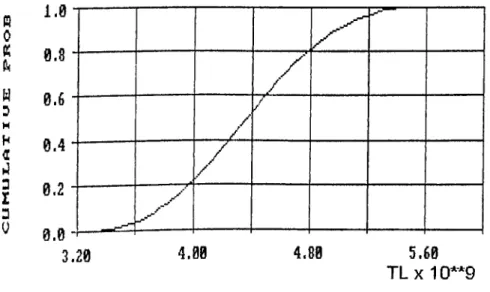
4. PDF of total project cost according to 1990 unit prices... 42
5. CDF of total project cost according to 1990 unit prices... 42
6. An illustration of the possible distribution of escalation... 44
7. The distribution of a hypothetical price increase of a price index composed of certain materials...45
8. PDF of second year payment according to certain assumptions... 46
9. CDF of second year payment according to certain assumptions... 46
10. PDF of second year payment with single point estimates... 47
11. CDF of second year payment with single point estimates... 48
12. An illustration of the distribution of the time increase in case of a flood.. 50
13. PDF of second year payment in case of a probable flood... 50
!. INTRODUCTION
Construction, like most of the other industries, has a risk in its profit structure.
The construction process is complex and characterized by many uncertainties.
Most contractors, however, have developed a series of rules of thumb that
they apply in dealing with risk. These rules generally rely on the contractor’s
experience and judgment. Contractors do not usually quantify uncertainty and
systematically assess the risks involved in a project. Even if they assess these risks,
they do not evaluate the consequences associated with these risks.
Experience of many projects indicates poor performance in terms of
achieving time and cost targets. Many cost and time overruns are attributable to
either unforeseen events, which may or may not have been anticipated by an
experienced project manager, or foreseen events for which uncertainty was not
appropriately accommodated. It is suggested that a significant improvement to
project management performance may result from greater attention to the whole
process of risk management.
The term risk management applied to investment appraisal and, more
specifically, to the construction industry refers to the assessment of and reaction to
Costs are only estimates no matter how precise and reliable the data on which they
are based.
The aim of risk management is to help parties in construction business in
identifying, analyzing, and managing risks in a construction project, by developing
simple, practical techniques that address risk and uncertainty explicitly, and give the
decision maker comprehensible information on which to base his judgments.
What is risk?
Risk is a pervasive part of all actions. It would seem on the surface that the
term risk is a simple well understood notion. However, its definition is elusive, and its
measurement is controversial (Al-Bahar and Crandall 1990).
In the literature the word risk is used in many different meanings with many
different words such as hazard or uncertainty. It is found that there is no uniform or
consistent usage of the word risk in the literature. Also, most definitions of risk have
focused only on the downside associated with risk such as losses or damages, and
neglected the upside or opportunity such as profit or gains. But both sides of risk
should be recognized.
Since the existing literature often uses the terms risk and uncertainty
interchangeably it is beneficial to clarify the use of these terms. Uncertainty will be
used to represent the probability that an event occurs; thus a certain event has no
uncertainty. Risk can be defined as: affecting project objectives as a consequence of
The risk event, uncertainty of that event, and consequence of it. (Al-Bahar and
Crandall 1990)
The risk event: What might happen to the detriment or favor of the project.
The uncertainty of the event: How likely the event is to occur, i.e., the chance of the
event occurring. A sure or certain event does not create risk, although it may create
gain or loss.
Potential loss/gain: It is necessary that there be some amount of loss or gain
involved in the occurring of the event, i.e., a consequence of the event happening.
We will use loss as a general term to include personal injury and physical damage
and gain to include profit and benefit.
Symbolically, we could write this as: Risk = f(Uncertainty of event. Potential
loss/gain from event).
From this definition, uncertainty and potential loss or gain are necessary
conditions for riskiness. It may seem strange to refer to uncertainties about potential
gains as risks. However, even in situations of potential gains, uncertainty is
unattractive since the knowledge of the exact gains is unknown, and contractors are
reluctant to give credit to an unknown gain. Moreover, risk of gain always comes with
the risk of loss.
I.l. Thesis objective
The objective of this thesis is to introduce the concept of risk management in
the application of such a framework, especially the “risk analysis” part which is
harder to understand. A real life project will be used for the demonstration.
1.2. Thesis outline
In the second chapter, risk management in construction business will be
explained. The frameworks of some authors about the topic will be given.
In the third chapter a simple and demonstrative method is developed for the
application of the previously explained framework.
In the fourth chapter. The previously developed method is applied to a
project. The project is also described briefly in this chapter. The results and
conclusions about the application is presented.
In the fifth chapter, concluding remarks and suggestions for future work are
lI.RISK MANAGEMENT IN CONSTRUCTION BUSINESS
In construction, it is observed that the risk management function has been
closely linked with insurance. Many contractors think of risk management as
insurance management where the main objective is to find the optimal economic
insurance coverage for the insurable risks.
It should be emphasized that risk management has a broader meaning and
involves more than just insurance management. It is a quantitative systematic
approach to managing risks, faced by contractors. It deals with both insurable as
well as uninsurable risks and the choice of the appropriate technique or techniques
for treating those risks.
In the context of project management, risk management is defined as; “A
formal orderly process for systematically identifying, analyzing, and responding to
risk events throughout the life of a project to obtain the optimum or acceptable
degree of risk elimination or control.” (Al-Bahar and Crandall 1990)
Some writers systematized the process of risk management and established
a generally acceptable terminology. Wideman (1986) has proposed a theoretical
framework of a construction risk management model. With respect to this paper, Al-
by Wideman, and converted it into a completely defined management model of risks
in construction projects.
Some authors presented their frameworks for a risk management system in
construction business, which are very similar to each other. In this chapter a
comprehensive explanation of a framework about risk management will be given.
Perry and Hayes(1985). Flanagan, Kendell, Norman, and Robinson(1987), Al-Bahar
and Crandall(1990) give their own frameworks and hence are combined and
presented below.
With this system particular emphasis is placed on how to identify and
manage risks before, rather than after, they materialize into losses or claims. This
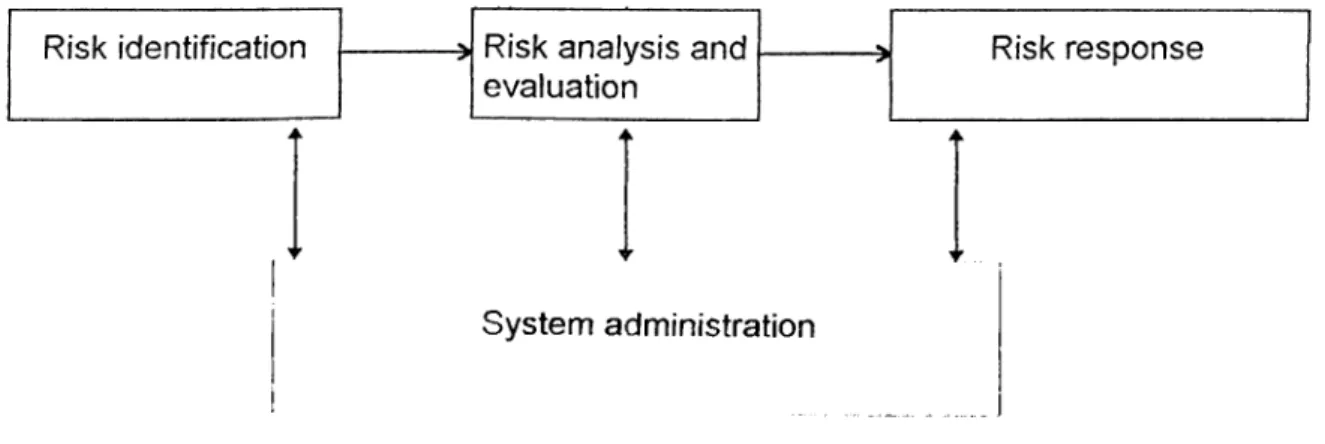
framework is illustrated in Figure 1. The proposed system consists of the following
four processes:
• Risk identification.
• Risk analysis and evaluation.
• Risk response
• System administration
The fourth process is introduced by Al-Bahar and Crandall (1990), while the
others see the first three items sufficient. In fact, as will be seen later, the fourth one
System administration
Figure 1. Risk management framework
II. 1. Risk Identification Process
Risk identification is the first process of the model. It is of considerable
importance since the processes of risk analysis and response management may
only be performed on identified potential risks. Therefore, the process must involve
an investigation into all possible potential sources of project risks and their potential
consequences. This is the most time consuming step of Risk Management and it
requires that the analyst be systematic, experienced and creative (Raftery 1994).
Al-Bahar and Crandall (1990) defines risk identification as; “the process of
systematically and continuously identifying, categorizing, and assessing the initial
significance of risks associated with a construction project." The aim is to identify
appropriate risks for each cost item. Also some of these risks may be common to
more than one item, such as, inflation and so some interdependencies may occur.
1. Preliminary Checklist
The preliminary checklist of potential projects risks is the starting point for
identifying risk, A failure to recognize the existence of one or more potential risks
may result in a disaster or foregoing an opportunity for gain resulting from proper
corrective action. Risk of all types that affect productivity, performance, quality, and
economy of construction should be included.
Many contractors abroad, utilize checklists or survey questionnaires, in
addition to their own past experience, to assist in preparing their checklist of
potential risks. These checklist can be used as a guide or starting point for the
development of a more accurate and precise checklist for the specific project in
hand. Despite the fact that substantial effort has been devoted to establishing a
systematic identification process, success is still heavily dependent upon the
experience combined with intuition of the contractor identifying the risk.
2. Identify Risk Events/Conseauence Scenarios
The second step of the risk identification process is the definition of the set of
credible risk events/consequence scenarios. This set represents all reasonable
possibilities associated with the realization of the primary source of risk included in
the preliminary checklist. The consequence can include economic gain/loss,
personal injury, physical damage, time and cost savings/overrun. Since most risks
that evolve in construction projects are financially related, the emphasis is the on the
financial consequence criterion as a uniform basis of assessment. Any other criteria
3. Risk Mapping
In event risk mapping, a graph of two dimensions or scales is proposed to
construct the risk map. In the first dimension uncertainty will be assessed with regard
to the probability of occurrence. In the second dimension, risk will be assessed with
regard to its potential severity. Such a two-dimension graph is considered an
important representation, and will enable the project manager to asses the relative
importance of the exposure to a potential risk in an early stage. As previously noted
risk is a function of the interaction between uncertainty and potential gain/loss and
the mapping function presents Iso-risk curves where each curve represents
equivalent risks but differences in uncertainty and gain/loss.
4. Risk Classification
The purpose of classification of risks is twofold; To expand the contractor’s
awareness about the risk involved, and to classify risks because the strategies a
contractor adopts to mitigate them will vary according to their nature.
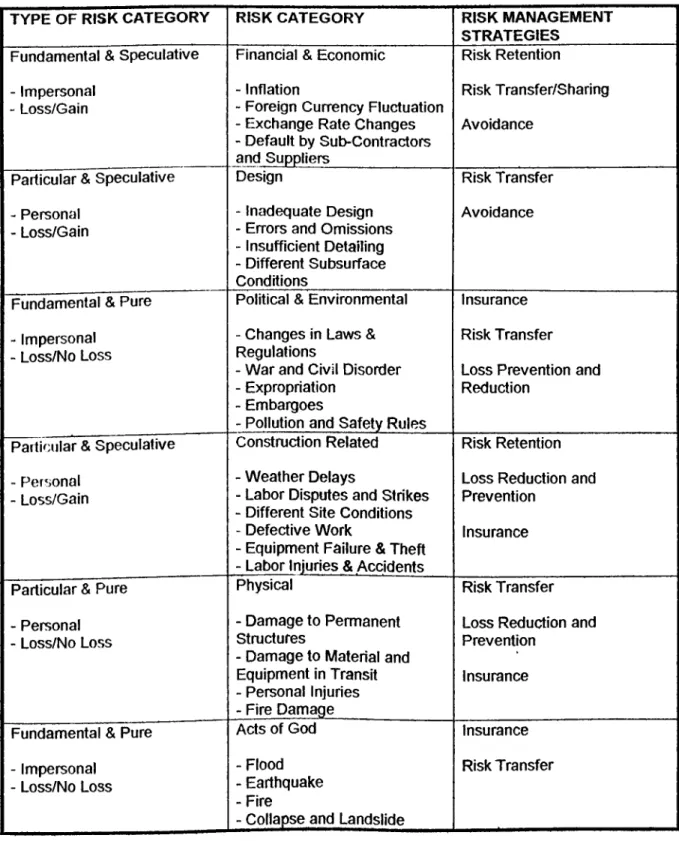
Al-Bahar and Crandall (1990), proposed a logical and formal classification
scheme of risk. The proposed scheme classifies potential risks according to their
nature and consequence. Such classification enables a fuller appreciation of the
factors influencing the risk, its consequences, and the different parties involved. The
proposed classification scheme is composed of six risk categories (see Table 1). The
selected categories illustrates the diversity of risks so that contractors don’t focus on
TYPE OF RISK CATEGORY RISK CATEGORY RISK MANAGEMENT STRATEGIES
Fundamental & Speculative Financial & Economic Risk Retention
- Impersonal - Loss/Gain
- Inflation
- Foreign Currency Fluctuation - Exchange Rate Changes - Default by Sub-Contractors and Suppliers
Risk Transfer/Sharing Avoidance
Particular & Speculative Design Risk Transfer
- Personal - Loss/Gain
- Inadequate Design - Errors and Omissions - Insufficient Detailing - Different Subsurface Conditions
Avoidance
Fundamental & Pure Political & Environmental Insurance
- Impersonal - Loss/No Loss
- Changes in Laws & Regulations
- War and Civil Disorder - Expropriation
- Embargoes
- Pollution and Safety Rules
Risk Transfer
Loss Prevention and Reduction
Particular & Speculative Construction Related Risk Retention
- Personal - Loss/Gain
- Weather Delays
- Labor Disputes and Strikes - Different Site Conditions - Defective Work
- Equipment Failure & Theft - Labor Injuries & Accidents
Loss Reduction and Prevention
Insurance
Particular & Pure Physical Risk Transfer
- Personal - Loss/No Loss
- Damage to Permanent Stmctures
- Damage to Material and Equipment in Transit - Personal Injuries - Fire Damage
Loss Reduction and Prevention
Insurance
Fundamental & Pure Acts of God Insurance
- Impersonal - Loss/No Loss
- Flood - Earthquake - Fire
- Collapse and Landslide
Risk Transfer
Table 1. Risk categories and their management strategies
5, Risk Category Summary Sheet
This is the final step in the risk identification process. The summary sheet will
integrate the participation of all personnel involved in the project management team.
Such participation is very important since judging the significance of any risk can not
be delegated to a single person. As information changes or different risk exposure
develops, the summary sheet is updated. In this way, it becomes a living picture of
the management’s understanding of the project risks.
11.2. Risk Analysis And Evaluation Process;
It is not enough to identify risk. From the risk mapping concept, some of the
risks identified are considered by project management to be more significant in
monetary terms and selected for further analysis. What is needed now is to
determine their significance quantitatively, through probabilistic analysis, before the
response management stage. The risk analysis and evaluation process is the vital
link between systematic identification of risks and management of the significant
ones. It forms the foundation for decision making between different management
strategies. Risk analysis and evaluation can be defined as a process which
incorporates uncertainty in a quantitative manner, using probability theory, to
evaluate the potential impact of risk. (Al-Bahar and Crandall 1990)
Data Collection
The first step in the risk analysis and evaluation process is the collection of
data relevant to the risk exposure to be evaluated. These data may come from
historical records that the contractor experienced in the past projects. In this case.
such data will be considered as objective or statistical in nature, and may be
presented as histograms or frequency distributions.
Unfortunately, in many cases, directly applicable historical data concerning
the risk are not available in an adequate amount, and a subjective assessment will
be required. Contractors are generally reluctant to document or record data as they
come from the field during construction or as the project proceeds. Even if they do
so, the data is incomplete. Hence available data are mainly subjective in nature and
must be obtained through careful questioning of experts or persons with the relevant
knowledge (Perry and Hayes 1985).
Modeling uncertainty
Modeling of the uncertainty of a risk exposure refers to the "explicit
quantification of likelihood of occurrence and potential consequences based on all
available information about the risk under consideration." (Al-Bahar and Crandall
1990) Likelihood of occurrence will be presented in terms of probability, and
potential consequences will be presented in financial monetary terms.
Probability is considered an explicit way of dealing with uncertainty. It is a
device that permits management to incorporate all the available information
concerning the likelihood of the occurrence of a risk event into a single number.
Adaptation of the definition of probability as a subjective judgment of opinion or
degree of belief that the risk event will occur, will be beneficial. This allows the
contractor to use his logic, intuition, and experience to assess probability values
based upon all data available to him. Subjectivity, for some authors, makes this
methodology unreliable; but an engineer should know that subjectivity is not just
guessing, but rather combining knowledge and experience. Also, it should be
remembered that subjectivity is present in all kinds of construction estimation.
Evaluation of potential impact of risk
Having modeled the uncertainty of different risk events, the next step is to
evaluate the overall impact of these risks in a single global picture. This evaluation
will combine the uncertainty of an event with the potential consequences. It is
possible to use "expected value" theory or decision tree analysis, but among the
analysis techniques given for risk management, sensitivity analysis and probability
analysis are more sophisticated, and hence one of these will be used in the
methodology. These two methods will be discussed later.
ll.3.Risk Response
Having identified ttie risk exposure, and evaluated probabilistically its
potential financial impact, it is time to take action. The contractor will formulate
suitable risk treatment strategies. These strategies are generally based on the
nature and potential consequences of the risk. The objective of these strategies is
twofold;(1) To remove as much as possible the potential impact; and (2) to increase
risk control (Flanagan, Kendell, Norman, and Robinson 1987).
This notion of reducing the potential impact and increasing risk control is very
important. A combination of very high financial impact and low controllability would
represent the unfavorable extreme. Where the contractor has very high controllability
In general, there are two basic approaches to managing a risk. The first is
through measures aimed at avoiding or reducing the probability and/or potential
severity of losses occurring. Such an approach is called risk control. The second is
through making provisions to finance the losses that do occur. Such an approach is
called risk finance. With this in mind, the response management process is
composed of two steps (Al-Bahar and Crandall 1990):
• Development of alternative risk management strategies.
• Recommendations and assignment of alternative strategies to project risks.
Development of Alternative strategies:
Within the framework of risk management, there are five alternative
strategies:
• risk avoidance
• Loss reduction and risk prevention.
• Risk retention
• Risk transfer (noninsurance or contractual).
• Insurance.
Risk avoidance: Avoidance is a useful, fairly common strategy to manage
risk. By avoiding risk exposure, the contractor knows that he will not experience the
potential losses that the risk exposure may generate. On the other hand, however,
the contractor loses the potential gains (opportunity) that may be derived from
assuming that exposure.
If a contractor is concerned about potential liability losses associated with
asbestos material or hazardous waste, he could avoid the risk by never acquiring
any project that involves operations with such materials. Similarly, a contractor may
avoid the political and financial risks associated with a project in a particular unstable
country by not bidding on projects in this country.
Loss Reduction and Risk Prevention: The second risk management strategy
is loss reduction and risk prevention programs. These programs are directed towards
decreasing the contractor’s exposure to potential risk by two ways: (1) Reducing the
probability of a risk; and (2) reducing the financial severity of risk if it does occur. For
example, the installation of an antitheft device on construction equipment may
reduce the chances of theft. A building sprinkler system, on the other hand, may
reduce the financial severity caused by fire.
Loss prevention programs are considered important for two reasons. First,
there is the effect on insurance premiums. It is known that by adopting a loss-
prevention program, the insurance premiums are reduced significantly. Second, the
success of a risk retention program is a direct function of the contractor’s ability to
prevent potential risks and reduce their severity.
Risk Retention and Assumption: Risk retention is becoming an increasingly
important aspect of risk management when dealing with project risks. Risk retention
is the internal assumption, partially or completely, of the financial impact of risk by
the firm. In adopting the risk retention strategy, however, it is important to distinguish
between two different types of retention. Risk retention can either be planned or
unplanned.
A planned risk retention is a conscious and deliberate assumption of
recognized or identified risks by the contractor. Under such a plan, risks can be
retained in any number of ways, depending upon the philosophy, particular needs
and financial capabilities of the contractor. On the other hand, unplanned risk
retention exists when a contractor does not recognize or identify the existence of a
risk and unconsciously assumes the loss that could occur. Another form of
unplanned retention occurs when the contractor has properly recognized the risk
exposure but has underestimated the magnitude of the potential losses.
Risk Transfer (Noninsurance or Contractual Transfer): In general, risk
transfers are possible, through negotiations, whenever the contractor enters into a
contractual arrangement with various parties such as an owner, subcontractors, or
material and equipment suppliers.
Most noninsurance risk transfers are accomplished through provisions in
contracts such as hold-harmless agreements and indemnity clauses or contractual
adjustments. Adjustment in price where an extra compensation will be granted to the
contractor if different subsurface conditions are encountered is an example. The
essential characteristic of the contractual transfer is that the potential consequences
of the risk, if it does occur, are shared with or totally carried by a party other than the
contractor.
Insurance: Commercial insurance is probably the most important and
frequently used method of handling risk that is employed by contractors. In fact, as
mentioned earlier, many contractors think of risk management as insurance
management. The majority of contractors rely upon insurance for serious loss
exposures through the purchase of an insurance policy with certain deductibles.
^gLsigP.0gOlPlMtgr>^3ti Strategies to Project Risks:
The assignment of risk-management strategies to project risks differs from
one contractor to another and from one project to another. During the assignment
process a contractor considers the severity of potential risk, its probability of
occurrence, and the resources that are available to counteract the potential loss if
the risk occurs. With this approach, the probability of occurrence ranks equally with
the severity of risk. The purpose is not to have one set of recommendations for all
project risks, but to recommend alternative risk management strategies which give
better control and reduce the financial impact of risk.
In table 1, a summary of the alternative risk management strategies are also
displayed corresponding to each risk category.
II.4. System Administration
The final phase is administering the risk-management process and as stated
before this phase is introduced by AI-Bahar and Crandall (1990). Two important
aspects of the system administration are considered; (1) Corporate risk management
policy formulation and (2) Review and monitoring of the risk management model
functions.
Corporate Risk Management Policy
In many construction firms, one can observe that the responsibility and
attendant authority for carrying out a company’s risk management policy is still ill-
defined. This may result in gaps in coverage, underinsurance as well as
overinsurance, excessive premiums, and overlapping of insurance coverage. The
first step is to set policies, procedures, goals, and responsibilities for risk
management. Many contractors have begun to realize the need to establish a more
formal risk management function in their organization.
A risk management policy is a formal plan, procedure, or document that
outlines the rules within which the risk manager may operate. It provides guidelines
for consistent actions in managing the risks. The main advantage of having such a
definite policy is that once the guidelines are adopted, the risk manager does not
have to restudy recurring problems before making decisions (Al-Bahar and Crandall
1990).
Records an<lReports
Keeping appropriate records is essential for risk management function
because these records form the basis for reports emanating from the risk-
management function. They provide the statistical data needed in deciding on an
appropriate course of action in regard to risk treatment. The contractor should
maintain records from the job site that might be unique to the risks envisioned in the
project. Such records include risk frequency, risk severity and consequences, and
other related information.
Evaluation of the risk management in construction business is an effort to
improve the procedures of risk identification, analysis and evaluation, and response
management. It must be recognized that the business environment and the
contractors operating within it are subject to constant changes. Therefore, an
effective risk management program is not static but must be dynamic and ongoing.
The various strategies or techniques adopted to handle project risks must be
monitored and adjusted to compensate for changes in risk levels associated with
changes in the firm’s operations, the business environment, and the insurance
industry.
11.5. The Importance of the Type of Contract
The realized values usually show great differences from the estimates. These
differences can be due to any of the factors listed in table 1. However, they
sometimes form risks not for the contractor, but for the administration. A single event
may form a risk item for the contractor in one project, but the same event may form a
risk item for the administration in another project. This is due to the type of the
contract. The project, discussed in chapter IV, is a unit price contract and therefore it
leaves little risk to the contractor. Nevertheless, this kind of a project could be
constructed with a lump sum agreement and would therefore leave most of the risks
to the contractor. It is obvious that choice of the contract type is a crucial part of risk
Management, but unfortunately for many instances the contractor firm does not have
the chance to decide on it. Rather, the client asks for tenders for a specific type of
contract. Risks for certain types of contracts are presented below.
Unit Price contracts: This is the most common type of contract that contractor
firms use, as most of the clients prefer using unit price contracts. This type of
contract allows certain changes (additions or ommisions) in the project, therefore it is
not necessary to prepare all the details beforehand. This introduces the flexibility in
the volume of work to be done. It is also possible to make some changes in the
project as long as they are applied at the prices specified in the contract. There
might occur some changes in the total cost of construction due to the changes of the
project. The contractor should consider some risks, but is able to ask for some price
increases for some of the materials, such as gasoline. As the unit prices are
determined by the Ministry of Public Works at the beginning of each year, it would
not be fair to neglect a possible increase in oil prices and continue to apply the same
unit prices. However, an increase in the wages of the workers is definitely a risk for
the contractor, as it is not possible to ask for an increase in unit prices in such a
situation. The total time of construction is important in these types of contracts as the
contractor pays a fine for an increase in the duration of construction resulting from
his fault; although an increase in duration due to a flood, for example, is not
penaltied. Supervision is necessary to see that the construction is proceeding in
competence with science and art principles.
Lump sum contracts: This type of contract assigns many risks to the
contractor. The design and all other details should be completed before the bidding.
This limits the possibility of changes in the volume of work due to changes in the
project. The changes realized will probably lead to disagreement. The total cost of
construction is determined at the beginning and this gives a great advantage to the
client. The contractor should foresee all the potential risks before the tender and
should add a risk premium to the cost. The contractor tries to complete the
construction as quickly as possible because the increase in duration is a risk for the
contractor. In order to maintain a good quality of construction, continuos supervision
is necessary.
Special contracts: In this type of contract the risk exposure for the contractor
is minimal. As the construction proceed along with the design, it is not necessary to
complete the design beforehand. The client can make changes in the project and these changes do not result in a disagreement. The total cost of construction is not
determined at the beginning and the contractor does not need to show an effort to
decrease the cost. The contractor faces no risks of price increases. An increase in
the duration of construction due to an increase in the volume of work brings no risks
to the contractor. Serious supervision is necessary in order to avoid excess
increases in time and cost.
III.METHODOLOGY
As a demonstration of risk analysis, probability analysis/Monte Carlo
simulation will be used. As mentioned before, among other risk analysis techniques,
sensitivity analysis and probability analysis are more sophisticated.
Both modeling techniques can be regarded as simulations. The simple
distinction between them is that sensitivity analysis does not require a probability
distribution, associated with each risk element. Sensitivity analysis is a deterministic
modeling technique which primarily answers repeated "what if” questions. Probability
analysis, by contrast, treat uncertainty explicitly. All variability factors are modeled as
probability distributions, not as single, known values.
In addition, sensitivity analysis is a univariate approach that identifies the
impact of a change in a single parameter value within a project with a ceteris paribus
assumption holding all other parameters constant. The probabilistic approach,
however, is a multivariate approach in which all factors subject to risk and
uncertainty vary simultaneously.
There are advantages and disadvantages of both techniques. Sensitivity
analysis has the obvious disadvantage of being univariate. It has the advantage of
being simple and easily doable with a standard spreadsheet software on a micro
computer.
Probability analysis has the obvious advantage that it is multivariate, and so
gives an overall assessment of the likely risk exposure of a project. It suffers from
two main disadvantages. First, it is a more complicated technique requiring
sophisticated computer software. Second, it is difficult to disentangle the risk impact
of any one uncertain factor. Let us have a more detailed look at these two methods.
III.1. Sensitivity Analysis
Sensitivity analysis seeks to place a value on the effect of change of a single
variable within a project by analyzing that effect on the project plan. It is a simple
form of risk analysis.
Uncertainty and risk are reflected by defining a likely range of variation for
each component of the original estimate. In practice, such an analysis is only done
for those variables which have a high impact on cost, time, or economic return and
to which the project will be most sensitive.
The effect of the change in each of these variables on the final cost or time
criteria, is then assessed across the assumed ranges. When assessing the
magnitude of variation, it is important to be realistic and to remember natural human
optimism when compiling single figure estimates.
If several variables are changed, a graph of the results is a useful
presentation which quickly indicates the most sensitive or critical variables. This
One weakness of sensitivity analysis, as mentioned before, is that the
variables are treated individually. This leads to severe limitations on the extent to
which combinations of variables can be assessed directly from the data. A further
weakness of such an analysis is that the sensitivity diagram gives no indication of
the anticipated probability of occurrence of any event. This can be partially
overcome by the use of probability contours. However, these contours are subjective
opinions of the estimator of the likelihood of occurrence. They are not
mathematically derived. Criticism of probability contours centers on their inability to
present a probability distribution of predicted outcomes for any risk. It has been
suggested that a normal probability distribution could be applied to each variable to
overcome this deficiency, possibly also providing a means of assessing cumulative
risk of all the variables.
In spite of these weaknesses, there are also benefits of this tool. They
include:
- the pov/erful impact on management of the realization that there is a range of
possible outcomes for a project
- decision making is made more realistic although the information on which decisions
are made becomes more complex
- the robustness of projects to specific uncertainties can be compared
- the relative importance of each variable is immediately apparent, therefore, those
areas which would benefit most from attempts to reduce or control uncertainty, or
need further development work are highlighted.
Probability analysis is a more sophisticated form of risk analysis. It
overcomes the limitations of sensitivity analysis by specifying a probability
distribution for each variable and then considering situations where any or all of
these variables can change their initial values at the same time.
Defining the probability of occurrence of any specific value of a variable may
be a difficult problem. Every project has many unique features and political,
commercial, and fiscal environments change quickly. Nevertheless, it has been
proven to be possible to make tentative estimates of probability distributions and
ranges.
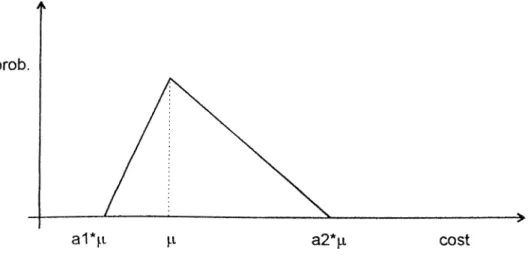
Essentially a distribution profile is allocated to the range which has been
defined for the variable. A number of profiles are possible but simple ones are
advocated in the absence of statistical data. For example, triangular distributions
approximate to a normal distribution. Trapezoidal or rectangular distributions are
useful in representing situations where there is no evidence that one particular value
is any more likely than another within the prescribed range. (Perry and Hayes 1985)
Like sensitivity analysis, the range of variation is a subjective judgment. It is
suggested that ranges for many time and cost elements of a construction estimate
should be skewed with greater probability of over-run. It is usually suggested that the
results, of such analysis are more sensitive to the choice of the range of variation in
a single variable than to the shape of the probability distribution chosen for that
variable (Perry and Hayes 1985).
III.2. P r o b a b ility A n a ly s is
The problem of assessing how risks can occur in combination is usually
overcome by using a sampling approach, running the analysis a number of times
taking random values of each variable. Nguyen and Chowdhury (1985) presented
three approaches: 1) The Monte Carlo simulation technique, 2) Determination of
statistical moments based on a Taylor series approximation, 3) Rosenblueth’s
method of point estimates for statistical moments. Comparisons suggest that less-
time consuming methods can provide sufficiently accurate results for practical
purposes (Nguyen and Chowdhury 1985).
Monte Carlo simulation is perhaps the most widely and easily used form of
probability analysis. It makes the assumption that parameters subject to risk and
uncertainty can be described by probability distributions. The Monte Carlo technique
makes use of these probability distributions to generate a number of simulations of
the desired overall cost estimate (Flanagan, Kendell, Norman, and Robinson 1987).
The outcome of this full analysis is a range over which the final solutions
could lie, and the probability of achieving such solutions is often shown
diagrarnatically. Results given as a statistical probability then allow individuals to
adjust th(?ir own risk response and attitudes towards the individual project.
The analysis can either be (Perry and Hayes 1985);
• time only; allocating ranges of values to the activity durations, so giving the
probabilities of achieving certain completion dates, and the probability of an
activity being critical.
• cost only; allocating ranges of values to the cost for each activity or resource, so
giving the probability of achieving pre-determined financial criteria
• integrated; allocating ranges to time, cost, and even resource usage.
Probability analysis has had some notable successes in terms of its
predictive ability and consequent assistance to managers in decision making.
Nevertheless, it is prudent to regard the present stage of the art as incomplete. For
example, the difficulties of accommodating a correlation between two or more
variables have long been recognized but adequate techniques to manage these
difficulties appear to be lacking. Other important issues include the choice of
distribution, the number of variables, the range of variation, and the number of
iterations for the statistical analysis.
It can be concluded that, probability analysis is a more sophisticated form of
risk analysis than sensitivity analysis. Making use of a computer software overcomes
the major disadvantage of this technique. There are some softwares available, and
they use the Monte Carlo simulation (Willmer 1991).
The Monte Carlo method involves, simulation by means of random number
generation. The method is conceptually straightforward and very powerful. The basic
steps of this method are as follows and illustrated in Figure 2 (Perry and Hayes
1985):
- assess the range for the variables being considered, and determine the probability
distribution most suited to that variable
- select a value for each variable within its specified range; this value should be
randomly chosen and must take account of the probability distribution for the
occurrence of the variable. This is usually achieved by generating the cumulative
frequency curve for the variable and choosing a value from a random number table
- run a deterministic analysis using the combination of values selected for each one
of the variables.
- repeat a number of times to obtain the probability distribution of the result. The
number of iterations required depends on the number of variables and the degree of
confidence required, but typically be between 100 and 1000.
Once the distributions of variables are identified and entered to the computer,
the rest of the steps are performed by the computer and we are not able to follow
these steps. We only see the resulting probability distributions.
-> group n
Figure 2. An illustration of the Monte Carlo method
111.3. Aggregation, Disaggregation
The level of aggregation is the degree of detail which the analysis
encompasses (Pouliquen 1970). For example, in the cost of a road, the cost of land
clearance, earthwork, base, sub-base, and pavement can be distinguished. The cost
of the base can be further subdivided into the costs of extracting stones, crushing
them, transporting them, and laying them, and each of these stages can also be
broken down. Where to stop subdividing in order to make the best risk analysis is
the essence of the aggregation problem.
Lack of disaggregation may result in incomplete or inaccurate judgment. It
would be easier to assign a probability distribution if the project is disaggregated to
details, but that will take too much time and it will be very hard to make
generalizations. Too much disaggregating also causes another problem called
correlation which we will discuss below.
111.4. Correlations
Correlated variables, or variables which are likely to vary together appear in
every project. An experienced professional may feel he is familiar with two separate
variables and knows how their variations are related, without being able to describe
their correlation. Yet, correlation is difficult to detect, and even more difficult to
measure. Most people are not familiar with the concept since it does not have to be
taken into consideration in the single point estimate method. (Pouliquen 1970).
It is easy to understand how correlation works. When independent variables
are aggregated, the effect of variation in one may be offset by variation in another in
the opposite direction. If they are positively correlated, the effect of variation in one
will always be aggravated by variation in the others. Correlations can also be
negative, that is, the variables may systematically offset each other. However, in
construction projects this does not occur so often.
Limiting dissagregation, is solving the problem of correlation by eliminating it.
If we work with the total cost of a road, we do not have to worry about the correlation
between the cost of the base and the cost of the sub-base. The distribution we shall
use for the cost will implicitly include this relationship. However there is a limit to the
level of aggregation. It requires a trade-off between the advantages of clarity of
judgment and of avoiding the hazards of dissagregation. It is a difficult choice and is
often guided by the availability of time.
In the application chapter, Monte Carlo method will be used, by means of
computer software Predict!. The analysis will be cost only.
IV. APPLICATION
İn this chapter, risk analysis will be demonstrated for different scenarios,
using a typical building construction that Yapi Proje Merkezi constructed for Ministry
of Defense. Monte Carlo simulation will be performed by using computer software
Predict to carry out the analysis.
IV.1. About the Contractor firm
Yapi Proje Merkezi Commerce and Industry Co. Inc. is formed by architects
and engineers; its main office is in Mecidiyekoy, Istanbul and it has a branch office in
Çankaya Ankara. For the last twenty five years, this company has given many
technical services in projects and their applications. The company has erected
dwellings, health industry buildings, business offices, administrative buildings,
foundations, substructures and sports and tourism installations. Apart from these
services, the company is also active in mining and tourism areas.
IV.2. Description of the project
The methodology described above is applied to five buildings constructed for
the Turkish Navy, by Yapi Proje Merkezi, each consisting of ten flats. The estimated
cost of construction is 3,890,000,000 TL. (1990 unit prices). The estimate consists of
12 main headings: buildings, buildings transportation, environmental arrangement.
environmental arrangement transportation, sewage, sewage transportation,
underground cable channel, underground cable channel transportation, heating
channel, heating channel transportation, mechanical installations, electrical
installations. The first estimate of each heading is as follows:
buildings... 2,649,279,910 T L
buildings transportation... 281,656,015 T L
environmental arrangement... 182,540,032 T L
environmental arrangement transportation... 62,413,085 T L
sewage... 18,173,607 TL.
sewage transportation... 2,259,874 T L
underground cable channel...2,545,940 T L
underground cable channel transportation... 116,770 TL.
heating channel... 52,068,450 TL.
heating channel transportation... 5,628,216 TL.
mechanical installations... 491,982,040 TL.
electrical installations...114,272,100 TL.
TOTAL... 3,890,000,000 TL.
Due to the reasons stated in chapter 3, we decided to disaggregate the
project to the twelve main headings given in the first estimate.
The problem of correlations in our application is not much as the level of
dissagregation is low. If we dissagregate the project further, then ignoring the
variables which tend to vary together would be inevitable and this would lead to
misleading results. Among our items transportation costs may seem to be highly
correlated. However, this is completely wrong. The only common point these items
share is the use of trucks. In fact the transportation items are closely related not with
one another, but with the items just above each. For example, buildings and
buildings transportation should be highly correlated; as the volume of materials in
buildings increases, the volume to be transported increases, so the cost of
transportation increases as well. At this point, we face a major shortcoming of our
computer program. One may define correlations in three ways only: 1) The items are
positively correlated in full, i.e., the correlation coefficient is +1, 2) The items are
negatively correlated in full, i.e., the correlation coefficient is -1, 3) There is
correlation between the items.
no
Even if we are sure that there is a correlation between buildings and
buildings transportation, it is not +1, because a 10% increase in the buildings cost
may not lead to a 10% increase in the transportation cost. It might be possible to
observe that, although an increase in the item "buildings” occurs, its transportation
cost may decrease. One possible reason for this is that the supplier address may
change and hence the route may get shorter and this may decrease the
IV.3. A Specific Look at the Risk Categories
It should be kept in mind that, the contract type of this project is unit price.
So, risks of design classification become very important, because this type of
contract provides flexibility in the volume of work to be done. Some financial risks
due to the increase in prices of certain materials also exist. Although it seems of
minor importance, the increase in the duration of construction, not due to the fault of
the contractor, brings extra cost to the client; therefore "Acts of God" is another
important risk classification category for this type of contract.
The contract of our application is a unit price contract, and the data we have
is the estimates of the quantities. We do not know what profit does the contractor
aimed at and what profit he realized. So it would not be appropriate to carry out this
analysis from the contractor’s point of view. We should remember that contracts and
therefore the risks involved are two sided. The client suffers from them as well as the
contractor.
Let us examine the situation according to different risk groups concentrating
on the client and considering that our contract is a unit price contract and the client is
Ministry of Defense and is binded by Ministry of Public Works 2886 which permits an
increase of 30% in the first estimate. Refer to Table 1 on page 11, about the
following risk categories.
Acts of God: This risk category is not a threat for the contractor, because the
contractor is insured for these events and this insurance is an obligation. So all
financial losses due to acts of God will be covered by the insurance company. This
makes us think that there is also no risk for the client; but it is not true. This kind of
event will probably result in a loss of time as well as a loss of money. The loss of
time can not be compensated in terms of money but if the client is expecting some
future gains at the end of the construction, these gains will be delayed; in other
words, they will be lost for some time. For our project this might be the case: the
buildings will provide accommodation for officers. If accommodation can not be
provided, than the client is supposed to offer some extra funds to these officers. This
means extra cost and the client is expecting to get rid of this cost at the end of
construction, but as the duration increases the client will continue to experience that
cost. Also, the client can not penalize the contractor in case of the acts of God.
Physical: This risk category does not present a threat to the client in our case,
because the client pays for the realized outcome at the end of the construction. In
other words, the client does not care if the building collapses during construction or
the excavator is damaged, he only cares about the outcome. However, this risk
category is very important to the contractor, as he will have to compensate any
losses incurred due to these reasons.
Construction related: This risk category again poses a threat to the contractor, since
the client does not care if the work has stopped due to weather conditions, theft, or
labor strikes. Therefore, the contractor should take these risks into consideration. He
should be able to pay the penalty for being late, should be able to buy new materials
and should be able to find new workers or negotiate with the existing ones.
However, if the situation is extraordinary, the client may agree to increase the time
allowance so the late penalty might not be applied.
Design: This risk category is a serious threat for the client and will be discussed in
design resulting in an increase in the volume of work, will bring extra cost to the
client. Unfortunately, as the state in Turkey is very generous in terms of spending
money, risks resulting from design are usually realized.
Financial and economic: This risk category is a threat for both the client and the
contractor. As Turkey is a land of inflation, price increases are unavoidable. Some of
these increases are paid to the contractor by the client. In this case the client
experiences the risk and faces the additional cost. These are increases in prices of
commodities such as cement, gasoline, lumber, aluminum, glass, copper etc. Yet
some price increases are not paid to the contractor. Then the contractor experiences
the risk and faces additional cost. Examples of these include increases in labor
costs, equipment rents, costs of electrical equipments, generators, radiators etc. The
contractor is protected against these price increases with the escalation procedure
which is the updating of unit prices, but escalation is applied from year to year,
although inflation is continuos. The general tendency is to decide on the escalation
rate so that for the first six months of the year it is above the inflation rate, for the
second six months below the inflation rate.
IV.4. The reasons of the changes in the first estimate
Why do changes occur in the first estimate? This question brings us back to
the “Design” risk category. Let us have a look at each cost item and roughly try to
find possible reasons for the changes.
Buildings:
The main reason for changes were details, such as the choice of materials. In
were going to move there; the floor tiles is changed to parquet, the kitchen
cupboards were changed to wood, the materials in the bathrooms were changed etc.
Yet, even a bigger change in design was experienced in this project. The first
plan was to construct 5 blocks of 10 flats each, but then it was changed to 6 blocks
of 8 flats each. Although the number of flats decreased from 50 to 48, the cost
increased considerably because it is very costly to increase the number of blocks.
This dramatic change was due to the fact that, the estimates were prepared before
the completion of the project.
Environmental arrangement:
In fact, nothing about the environmental arrangement was known
beforehand, the grass area, trees, route of the roads were all changed. Again some
material changes occurred; the road material was changed from concrete to stone.
Sewage:
The height of the basement was known, say -2m, but the earth was not
suitable there and it became necessary to go deeper. This resulted in further
excavation and hence further cost, also a need for a pump arose which added to the
cost. In addition to these, the length of the pipe used was increased due to the
above reason, which again meant more money.
Underground cable channelj.
The electric supply planned to be used previously was changed due to
technical reasons. The length of the channel was increased, increasing the cost.
Mechanical installations:
Changes in the use of materials increased these costs. Some decrease in
costs was experienced due to the decrease in the number of flats and hence a
decrease in the number of radiators etc.
Electrical installations:
The electrical devices predicted to be used was reconsidered. For example,
the use of microwave ovens and drying machines were not considered before; this
resulted in higher electrical power requirements which necessitated the use of a
higher cross-section cables. Also, the gallery lighting was added later on.
Transportation:
These cost items are not stated one by one because the change in these
items were due to two main common reasons; First, as the amount of materials
changed, the cost of transportation changed. Second, as the place the materials
were to be taken changed, the cost of transportation changed.
IV.5. Analysis
The risks associated with these cost elements are not determined with great
effort, since to get precise results out of this application is not the thesis objective.
The reason for performing such an analysis is to demonstrate the concept of risk
analysis. The probability distributions of these risk elements are found simply by
asking an engineer from a contractor firm his subjective views about this matter. It
would definitely yield better results if some kind of a survey were carried out among
contractor firms doing similar jobs and the results of this survey were interpreted by