Low Carbon
DeveLopment
pathways anD
WWF-TURKEY
WWF-Turkey is the national office of the World Wide Fund for Nature (WWF); one of the world’s oldest and foremost independent nature conservation organizations. WWF-Turkey’s history goes as far back as 1975, when its parent organization, Doğal Hayatı Koruma Derneği (DHKD) was founded. With over fi ve million supporters worldwide and an active presence in more than 100 countries, the mission of WWF is “to stop the degradation of the planet’s natural environment and to build a future in which humans live in harmony with nature. WWF-Turkey focuses its work on two main areas, nature conservation and the reduction of ecological footprint. For more information, please visit www.wwf.org.tr.
ISTANBUL POLICY CENTER
Istanbul Policy Center is an independent policy research center with a global outreach. Its mission is to foster academic research in social sciences and its application to policy making. IPC aims to provide decision makers, opinion leaders, academics, and the general public with innovative and objective analyses on domestic and foreign policy issues. IPC has expertise in a wide range of areas, including –but not limited to- Turkey-EU-U.S. relations, education, climate change, political and social trends in Turkey and their impact on civil society and local governance.
For more information, please visit ipc.sabanciuniv.edu.
Authors Analysis
Prof. Dr. Erinç Yeldan (Bilkent University)
Assoc. Prof. Dr. Ebru Voyvoda (Middle East Technical University)
Report
Mustafa Özgür Berke (WWF-Turkey)
Dr. Ümit Şahin (Istanbul Policy Center-Sabancı University) Funda Gacal (WWF-Turkey)
Project Advisor
Dr. Felix Christian Matthes (Öko-Institut)
Contributors
Assoc. Prof. Dr. Semra Cerit Mazlum (Marmara University) Dr. Ethemcan Turhan (Sabancı University Istanbul Policy Center)
Design Application
Modern Times Production
Editor
Özgür Gürbüz (WWF-Turkey)
Printing
Bion Matbaa
No part of this publication may be reproduced or reprinted without the permission of WWF-Turkey. © Text and graphics: WWF-Turkey and Istanbul Policy Center, 2015
WWF-Turkey
Büyük Postane Cad. No:19 Kat:5 Bahçekapı 34420- Istanbul
Sabancı University Istanbul Policy Center
Bankalar Cad. No:2, Minerva Han Karaköy 34420- Istanbul
Cover Photo: © Getty Images Turkey ISBN: 978-605-9903-05-9
DeveLopment
pathways anD
priorities for turkey
Climate-Friendly Development in Turkey:
A Macro Level Evaluation
Contents
foreworD
CLimate ChanGe anD turkey
Climate Change
Impacts of Climate Change
How Is Turkey Impacted by Climate Change?
2°C Target/Remaining in the Safe Zone
Global Efforts for Mitigating Climate Change
Turkey and International Climate Policies
Low Carbon DeveLopment pathways for turkey
Methodology
Carbon Budget For the 2°C Target: What Could Turkey’s Emission Reduction Target Be?
Instruments for Climate Policy and Their Macroeconomic Implications
2°C Pathway for Turkey
Timing of Climate Policy: The Early Bird Gets the Worm
reCommenDations for turkey aheaD of Cop21
appenDiX: methoDoLoGy
Computable General Equilibrium Model for the Turkish Economy
Analytical Structure of the Model
Data Set
Reference Scenarios
5
11
13
14
15
16
17
20
23
27
29
35
43
47
51
58
59
60
65
69
TURKEY ACCOUNTS
FOR 0.94% OF
GLOBAL EMISSIONS.
SINCE 1990, IT HAS
INCREASED ITS
GHG EMISSIONS BY
110.4%.
The average global temperature rose by 0.85°C from 1880 to 2012. Climate scientists indicate that this increase has been caused by human activities. Should greenhouse gas emissions continue to increase at its current rate, the temperature rise may reach 4°C in 2060, and 6°C in 2100. Parties to the United Nations Framework Convention on Climate Change (UNFCCC), including Turkey, officially acknowledged this scientific fact and set the limit for the temperature increase at 2°C in an effort to constrain the effects of the temperature rise on natural and human systems.
Scientists and decision makers agree that climate change is one of the most serious problems facing humankind.
195 contracting states to the UNFCCC will meet in Paris in December 2015 to find a solution to this problem and to negotiate the new climate agreement that is intended to replace the Kyoto Protocol after 2020.
Prior to the Climate Summit to be held in Paris at the end of this year, each country was invited to determine, in accordance with its historical responsibility in the GHG emissions growth and with its current capacity, its national contributions to meet the 2°C target and to safeguard ecosystems and communities from the devastating impacts of climate change. Turkey’s GHG emissions amount to 4‰ of the cumulative historical global emissions and to 0.94% of the global emissions in 2013. Turkey is not among the biggest polluters. However, it has increased its emissions by 110.4% since 1990. As it attempts to determine its national contribution to climate change mitigation, Turkey faces three critical questions:
1. What responsibility lies with Turkey within the scope of the 2°C target, and what could its emission reduction target be?
2. What policies could be pursued in order to achieve the required emission reduction? 3. What kind of an impact could these policies have on macroeconomic indicators? What are the costs of implementing and not implementing these policies?
This study, prepared with the collaboration of Istanbul Policy Center and the precious contributions of Prof. Dr. Erinç Yeldan and Assoc. Prof. Dr. Ebru Voyvoda, seeks answers to the above-mentioned questions. The results of this analysis suggest that Turkey can keep its GHG emissions in check and better manage risks including those pertaining to energy security and import dependence in energy by initiating a transformation in its emission intensive industries with a focus on renewable energy sources and energy savings. In this regards, timing is of key importance. The sooner the transformation is initiated, the more positive impacts it will have on the economy.
The success of climate change mitigation efforts will depend not only on actors such as the U.S. and China, but also on developing countries like Turkey, whose emissions are rapidly increasing. We hope that this study will light the way for the parties and decision makers that have a say in climate change policies.
Uğur Bayar
Chairman of the Board of Directors WWF-Turkey
6
THE INTERNATIONAL
ENERGY AGENCY
WARNS THAT TWO
THIRDS OF FOSSIL
FUEL RESERVES
SHOULD REMAIN
UNDERGROUND
IN ORDER TO
LIMIT THE GLOBAL
TEMPERATURE RISE
TO 2°C.
7
FOREWORD
In addition to being the most important ecological problem threatening our planet and the future of humanity, climate change deeply impacts the global economy. According to the International Energy Agency (IEA), the fact that 80% of global energy supply is provided by fossil fuels and the growing energy demand lead to a continued rise in GHG emissions. The IEA warns that two thirds of the world’s fossil fuel reserves should remain underground and a structural transformation towards low carbon technologies should be initiated in order to limit the temperature rise to 2°C.
Undoubtedly, climate change is one of the most serious problems of the globalizing world. Then, how are we going to mitigate climate change? What can we do? For the success of mitigation efforts, we need to halt, at the global level, the tendency of economic growth and social development to follow the same trajectory as the GHG emissions growth. In other words, we need to decarbonise the economy. To that end, we should enhance energy efficiency, eliminate fossil fuel subsidies and increase the share of renewables including wind and solar energy in the power production mix.
Turkey’s historical responsibility in climate change inducing GHG emissions is low, but it is a country with rapidly increasing emissions. Due to the accelerating increase in developing country emissions in recent years, emission reductions merely in industrialized Western countries are no longer sufficient for climate change mitigation. For this reason, Turkey should constrain, alongside other developing countries with rapidly growing economies including China and India, its fossil fuel use and GHG emissions, and contribute to international climate policies.
Even though Turkey has, to date, made significant preparations towards climate change mitigation, it has neither been able to keep the growing GHG emissions in check, nor has it played an active role in international climate policies. However, as also stated by President Erdoğan in his speech at the United Nations Climate Change Leaders’ Summit in New York in 2014, Turkey has been preparing to take part in and make its national contribution to the new climate regime to be agreed on at the Conference of the Parties, which will be held in Paris at the end of this year.
It is of utmost importance that countries base their emission reduction targets for climate change mitigation on scientific research and measure the economic implications of the necessary policy instruments. In these efforts, it is also vital that contributions from all relevant parties, including state institutions and organizations, academics, specialists, business circles and civil society, be ensured. Innovative, realistic, viable and effective policies can be designed only through filtering the required results from a wide range of analyses with diverse methods.
This report, prepared with the collaboration of Istanbul Policy Center-Sabancı University Stiftung Mercator Initiative and WWF-Turkey, sets off to realize this goal. The findings of the long researches and analyses carried out by two valuable researchers, Prof. Dr. Erinç Yeldan and Assoc. Prof. Dr. Ebru Voyvoda, show us that Turkey’s fulfilment of its responsibility to contribute to climate change mitigation is feasible also from an economic point of view, and that a climate-friendly and decarbonising economy may pave the way for green growth in Turkey as well.
I hope this stimulating and useful report prepared with academic rigour will encourage a collective, scientific and solution-oriented debate on the issue of climate change. Fuat Keyman
EXECUTIVE SUMMARY
Scientists and decision makers agree that climate change is the biggest problem ever faced by humankind. Parties to the United Nations Framework Convention on Climate Change (UNFCCC), including 195 contracting states and the European Union, will meet in Paris in December 2015 and negotiate the new climate agreement that is expected to replace the Kyoto Protocol after 2020. Prior to the 21st Conference of the Parties to the UNFCCC (COP21) in Paris, the United Nations called on each state to specify its future contributions to the efforts to keep the global average temperature rise below 2°C and to safeguard ecosystems and communities from the devastating impacts of climate change. Countries are expected to determine their contributions on the basis of their historical responsibilities in the GHG emissions growth and their current capacities.
This analysis brings up three critical questions that Turkey should seek answers to, as it attempts to determine its national contribution to climate change mitigation:
-What could Turkey’s responsibility and its emission reduction target be within the scope of the 2°C target?
-What kind of a policy package could be implemented in order to achieve the required emission reduction?
- What could be the impact of these policies on macroeconomic indicators? What are the costs of implementing and not implementing these policies?
In order to avoid the devastating impacts of climate change, global carbon emissions should not exceed 2,900 GtCO2. This is referred to as the carbon budget. 65% of this budget (that is, 1,900 GtCO2) had been used up as of 2011. Should the current upward trend in emissions continue, the remaining 1,000 GtCO2 will have been emitted before 2050. To stay within the 2°C target, global carbon neutrality will need to be achieved sometime between 2055 and 2070, and total global greenhouse gas emissions need to shrink to net zero some time between 2080 and 2100.
This study identified Turkey’s share in the remaining carbon budget based on “minimum historical
responsibility” and “maximum development needs”. In this respect, in order to fulfil its responsibility within the scope of the 2°C target, Turkey should reduce its cumulative carbon emissions by 2,980 MtCO2 until 2030 relative to the reference scenario.
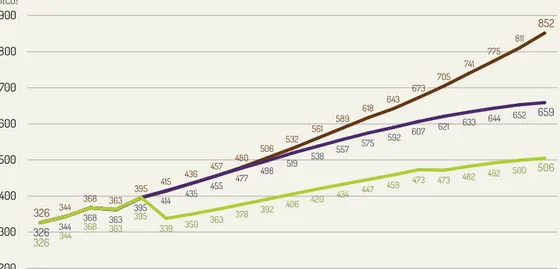
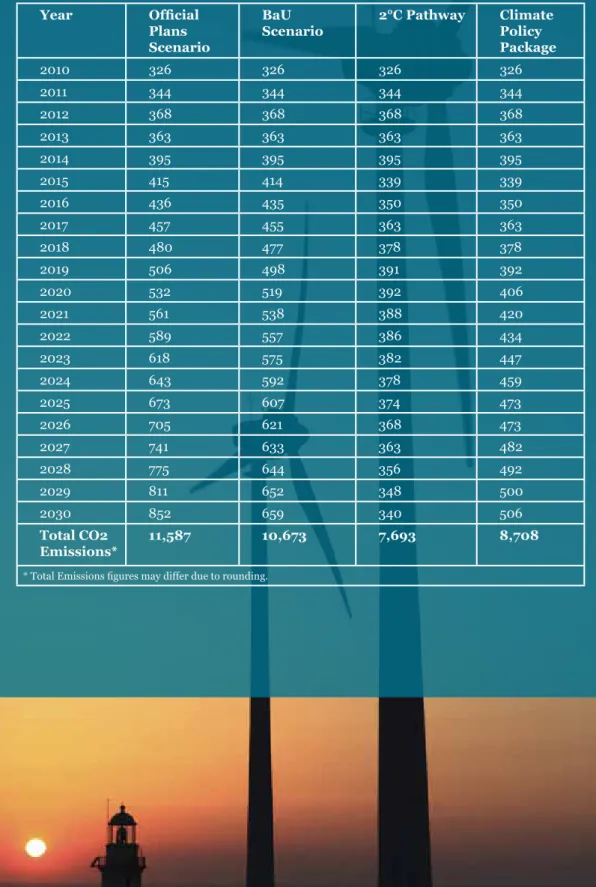
Projections suggest that Turkey’s CO2 emissions, which amounted to 363 MtCO2 in 2013, will reach 851 MtCO2 by 2030 under high growth scenarios, and 659 MtCO2 by the same year under realistic growth scenarios. In this study, high growth scenarios will be assessed under the Official Plans Scenario, and more realistic growth scenarios under the Business-as-Usual (BaU) Scenario.
In order for Turkey to fulfil its responsibility regarding the 2°C target, its annual CO2 emissions should reach a peak level of 390 MtCO2 by 2020, and gradually decrease thereafter down to 340 MtCO2 (the 2010 level) by 2030.
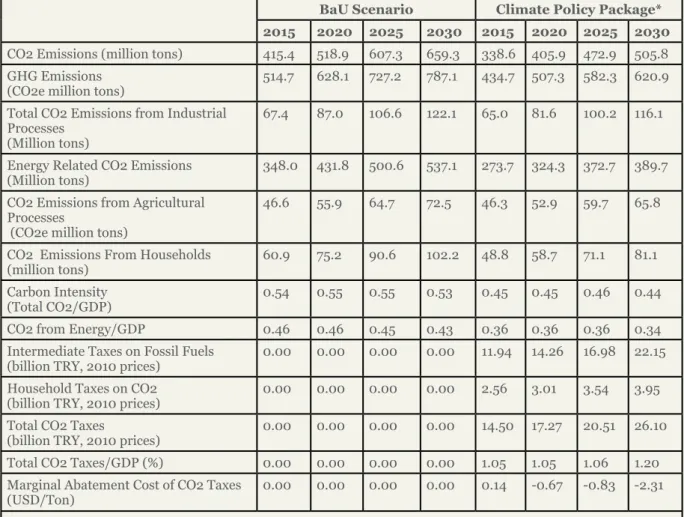
What policy instruments Turkey will employ to meet the 2°C target and what kind of macroeconomic implications these policy instruments will have are the key questions that call for answers with respect to the formulation of climate policies. Under a scenario called the “Climate Policy Package”, this analysis identified three main policy instruments :
-Carbon tax.
-Use of carbon tax revenues for electricity generation from renewables by means of a renewable energy investment fund.
-Autonomous efficiency gains (i.e., depending on technological advances and market conditions, and not on any deliberate energy efficiency policies).
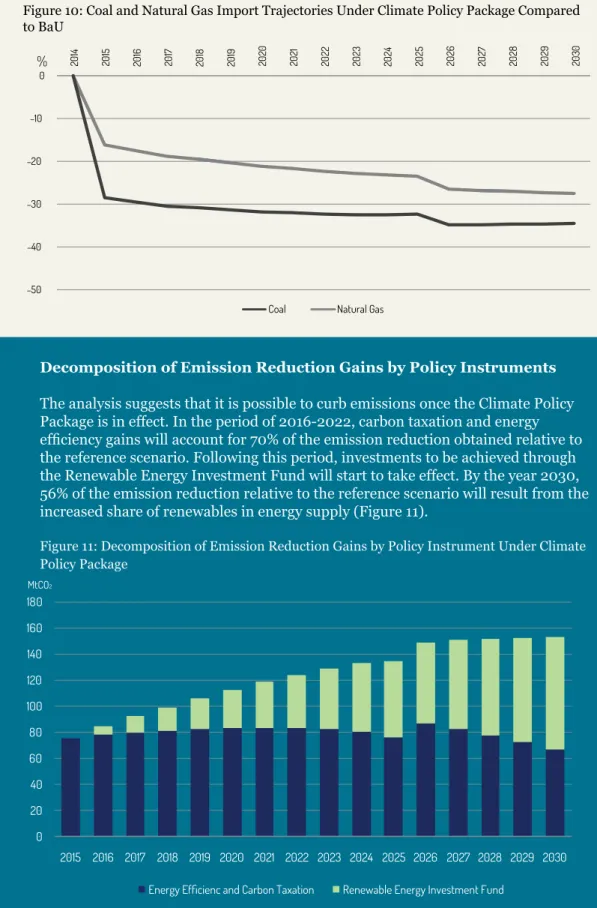
If these policy tools are put into practice, the annual CO2 emissions might be 506 MtCO2 in 2030. This is 23% less than the level projected regarding the Business-as-Usual Scenario. This means that it is possible to ensure a 20% decrease in the carbon emission intensity (annual CO2 emissions/GDP) of the economy.
Under the Climate Policy Package, the level of CO2 emissions in 2030 is estimated to be 40% lower than the projections regarding the Official Plans Scenario. This proves the critical importance of the assumptions made when identifying a reference emission growth pathway. When assessing the contributions of countries that adopt a baseline scenario target, one should consider how realistic and sound the emission values projected in the reference scenario are.
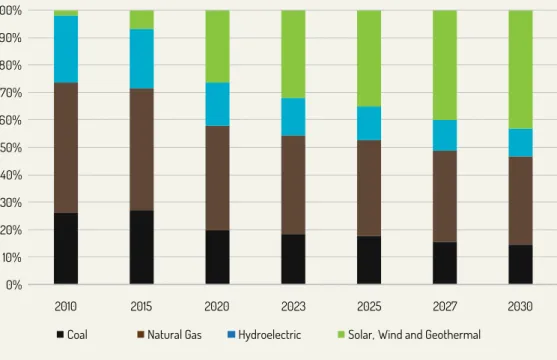
The Climate Policy Package entails a notable transition from natural gas and coal to solar and wind energy in the energy mix. It foresees that this transition will lead to a 25% decline in coal imports and a 35% decline in natural gas imports, relative to the reference scenario.
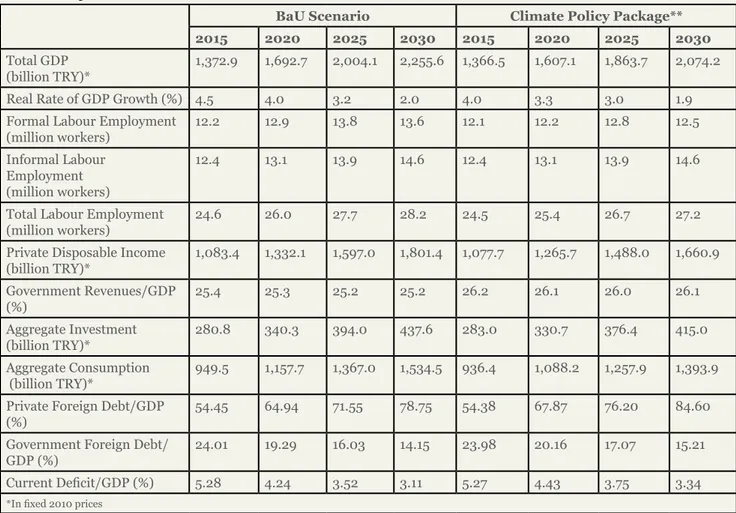
The gains cited above come with a cost. According to the results of the model, the GDP growth in the period leading up to 2020 will be 3.3%, instead of 4%, as a consequence of the policy package. It is estimated that the gap between the projected growth rates regarding the Climate Policy Package and those regarding the reference scenario will narrow after the year 2025, eventually disappearing in 2030.
The model results point to a decline in employment rates parallel with the decline in the GDP growth rates. It may be possible to regulate the distribution of national income through social policy packages and to mitigate the negative impacts by managing the fluctuations in employment.
The analysis indicates that the marginal cost of abating 1 kg CO2 hovers around 7 and 23 US$ cents. This is rather a marginal cost considering that an emission reduction of up to 25% relative to the reference scenario can be achieved at the cost of a tax burden corresponding to 1.2% of the total GDP. Given the benefits of such a structural transformation that will reduce dependence on imported coal and gas in the energy mix and expedite the transition from fossil fuels to domestic renewable sources, this cost may be regarded as fairly reasonable. Under the “Climate Policy Package”, it will be possible to reduce carbon emissions by a total of 1,965 MTCO2 in comparison to the reference scenario. In other words, the policy measures included in this package will enable Turkey to realize, by 2030, two thirds of its fair share of emission reductions regarding the 2°C target.
The policy tools included in the “Climate Policy Package” are adequate for keeping the emissions level in line with the 2°C target through to the year 2020. In order to meet the 2°C target, emissions should reach a “peak point” around 2020, and start to decline thereafter. To fully achieve this goal, it is necessary to adopt additional policy measures and practices. Towards this end, sector-based analyses and studies should be conducted in such areas as industry, transport, waste management, and energy efficiency.
Turkey’s role in and sway on the new climate regime will be defined by the adaptation and mitigation policies it will implement at the national and local levels, as well as by the emission reduction target it will declare. In this context, a holistic approach to mitigation and adaptation policies is called for. Tools such as earmarking a portion of the prospective carbon tax revenues for reducing vulnerability towards climate change at the local level may contribute to achieving such coherence.
Climate finance is not among the policy tools included in the “Climate Policy Package”. If, in the new international climate regime, Turkey benefits from international climate finance for meeting its emission reduction targets, the adverse economic consequences of emission reduction may be mitigated.
Scientists claim that taking swift measures to reduce GHG emissions is vital for avoiding both the devastating impacts and the economic losses to be caused by climate change. The results of the analysis show that early action is of critical importance for Turkey , as well. If Turkey defers the implementation of emission reduction measures of the “Climate Policy Package” up until 2020, it may face “negative” growth rates after the year 2024, in order to be able to fulfil its responsibility regarding the 2°C target. By immediately putting into
practice the emission reduction policies, on the other hand, it will be possible to maintain the economic growth, though with some degree of decline in the GDP growth rate. This may be interpreted as suggesting that the “green growth” approach is adequate and feasible for Turkey as well.
PART 1:
CLIMATE CHANGE
AND TURKEY
CLIMATE CHANGE AND
TURKEY
0.85°C
AVERAGE GLOBAL
TEMPERATURE RISE
SINCE 1880
Climate Change
It is indisputable that global temperatures are on the rise due to human activities. From 1880 to 2012, the average global temperature rose by 0.85°C.1 In this period almost all the ocean and land areas warmed up. 2014 was the warmest year since instrumental temperature measurement was first introduced in 18802, and 14 of the 15 warmest years on record have occurred in the 21st century.3
Consistent changes are taking place in the climate system as a whole due to global warming; snow mantle and glaciers are shrinking, sea levels are rising and precipitation regimes are changing as land and sea temperatures are increasing.4 “Human-induced (anthropogenic) climate change”, which emerged in the wake of the industrial revolution and has gradually accelerated in the last 40 years, is caused by growing greenhouse gas concentrations in the atmosphere. Atmospheric concentrations of carbon dioxide, methane and nitrous oxide, which are the main greenhouse gases, have reached a level that is unprecedented 800 thousand years. Carbon dioxide concentrations have increased by more than 40% compared to pre-industrial levels (approximately 280 ppm [ppm: parts-per-million]) exceeding 400 ppm in 2014. The primary reason for this is the burning of fossil fuels (coal, oil, natural gas), while the second reason is the emissions generated by land use change (deforestation, agriculture, etc.).
Emissions Trends
According to the Fifth Assessment Report of the Intergovernmental Panel on Climate Change (IPCC), 40% of the total human-induced GHG emissions released to the atmosphere since the industrial revolution have occurred in the last 40 years. Despite the need to reduce and eventually eliminate emissions so as to mitigate climate change, a drastic increase is observed in annual global emissions. Global emissions, which displayed an average annual increase of 1.3% between 1970 and 2000, rose by 2.2% between 2000 and 2010.
The main driving force behind this increase is the fossil fuel use and industrial processes. While 65% of the total emissions in 2010 were generated by the fossil fuel use and industrial processes, the IPCC revealed that these two factors were responsible for 78% of the emissions growth between 1970 and 2010.
Source: IPCC, 2014. Fifth Assessment Report, Working Group III Contribution: Mitigation of Climate Change. http://mitigation2014.org/ report/summary-for-policy-makers
1 Intergovernmental Panel on Climate Change. CLIMATE CHANGE 2013: The Physical Science Basis Summary for Policymakers. https://www. ipcc.ch/pdf/assessment-report/ar5/wg1/WGIAR5_SPM_brochure_en.pdf
2 http://www.ncdc.noaa.gov/sotc/summary-info/global/201412 3 https://www.wmo.int/media/?q=content/warming-trend-continues-2014
4 Intergovernmental Panel on Climate Change (IPCC) Fifth Assessment Report Working Group I. “Climate Change 2013: The Physical Science Basis” https://www.ipcc.ch/pdf/assessment-report/ar5/wg1/WGIAR5_SPM_brochure_en.pdf
THE NUMBER OF
METEOROLOGICAL,
HYDROLOGICAL AND
CLIMATIC DISASTERS
ALMOST TRIPLED
ALL AROUND THE
WORLD BETWEEN
1980 AND 2014
X
3
impacts of Climate Change
Among the major observed impacts of climate change are extreme weather and climate events, rising of sea levels, considerable shrinking of glaciers in the North
Pole, Greenland and Antarctica, and rising temperatures and acidification in oceans.5
According to the IPCC’s Fifth Assessment Report, climate change has affected in an irreversible way the habitats of many land, sea and freshwater dwelling species. Due to changes in precipitation regimes and melting of snow/ice mantles in many regions of the world, hydrological systems have also changed, and water resources have deteriorated both in quantity and quality. Adverse effects of climate change on agricultural products will be much greater and more pervasive than its positive effects.6 As a matter of fact, the number of meteorological, hydrological and climatic
disasters (sudden precipitations, floods, strong hurricanes, dry spells, heat waves, etc.) tripled between 1980 and 2014.7
If no measure is taken and the current trends in emissions levels persist, the
temperature rise is likely to exceed the 2°C danger threshold in the coming years. The temperature rise may reach 4.8°C by the end of the 21st century.8 Scientists suggest
that even if the anthropogenic GHG emissions were reduced to zero today, changes in the climate system and their potential impacts would prevail. Nevertheless, a rapid and immediate reduction in global emissions may keep the temperature rise below 2°C. Continuing rise in emissions and temperatures, on the other hand, will increase the risk of occurrence of abrupt and irremediable climate events.
Anticipated Impacts of Climate Change according to the IPCC’s Fifth
Assessment Report9
• Deaths and injuries in small island states, on other small islands and in coastal areas due to hurricanes, floods and sea level rise; damages to settlements.
• Damages to settlements and serious illness threats to city-dwelling populations due to sudden flooding.
• Systemic risks due to extreme weather events leading to serious damages to and/or total destruction of infrastructure systems and the consequent disruption of services such as electricity, water supply, and health and emergency services.
• Increased mortality and morbidity rates during periods of extreme heat among vulnerable sections of urban populations (elderly population, those with respiratory problems, etc.) and those working outdoors in urban and rural areas.
• Breakdown of food supply systems and increased risk of food insecurity particularly among poorer populations due to warming, droughts, floods, and precipitation variability and extremes.
• Loss of livelihoods particularly among subsistence farmers and peasants in semi-arid regions due to insufficient access to drinking and irrigation water and reduced agricultural production.
• Degradation of land and freshwater ecosystems and of biodiversity and ecosystem services they provide for populations living in these areas.
5 Intergovernmental Panel on Climate Change (IPCC) Fifth Assessment Report Working Group I. “Climate Change 2013: The Physical Science Basis” https://www.ipcc.ch/pdf/assessment-report/ar5/wg1/WGIAR5_SPM_brochure_en.pdf
6 Intergovernmental Panel on Climate Change (IPCC) Fifth Assessment Report Working Group II. “Climate Change 2014: Impacts, Adaptation, and Vulnerability” http://ipcc-wg2.gov/AR5/images/uploads/IPCC_WG2AR5_SPM_Approved.pdf
7 Munich RE, Geo Risks Research, NatCatSERVICE - As at January 2015
8 Intergovernmental Panel on Climate Change (IPCC) Fifth Assessment Report Working Group I. “Climate Change 2013: The Physical Science Basis” https://www.ipcc.ch/pdf/assessment-report/ar5/wg1/WGIAR5_SPM_brochure_en.pdf
9 Intergovernmental Panel on Climate Change (IPCC) Fifth Assessment Report Working Group II. “Climate Change 2014: Impacts, Adaptation, and Vulnerability” http://ipcc-wg2.gov/AR5/images/uploads/IPCC_WG2AR5_SPM_Approved.pdf
45 %
OF THE
POPULATION IN
TURKEY MAY
CONFRONT WATER
SCARCITY BY
THE END OF THE
CENTURY DUE TO
CLIMATE CHANGE
how is turkey impacted by Climate Change?
The Mediterranean Basin, including Turkey, is one of the regions most vulnerable to climate change. Major impacts of climate change that have been observed in Turkey up until today are as follows:
• Temperatures have risen all over Turkey in the last 42 years. Higher rates of increase have been observed in summer temperatures compared to other
seasons. Warm periods have expanded also in temporal terms.10
• An approximately ten-meter annual retreat of mountain glaciers has been observed in the last 50-60 years.11
• Peak run-off of snow-fed rivers has shifted to a week earlier than its regular time in the last 40 years.12
• The sea levels have risen.13
Temperatures are expected to rise in all parts of the country and in all seasons, and the rates of increase in summer temperatures are expected to be higher than in winter temperatures. In addition, it is predicted that Turkey’s already limited water resources will be under further stress. Other possible impacts of climate change on Turkey are as follows:
• Lower precipitation rates are expected in the southern regions of Turkey. A slight increase may be observed in its northern and particularly north-eastern regions.
• Rising sea levels may lead to the submergence of river deltas (such as Çarşamba, Bafra, and Çukurova) and of low-lying areas of coastal cities; one-meter rise in global sea levels may affect 3 million individuals in Turkey.14
• Regions suffering from water stress may expand in Turkey; 45% of the population may confront water scarcity by the end of the century.15
• Higher precipitation rates in the Eastern Black Sea region may increase the risk of landslides.
• Anticipated shrinking of the snow mantle may decrease the risk of avalanches.
• Periods of drought and heat wave may increase in duration and intensity due to rising temperatures and falling precipitation rates.16
10 Şen, Ömür Lütfi., Bozkurt, Deniz., Göktürk, Ozan Mert., Dündar, Berna. and Altürk, Bahadır. 2012. “Türkiye’de İklim Değişikliği ve Olası Etkileri” http://ipc.sabanciuniv.edu/en/wp-content/uploads/2012/10/Bildiri_Omer_L_Sen_vd_2013.pdf
11 Sarıkaya, Mehmet Akif. 2011. “Türkiye’nin güncel buzulları.” in Fiziki Coğrafya Araştırmaları: Sistematik ve Bölgesel, Istanbul: Turkish Geographical Society Publications, 6: 527-544.
12 İsmail, Yücel., Güventürk, Abdülkadir., and Şen, Ömer Lütfi. 2013. “Climate change impacts on snowmelt runoff for mountainous regions of eastern Turkey”, Journal of Hydrology, in review
13 Demir, Coşkun., Yıldız, Hasan., Cingöz, Ayhan., and Simav, Mehmet. 2005. Türkiye Kıyılarında Uzun Dönemli Deniz Seviyesi Değişimleri, p.13, Fifth National Coastal Engineering Symposium, 5-7 May, Bodrum.
14 Leo Meyer, IPCC Fifth Assessment Report Synthesis Report, Bogazici University, 10 September 2015, IPCC Outreach Event Istanbul, Turkey http://ipcc.ch/apps/outreach/documents/301/1441858899.pdf
15 Met Office, Climate observations, projections and impacts: Turkey, Devon, 2011
2°C
THE AVERAGE
TEMPERATURE
RISE SHOULD BE
KEPT BELOW THIS
THRESHOLD SO AS TO
AVOID DEVASTATING
EFFECTS OF CLIMATE
CHANGE
2°C target/remaining in the safe Zone
Impacts of climate change such as rising sea levels, ocean acidification, melting of glaciers, and increased frequency and intensity of extreme weather and climate events such as droughts, floods, and strong hurricanes, pose serious risks to human communities as well as to plants, animals and ecosystems.
Scientists assert that the average temperature rise should be limited to 2°C in order to avoid the devastating impacts of climate change. Failing to stay within this limit is expected to cause pervasive and irremediable impacts on all ecosystems and human communities. The 2°C target was accepted by all countries under the 2010 Cancun Agreements, and subsequently all emission reduction negotiations are conducted in line with this target. To meet this target, atmospheric CO2 levels, which have risen by 40% (from 280 ppm to 400 ppm [ppm: parts-per-million]) in the last 250 years, should remain below 450 ppm.
Average global temperatures have, to date, risen by 0.85°C. If the current rate of
increase in GHG emissions persists, the temperature rise may reach 4°C in 206017,
and 6°C in 210018. IPCC states that in order to keep global warming below the 2°C
threshold, structural changes should be made in the global energy system, thereby ensuring considerable GHG emission reductions within the shortest time possible. It is underlined that to stay within the 2°C target, global carbon neutrality will need to be achieved sometime between 2055 and 2070, and total global greenhouse
gas emissions need to shrink to net zero some time between 2080 and 2100**.19
Accordingly, the share of low carbon energy sources in electricity generation should exceed 90% by 2050.
The International Energy Agency (IEA) also emphasizes that in order to stay within the to 2°C target, two thirds of the world’s fossil fuel reserves should remain underground.20 The IEA warns that our dependence on fossil fuel infrastructure will
render energy security and climate targets harder and more costly to achieve unless a structural transformation towards clean energy and low carbon technologies is initiated by 2017.21
*Net Carbon Emission= Amount of carbon released to the atmosphere – Amount of carbon absorbed by carbon sinks **Net GHG Emission= Total amount of GHG released to the atmosphere – Total amount of GHG absorbed by carbon sinks 17 “Turn Down The Heat: Why a 4°C World Must be Avoided”, World Bank, 2012. http://documents.worldbank.org/curated/ en/2012/11/17097815/turn-down-heat-4%C2%B0c-warmer-world-must-avoided
18 “Turn Down The Heat: Why a 4°C World Must be Avoided”, World Bank, 2012. http://documents.worldbank.org/curated/ en/2012/11/17097815/turn-down-heat-4%C2%B0c-warmer-world-must-avoided
19 UNEP Emissions Gap Report, 2014. http://www.unep.org/publications/ebooks/emissionsgapreport2014/portals/50268/pdf/EGR2014_ EXECUTIVE_SUMMARY.pdf
20 IEA, World Energy Outlook 2012 http://www.worldenergyoutlook.org/publications/weo-2012/
195
NUMBER OF PARTIES
SIGNED THE UNFCCC
(UNITED NATIONS
FRAMEWORK
CONVENTION ON
CLIMATE CHANGE)
Global Climate Change mitigation and actions
towards it
The main objective of the United Nations Framework Convention on Climate Change (UNFCCC), which was held in Rio in 1992, was defined as “achieving stabilization of greenhouse gas concentrations in the atmosphere at a level that would prevent dangerous anthropogenic interference with the climate system”. From that day on, mechanisms affiliated with the UNFCCC, which was signed by 196 parties (195 states and the European Union), have served as the main processes guiding the efforts of governments towards climate change mitigation.
The UNFCCC Conference of the Parties to be held in Paris at the end of 2015 (COP21) is of critical importance for reaching a new agreement that will replace the Kyoto Protocol after 2020. Prior to the summit, all state parties to the UNFCCC were called on to determine their national contributions (INDC – Intended Nationally Determined Contributions) and submit these to the UNFCCC Secretariat. When this report was in progress, 83 parties (111 countries if the EU countries are taken into account separately) that are responsible for the 73.7% of the world’s total emissions had already submitted their national contributions to the UNFCCC.
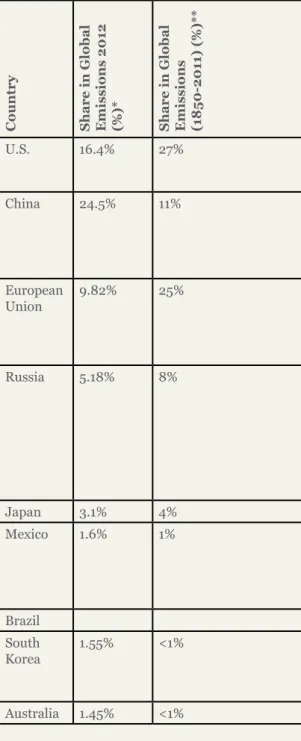
For the success of climate change mitigation efforts, each country should identify its share regarding the carbon budget under 2°C target and its level of development, and take action in this direction. Within this framework, targets and commitments that have been or will be put forward by developing countries (such as China, India, Mexico, Turkey, and South Korea), which constitute the main driving force behind rising emissions in the recent period, bear as much importance as those adopted by developed countries (including the U.S., Australia, Japan and the EU members) which have higher historical responsibilities. With the critical Paris summit approaching, emission reduction targets declared by some of these countries are shown in Table 1.
INDC and Target Types
On the eve of the 2015 Paris Climate Conference (COP21), contracting countries have been submitting to the UNFCCC their post-2020 schemes for climate change mitigation under the title of INDC (Intended Nationally Determined Contributions). INDC’s involve various types of targets for reducing GHG emissions:
- Base year target: A commitment to reduce, or control the increase of, emissions by a specified quantity relative to a base year.
- Fixed level target: A commitment to reduce, or control the increase of, emissions to an absolute emissions level in a target year.
- Baseline scenario target: A commitment to reduce emissions by a specified quantity relative to a projected emissions baseline scenario.
- Intensity target: A commitment to reduce emissions intensity (emissions per unit of another variable, typically GDP) by a specified quantity relative to a historical base year.
- Trajectory target: A commitment to reduce, or control the increase of, emissions to specified emissions quantities in multiple target years or periods over a long time period. years over the long run.
Country Share in Global Emissions 2012 (%)* Share in Global Emissions (1850-2011) (%)** Annual Per Capita GHG Emissions (Tons) Type of Target Emission Reduction Target****
U.S. 16.4% 27% 19.9 Base year target - An emission reduction of 26-28% by 2025 relative to the 2005 level.
- According to the U.S., this target seems consistent with the pathway leading to an 80% emission reduction by 2050.
China 24.5% 11% 8.1 Intensity and
trajectory targets
- To reach a peak point in GHG emissions in 2030 and initiate a downward trend thereafter.
- To reduce, by 2030, the economy’s carbon intensity (GDP/GHG emissions) by 60-65% relative to the 2005 level.
- To increase the share of non-fossil energy sources in primary energy consumption to 20%. European
Union 9.82% 25% 8.8 Base year target - The EU seems, in the current situation, to have started a low carbon transformation in its economy. From 1990 to this day, its economy has grown by 44% while its emissions have decreased by 19%. There has been a decrease in per capita emissions as well.
- The EU’s target for the year 2030 is to reduce its emissions by at least 40% relative to the 1990 level.
Russia 5.18% 8% 16.2 Base year target - Russia submitted a rather vague national contribution document. It proposes a reduction
of 25-30% by 2030 relative to the 1990 level. This proposal, which also takes into account the carbon sink capacity of forest lands in Russia, envisages a 6-11% decrease in industrial emissions compared to 1990.
- The process of economic restructuring undertaken by Russia after the dissolution of the Soviet Union in 1990 led to a significant decrease in emissions. For emissions in 2012 were 50% less than the 1990 level, the target set by Russia implies that its emissions will continue to rise. *****
Japan 3.1% 4% 10.5 Base year target - An emission reduction of 26% by 2030 relative to the 2013 level.
Mexico 1.6% 1% 6 Baseline
scenario target, and Intensity and trajectory targets
- An emission reduction of 25% by 2030 relative to the reference scenario (BaU).
- To reach a peak point in net emissions and initiate a downward trend starting from 2026. - To reduce the economy’s carbon intensity (GDP/GHG emissions) by 40% in the period of 2013-2030.
Brazil Base year target - An emission reduction of 37% by 2025 relative to the 2005 level.
South
Korea 1.55% <1% 13.9 Baseline scenario target -A reduction of 37% by 2030 relative to the Business-as-Usual Scenario (BaU - 850.6 MtCO2e)******
- A section on climate change adaptation is also included in South Korea’s national contribution document.
Australia 1.45% <1% 28.5 Base year target - An emission reduction of 26-28% by 2030 relative to the 2005 level.
* The figures in this column do not take into account the emissions generated by land use, land use change and forestry and carbon sinks. Source: World Resources Institute CAIT Database (http://cait.wri.org).
** Source: World Resources Institute: http://www.wri.org/blog/2014/11/6-graphs-explain-world%E2%80%99s-top-10-emitters
*** The figures in this column do not take into account the emissions generated by land use, land use change and forestry and carbon sinks. Source: World Resources Institute CAIT Database (http://cait.wri.org).
**** Source: Paris Contributions Data, World Resources Institute. http://cait.wri.org/indc/
***** Source: Climate Action Tracker. http://climateactiontracker.org/countries/russianfederation.html
****** Carbon dioxide equivalent (CO2e) is a standard unit that allows quantifying greenhouse gases with differing impact levels in a common unit based on the specific impact of each gas on global warming. CO2e signifies the amount of CO2 which would have the equivalent global warming impact. For instance, the global warming impact of nitrous oxide is 310 times the impact of carbon dioxide. In other words, one unit of N2 O equals 310 CO2 -equivalent. Source: Regional Environmental Center, 2009. International Local Government GHG Emissions Analysis Protocol (IEAP) http://www.rec.org.tr/dyn_files/20/4865-seragazi-kitap.pdf
Table 1: Emission Reduction Targets Submitted by Certain Countries Prior to 2015 Paris Climate Conference (COP21)
Country Share in Global Emissions 2012 (%)* Share in Global Emissions (1850-2011) (%)** Annual Per Capita GHG Emissions (Tons) Type of Target Emission Reduction Target****
U.S. 16.4% 27% 19.9 Base year target - An emission reduction of 26-28% by 2025 relative to the 2005 level.
- According to the U.S., this target seems consistent with the pathway leading to an 80% emission reduction by 2050.
China 24.5% 11% 8.1 Intensity and
trajectory targets
- To reach a peak point in GHG emissions in 2030 and initiate a downward trend thereafter.
- To reduce, by 2030, the economy’s carbon intensity (GDP/GHG emissions) by 60-65% relative to the 2005 level.
- To increase the share of non-fossil energy sources in primary energy consumption to 20%. European
Union 9.82% 25% 8.8 Base year target - The EU seems, in the current situation, to have started a low carbon transformation in its economy. From 1990 to this day, its economy has grown by 44% while its emissions have decreased by 19%. There has been a decrease in per capita emissions as well.
- The EU’s target for the year 2030 is to reduce its emissions by at least 40% relative to the 1990 level.
Russia 5.18% 8% 16.2 Base year target - Russia submitted a rather vague national contribution document. It proposes a reduction
of 25-30% by 2030 relative to the 1990 level. This proposal, which also takes into account the carbon sink capacity of forest lands in Russia, envisages a 6-11% decrease in industrial emissions compared to 1990.
- The process of economic restructuring undertaken by Russia after the dissolution of the Soviet Union in 1990 led to a significant decrease in emissions. For emissions in 2012 were 50% less than the 1990 level, the target set by Russia implies that its emissions will continue to rise. *****
Japan 3.1% 4% 10.5 Base year target - An emission reduction of 26% by 2030 relative to the 2013 level.
Mexico 1.6% 1% 6 Baseline
scenario target, and Intensity and trajectory targets
- An emission reduction of 25% by 2030 relative to the reference scenario (BaU).
- To reach a peak point in net emissions and initiate a downward trend starting from 2026. - To reduce the economy’s carbon intensity (GDP/GHG emissions) by 40% in the period of 2013-2030.
Brazil Base year target - An emission reduction of 37% by 2025 relative to the 2005 level.
South
Korea 1.55% <1% 13.9 Baseline scenario target -A reduction of 37% by 2030 relative to the Business-as-Usual Scenario (BaU - 850.6 MtCO2e)******
- A section on climate change adaptation is also included in South Korea’s national contribution document.
Australia 1.45% <1% 28.5 Base year target - An emission reduction of 26-28% by 2030 relative to the 2005 level.
* The figures in this column do not take into account the emissions generated by land use, land use change and forestry and carbon sinks. Source: World Resources Institute CAIT Database (http://cait.wri.org).
** Source: World Resources Institute: http://www.wri.org/blog/2014/11/6-graphs-explain-world%E2%80%99s-top-10-emitters
*** The figures in this column do not take into account the emissions generated by land use, land use change and forestry and carbon sinks. Source: World Resources Institute CAIT Database (http://cait.wri.org).
**** Source: Paris Contributions Data, World Resources Institute. http://cait.wri.org/indc/
***** Source: Climate Action Tracker. http://climateactiontracker.org/countries/russianfederation.html
****** Carbon dioxide equivalent (CO2e) is a standard unit that allows quantifying greenhouse gases with differing impact levels in a common unit based on the specific impact of each gas on global warming. CO2e signifies the amount of CO2 which would have the equivalent global warming impact. For instance, the global warming impact of nitrous oxide is 310 times the impact of carbon dioxide. In other words, one unit of N2 O equals 310 CO2 -equivalent. Source: Regional Environmental Center, 2009. International Local Government GHG Emissions Analysis Protocol (IEAP) http://www.rec.org.tr/dyn_files/20/4865-seragazi-kitap.pdf
110%
RATE OF INCREASE
IN TURKEY’S GHG
EMISSIONS BETWEEN
1990 AND 2013
turkey and international Climate policies
Turkey started to take part in international climate policy processes at a rather early date by participating in the Noordwijk Ministerial Conference, which was held in the Netherlands in 1989. Despite its low historical responsibility, Turkey was listed, alongside developed countries with the highest levels of historical responsibility for climate change, under Annexes I and II of the United Nations Framework Convention on Climate Change, which was opened for signature in 1992. Being concerned about the ensuing obligations relating to emission reductions and financial support to developing countries, Turkey refrained, for a long time, from signing the convention. For this reason, it participated in the Kyoto Protocol negotiations held in 1997 in an “observer” capacity.
During the UNFCCC’s 7th Conference of the Parties (COP7), which was held in Marrakesh in 2001, Turkey was removed from Annex II and parties to the convention were invited to recognize the special circumstances of Turkey which place Turkey in a situation different from that of other parties included in Annex I. Following this development, Turkey became a party to the Framework Convention in 2004, and from this date on, started to participate more actively in climate policies. Turkey issued its first Greenhouse Gas Emissions Inventory in 2006 in an effort to fulfil one of the most significant obligations imposed on the parties, which requires each party to prepare its national GHG emissions inventory on a yearly basis and submit it to the UNFCCC. In 2007, Turkey prepared its first National Communication on Climate Change and established the Global Warming Research Commission at the Turkish Grand National Assembly. Following the entry into force of the Kyoto Protocol in 2005 and the opening of Turkey’s EU accession negotiations the same year, public discussions on Turkey’s expected approval of the Protocol intensified, consequently leading Turkey to ratify the Protocol in 2009. However, since Turkey participated in the preparations of the Kyoto Protocol as an observer, it did not undertake any emission reduction obligations at the time.
Turkey’s first Greenhouse Gas Emissions Inventory, published in 2006, reported that Turkey’s GHG emissions rose by 74.4% between 1990 and 2004. This rate has further increased in every new inventory because of the continuous increase in GHG emissions. Finally, the rate of emissions growth reached 110.4% in the 2015 inventory, constituting a slightly lesser rate compared to the previous year due to a change in the calculation method. Owing to these rates, Turkey has ranked first in GHG emissions growth among the Annex I countries every year since 2006. Turkey pronounced for the first time certain figures for emission reduction in the context of a prospective agreement that was supposed to be signed prior to the UNFCCC’s 15th Conference of the Parties (COP15), which was held in Copenhagen in 2009. As the conference failed, however, Turkey did not again make any emission reduction commitments, nor did it endorse the Copenhagen Accord.
At the UNFCCC’s 16th Conference of the Parties (COP16), which was organized in Cancún in 2010, all parties recognized Turkey’s special circumstances under Annex I. Despite this development, Turkey did not join the Kyoto Protocol’s second commitment period that was opened for signature in Doha in 2012. When this process was combined with Turkey’s fossil fuel-oriented rapid development policies and its strategy to prioritize coal use, Turkey’s efforts towards climate change mitigation waned.
When Turkey announced at the UNFCCC’s 19th Conference of the Parties (COP19) in Warsaw in 2013 that it will agree to become a party to the new agreement with a flexible target to be determined on its own terms if the critical mass is reached, Turkey’s climate policies entered a new phase. President Erdoğan declared, at the United Nations Climate Change Leaders’ Summit in New York in 2014, that Turkey was ready to undertake its responsibility in the new process. In the lead-up to the UNFCCC’s 21th Conference of the Parties (COP21) to be held in Paris in December 2015, Turkey has been preparing to contribute to international climate change mitigation efforts with a plan (INDC) it has itself drawn up for the first time.
Even though it has not set an emission reduction target throughout the international climate negotiations, Turkey has prepared strategy documents and action plans on climate change mitigation, designed sectoral policies, and realized projects on capacity building, climate change impact assessment and adaptation.
Establishing voluntary carbon markets, subsidizing renewable energy by laws and regulations, and organizing campaigns aiming to reduce, though in a limited manner, energy-generated emissions through demand management can be cited among Turkey’s endeavours towards curbing GHG emissions growth. In its first National Communication on Climate Change, Turkey stated that the rise in emissions could be 7% lower by 2020. However, all these policies did not add up to a scheme that would allow an active involvement in and contribution to international climate change mitigation processes. When considered in relation to Turkey’s national energy strategy based on increasing the share of coal in the energy mix, this situation suggests that Turkey does not yet pursue a concrete policy for emission reduction. The Conference of the Parties to be held in Paris in December 2015 is a crucial turning point in this respect.*
*For more detailed information on this issue, see: Şahin, Ümit. 2014. “Türkiye’nin İklim Politikalarında Aktör Haritası”, Sabancı University Istanbul Policy Center. http://ipc.sabanciuniv.edu/wp-content/uploads/2014/12/ AktorHaritasiRapor_25.11.14_web.pdf
PART 2:
LOW CARBON
DEVELOPMENT
PATHWAYS FOR
LOW CARBON
DEVELOPMENT PATHWAYS
FOR TURKEY
TURKEY’S RANKING
IN GLOBAL GHG
EMISSIONS
19
In its Fifth Assessment Report issued in 2013, the Intergovernmental Panel on Climate Change stated with 95 percent confidence that humans are the main cause of the current global warming. The IPCC underscored that two thirds of the GHG emissions released since the industrial revolution have been generated by burning of fossil fuels and cement production.22
In the period between 1880 and 2012, average temperatures rose by 0.85°C. If the current rate of increase in GHG emissions persists, the temperature rise is expected to reach 2°C around the year 2030.23 If no measure is taken, the temperature rise
may reach 4°C in 206024, and 6°C at the end of the century25. Scientists claim that for
avoiding the devastating impacts of climate change, the rise in average temperatures compared to pre-industrial levels should be limited to 2°C.
According to the IPCC, meeting the 2°C target requires a radical transformation in the global energy infrastructure so as to ensure significant reductions in GHG emissions in the shortest time possible. Accordingly, the share of low carbon energy in electricity production should exceed 90% by 2050. Acknowledging this scientific fact, in the G7 summit held in Germany in June 2015, G7 countries emphasized that the global economy should be decarbonised by the end of the 21th century, and to this end, both developed and developing countries should transform, in a comprehensive manner, their energy sectors up until 2050. 26
Turkey’s GHG emissions amount to 4‰ of the cumulative historical global
emissions27 and to 0.94% of the global emissions in 201328. In 2012, Turkey ranked
19th in total GHG emissions in the world and 81st in per capita emissions among 182 countries.29 With per capita emissions of 6.04 tons30, Turkey is below the world
average. The rise in Turkey’s emissions since 1990 is remarkable, though. In the period between 1990 and 2013, Turkey’s total annual emissions increased by 110.4%,
and per capita emissions by 53%.31
Mitigating climate change is an issue that calls for global solutions. As also
highlighted by climate scientists, meeting the 2°C target requires decarbonisation of the global economy. The sooner this requirement is fulfilled, the higher the chances of preserving life, human civilization and the ecological system on our planet will be.
22 Intergovernmental Panel on Climate Change (IPCC) Fifth Assessment Report Working Group III. “Climate Change 2014: Mitigation of Climate Change” http://mitigation2014.org/report/summary-for-policy-makers
23 Met Office Hadley Center. Climate risk: An update on the science. 2014 14/0479
24 “Turn Down The Heat: Why a 4°C World Must be Avoided”, World Bank, 2012. http://documents.worldbank.org/curated/ en/2012/11/17097815/turn-down-heat-4%C2%B0c-warmer-world-must-avoided
25 Intergovernmental Panel on Climate Change (IPCC) Fifth Assessment Report Working Group II. “Climate Change 2014: Impacts, Adaptation, and Vulnerability” http://ipcc-wg2.gov/AR5/images/uploads/IPCC_WG2AR5_SPM_Approved.pdf
26 2015 G7 Summit Leaders’ Declaration. https://www.g7germany.de/Content/EN/_Anlagen/G7/2015-06-08-g7-abschluss-eng_en.pdf?__ blob=publicationFile&v=3
27 World Resources Institute, 2005. Navigating the Numbers: Greenhouse Gas Data and International Climate Policy http://pdf.wri.org/ navigating_numbers_chapter6.pdf
28 World Resources Institute CAIT Climate Data Explorer, http://cait.wri.org/historical 29 World Resources Institute CAIT Climate Data Explorer, http://cait.wri.org/historical
30 TurkStat, Greenhouse Gas Emissions Inventory, 2013. http://www.tuik.gov.tr/PreHaberBultenleri.do?id=18744 31 TurkStat, Greenhouse Gas Emissions Inventory, 2013. http://www.tuik.gov.tr/PreHaberBultenleri.do?id=18744
Countries that have a mutual responsibility for taking action have been carrying on climate negotiations for more than twenty years with the aim of ensuring the fair allocation of this . The Conference of the Parties (COP21) to be held in Paris in December 2015 bears particular importance. Before the Paris Conference, during which a new agreement to replace the Kyoto Protocol will be negotiated, all countries are expected to submit their INDCs to the UNFCCC Secretariat.
Turkey previously announced that it will endorse the Paris Agreement, which is expected to be signed at the end of 2015. In order to determine its INDC, Turkey should identify its share in global emission reductions on the basis of its historical and current responsibility and its right to development; specify what kind of low carbon development policies it will adopt and how it will implement these policies to ensure its reduction target; scientifically assess the costs and impacts of these reduction policies on the country’s economy and how negative impacts might be mitigated.
In this research, we seek answers to three major questions in an effort to support Turkey’s endeavours towards the above-mentioned goals:
1. What responsibility lies with Turkey within the scope of the 2°C target, and what could its emission reduction target be?
2. What kind of a low carbon policy package could be adopted in order to achieve the required emission reduction?
3. What kind of an impact could these policies have on macroeconomic indicators? What are the costs of implementing and not implementing these policies?
Izmir, Turkey © Şeref Yılmaz - Getty Images Turkey
over the medium/long run?
2. What is the appropriate policy mix for sustaining green growth under this path, given the fiscal and external constraints and specific labor market rigidities? 3. What are the possible mix of innovation technologies and tax-cum-incentive policies to enhance productivity growth and to foster employment?
An important premise in the analysis is that, in order to capture the general equilibrium effects of green policies, these will need to accompany ongoing growth-enhancing economic policies aimed at increasing the level of investment and its efficiency, achieving stronger employment generation and higher labor productivity, and other measures to enhance competitiveness and mitigate risks.
To this end, a Computable General Equilibrium (CGE) model of the Turkish economy has been developed, in order to assess the impact of a selected number of climate policy instruments and public policy intervention mechanisms, including market-based incentives designed to accelerate technology adoption and achieve higher employment and sustainable growth patterns. The study spans the 2015-2030 growth trajectory of the Turkish economy, with a detailed focus on carbon emissions from both firms and households and the relevant market instruments of abatement. The base year for our model is 2010. The notion of a “base year” is necessary for our analytical model to “calibrate” the micro/sectorial and macroeconomic balances to the existing data.
A major source of data for this analysis is the Input/Output (I/O) statistics. The most recent I/O data for Turkey is available for 2002. This data was updated to 2010 balances using the national income data on macro aggregates.
In the model, 18 sectors have been distinguished, 17 of which are officially recognized in the I/O. The additional “Renewable Energy Sources” sector was deduced
separately and was appended as a new sector to the I/O data. Renewable Energy Sources was accommodated using available data from World Energy Association, the World Input-Output Data, and independent studies. For the GHG data, the model drew on the Greenhouse Gas Inventories prepared by the Turkish Statistical Institute (TurkStat) within the scope of the UN Framework Convention on Climate Change. Additional information on methodology may be found in the “Appendix” of this report.
© Mustafa Can - Getty Images Turkey
Why was the Computable General Equilibrium Model Preferred? Alternative approaches to energy-economy-environment modelling are mainly categorized into four: top-down, bottom-up, hybrid and econometric approaches. The most commonly used tool of the top-down approach is the computable general equilibrium (CGE) modeling. This model enables the representation of the macroeconomic structure of the country under analysis, thus allowing the observation of the impact of any policy change on the scale of the entire economy. On the other hand, these models lack statistical background in the standard calibration process. Besides, these models generally omit explicit capital representation of the energy sector as they use economic variables in an aggregated manner; hence they are considered weak in representing the
technological restrictions in detail. Moreover, top-down approaches are based on past data and assume rational agents so that they are also weak in representing inter-fuel substitution possibilities. As a result, top-down approaches tend to overestimate the cost of mitigation options.
This study aims to understand the macroeconomic implications of GHG emission reduction targets related climate change policy instruments that could be employed to achieve these targets. Therefore, it was based on the General Equilibrium Model. When assessing its results, the model’s tendency to overestimate the cost of relevant mitigation policy instruments should be taken into consideration.
65%
PERCENTAGE OF THE
CARBON BUDGET
THAT HAS BEEN
USED UP SINCE
THE INDUSTRIAL
REVOLUTION
Carbon budget for the 2°C target: what Could
turkey’s emission reduction target be?
The term carbon budget signifies the total amount of global GHG emissions that the atmosphere can “tolerate” in a given time period, or in other words, that will allow keeping the average temperature rise below 2°C. According to the Fifth Assessment Report issued by the Intergovernmental Panel on Climate Change, in order to keep global warming below 2°C, the maximum amount of green house gases that can be emitted since the industrial revolution, namely the global carbon budget, is likely32
to be 2900 GtCO2 (Figure 1). 1900 GtCO2 (65%) of this budget had been used up until 2011.33 Current emission trends indicate that the remaining 1000 GtCO2 will
have been emitted to the atmosphere before 2050.34 In order to meet the 2°C target, ,
global carbon neutrality will need to be achieved sometime between 2055 and 207035
and total global greenhouse gas emissions need to shrink to net zero some time
between 2080 and 210036 (Figure 2).
Figure 1: Global Carbon Budget
Total CO2 Budget
2900
Gt CO2 Remaining CO2 Budget1000
Gt CO2 CO2 Emissions Between 1870-20111900
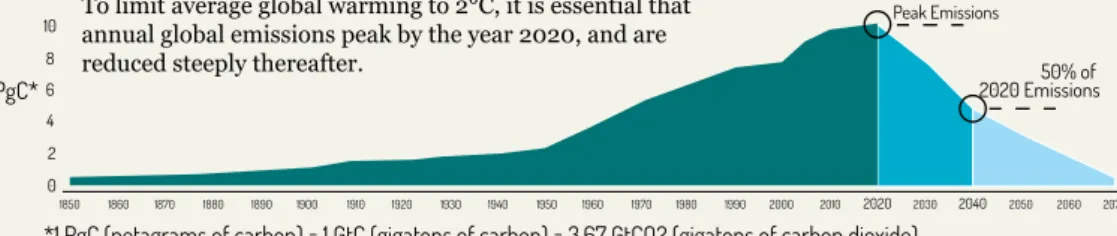
Gt CO2 20 15Figure 2: Global Carbon Emission Reduction Curve to Remain Below 2°C Threshold
2040 50% of 2020 Emissions 2020 2030 2050 2060 2070 2010 2000 1990 1980 1970 1960 1950 1940 1930 1920 1910 1900 1880 1890 1870 1860 1850 12 10 8 6 PgC* 4 2 0 Peak Emissions
*1 PgC (petagrams of carbon) = 1 GtC (gigatons of carbon) = 3.67 GtCO2 (gigatons of carbon dioxide)
Source: http://www.wri.org/ipcc-infographics
Peak Emissions
According to climate science, global carbon neutrality will need to be achieved sometime between 2055 and 2070, and total global greenhouse gas emissions need to shrink to net zero some time between 2080 and 2100. On the other hand, however, the upward trend in global emissions continues. When and at what level emissions growth will be halted (peak emissions), and how rapidly emissions will be reduced thereafter are crucial factors that will spell the success of efforts towards the 2°C target.
32 In the IPCC terminology, the following terms are used to express the likelihood of occurrence of an outcome based on expert views: Virtually certain > %99, Extremely likely > %95, Very likely > %90, Likely> %66, More likely than not > %50, Unlikely < %33 Very unlikely < %10, Extremely unlikely < %5.
33 Intergovernmental Panel on Climate Change (IPCC) Fifth Assessment Report, “Climate Change 2014: Synthesis Report” http://www.ipcc.ch/ pdf/assessment-report/ar5/syr/AR5_SYR_FINAL_SPM.pdf
34 Understanding the IPCC Reports, World Resources Institute. http://www.wri.org/ipcc-infographics
35 Net carbon emission = Amount of carbon released to the atmosphere – Amount of carbon absorbed by carbon sinks
36 UNEP Emissions Gap Report, 2014. http://www.unep.org/publications/ebooks/emissionsgapreport2014/portals/50268/pdf/EGR2014_ EXECUTIVE_SUMMARY.pdf
To limit average global warming to 2°C, it is essential that annual global emissions peak by the year 2020, and are reduced steeply thereafter.
TURKEY’S FAIR SHARE
IN THE GLOBAL
CARBON BUDGET
AND EMISSION
REDUCTION TARGETS
WAS DETERMINED
ACCORDING TO ITS
“MINIMUM HISTORICAL
RESPONSIBILITY”
AND “MAXIMUM
DEVELOPMENT
NEEDS”
This picture, depicted by climate scientists, indicates that the entire global economy, including both developed and developing countries, should take part in this
transformation. Accordingly, countries should determine their share on the basis of a range of indicators that include historical emissions and levels of development. In an effort to establish Turkey’s share in the global carbon budget in reference to its historical and current emission trends, its economic structure and level of development, and thus find out what kind of an emission reduction commitment it may face, this study employed the “Climate Equity Reference Calculator” (CERC)
designed by the Stockholm Environment Institute and EcoEquity.37
In order to determine the global carbon budget, the CERC based calculation rested on the “2°C Pathway”, which is also consistent with the reference pathway contained in UNEP’s Emissions Gap Report.
Turkey is a G20 country that has a low historical responsibility due to its late economic development and has not undertaken any commitment during the first commitment period of the Kyoto Protocol. On the other hand, however, it has a high level of dependence on fossil fuels in energy production and a high economic growth rate as of today. Having increased its total emissions by 110.4% since 1990, Turkey will determine its contribution to the international efforts for climate change mitigation in accordance with the principle of “common but differentiated responsibilities” and of its position to date as “a developing country with special circumstances” under Annex I. For this reason, Turkey’s fair share of the global carbon budget and of emission reduction targets was assessed on the basis of “minimum historical responsibility” and “maximum development needs”.
Climate Equity Reference Calculator (CERC)
The CERC is an online climate equity reference tool designed to determine each country’s “fair share” of the global carbon budget and the global climate mitigation effort. In order to ensure the fair sharing of the carbon budget and the mitigation responsibility, this tool rests on the UNFCCC’s principles of “equity” including adequacy, common but differentiated responsibilities and capabilities, and fair access to sustainable development. The calculator enables the user to specify a given country’s “responsibility” in emissions growth and its “national capacity” for emission reduction. With this tool, the relevant country’s fair share of the global carbon budget allowed to meet the 2°C can be calculated on the basis of such parameters as current demographic and macroeconomic indicators, historical responsibility in emissions, and present national capacity.
With the CERC, the user selects from among three separate emission reduction pathways (1,5°C, 2°C and G8 pathways, from the most ambitious to the least), and among various assumptions regarding the responsibility of the country under analysis in historical emissions and its capacity for emission reduction, or in other words, its national income. Based on these selections, the tool delivers an emission projection for the relevant country revealing the country’s fair share in global emission reduction efforts, according to its historical responsibility and its income level.
For more information: http://climateequityreference.org/calculator-about/
1 BILLION
tONs
TURKEY’S
ESTIMATED TOTAL
GHG EMISSIONS
BY 2030 UNDER
OFFICIAL PLANS
SCENARIO
scenarios: what Direction will turkey’s GhG emissions take?
Turkey’s GHG emissions rose by 110.4% in the period between 1990 and 2013. During the same period annual per capita emissions displayed an increase of 53%, rising from 3.96 tons to 6.04 tons. With increase rates of over 130%, energy and industry were the main sectors that drove emissions growth in this period. Emissions generated by electricity production grew by 236%, increasing the share of electricity production in
total emissions from 15% to 25%.38
Projections for the future vary. Variations in economic growth predictions lead to discrepancies in emissions growth projections. One thing is for certain though; for the success of climate change mitigation efforts, curbing emissions growth is a must. In this regard, the analysis sets forth three different emissions growth scenarios:
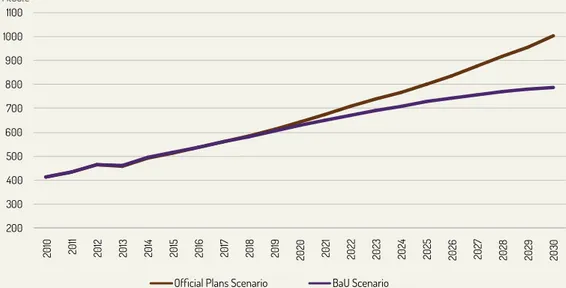
1. official plans scenario
Given the economic growth rates targeted by Turkey’s official economic program (a real annual GDP growth rate of 5% in the medium term), annual GHG emissions, which amounted to 459 million tons CO2e* in 2013, are projected to increase to over 1 billion tons CO2e* in 2030 under a scenario where no new policy measure to reduce emissions is implemented (Figures 3-6). This trend constitutes the backbone of the Official Plans Scenario. Under this scenario, annual CO2 emissions are predicted to rise to the level of 851 million tons by 2030, with the cumulative CO2 emissions in the 2010-2030 period totalling 11.58 billion tons.
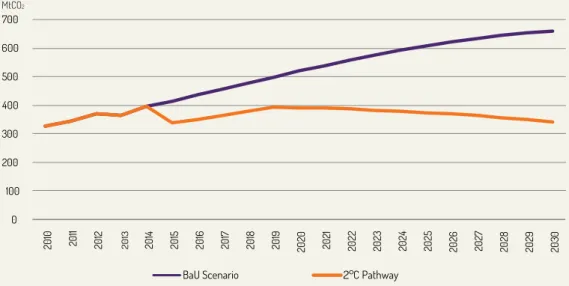
2. business-as-usual (bau) scenario
This scenario rests on growth projections that are more realistic and more consistent with the recessionary tendencies in the global and national economy (an average annual GDP growth rate of 3.45% during the period). Under this scenario where, again, no new policy measure to reduce emissions is taken, total GHG emissions are envisaged to rise from the 2013 level of 459 million tons CO2e up to 787 million tons by 2030 (Figures 3, 4, and 6). This projection is referred to as the Business-as-Usual Scenario (BaU) in this analysis. According to this scenario, annual CO2 emissions are predicted to increase to 659 million tons by 2030, with the cumulative CO2 emissions in the 2010-2030 period exceeding 10.67 billion tons.
The analysis presented in this report employs the Business-as-Usual Scenario which is more likely to occur in the light of the current global economic developments, as the reference scenario. It should be underlined that unrealistically high emissions growth projections under the Official Plans Scenario entail the risk of over estimating emission reduction targets.
Details of emission projections under different scenarios are shown in Table 4 on page 37.
* Carbon dioxide equivalent (CO2e) is a standard unit that allows quantifying greenhouse gases with differing impact levels in a common unit based on the specific impact of each gas on global warming. CO2e signifies the amount of CO2 which would have the equivalent global warming impact. For instance, the global warming impact of nitrous oxide is 310 times the impact of carbon dioxide. In other words, one unit of N2 O equals 310 CO2 -equivalent. Source: Regional Environmental Center, 2009. International Local Government GHG Emissions Analysis Protocol (IEAP) http://www.rec.org.tr/dyn_files/20/4865-seragazi-kitap.pdf