IMPACT OF GLOBAL AND DOMESTIC
MACROECONOMIC VARIABLES ON BORSA ISTANBUL
STOCK RETURNS
A Master’s Thesis
by
MUSTAFA FIRAT
Department of Management
İhsan Doğramacı Bilkent University
Ankara
August 2013
To mom the wise woman, dad the intellectual man and Vahap E. the great master.
IMPACT OF GLOBAL AND DOMESTIC
MACROECONOMIC VARIABLES ON BORSA ISTANBUL
STOCK RETURNS
Graduate School of Economics and Social Sciences
of
İhsan Doğramacı Bilkent University
by
MUSTAFA FIRAT
In Partial Fulfillment of the Requirements for the Degree of
MASTER OF SCIENCE
in
THE DEPARTMENT OF MANAGEMENT
İHSAN DOĞRAMACI BİLKENT UNIVERSITY
ANKARA
August 2013
I certify that I have read this thesis and have found that it is fully adequate, in scope and in quality, as a thesis for the degree of Master of Science in Management.
--- --- Assoc. Prof. Aslıhan Altay-Salih Assist. Prof. Cemal Deniz Yenigün
Supervisor Co-Supervisor
I certify that I have read this thesis and have found that it is fully adequate, in scope and in quality, as a thesis for the degree of Master of Science in Management.
--- Assoc. Prof. Levent Akdeniz Examining Committee Member
I certify that I have read this thesis and have found that it is fully adequate, in scope and in quality, as a thesis for the degree of Master of Science in Management.
---
Assist. Prof. Esra Eren Bayındır Examining Committee Member
Approval of the Graduate School of Economics and Social Sciences
--- Prof. Erdal Erel
III ABSTRACT
IMPACT OF GLOBAL AND DOMESTIC MACROECONOMIC VARIABLES ON BORSA ISTANBUL STOCK RETURNS
Fırat, Mustafa
M.S., Department of Management Supervisor: Assoc. Prof. Aslıhan Altay-Salih Co-Supervisor: Assist. Prof. Cemal Deniz Yenigün
August 2013
This study investigates the impact of global and domestic macroeconomic variables on the monthly returns of stocks traded in Borsa Istanbul during 1998-2011 period. 13 variables are chosen as the candidates of source of variations in stock returns: BIST 100 index, one month lagged series of BIST 100 index, realized volatility of BIST 100 index, price-to-earnings (P/E) ratio, trade volume, S&P 500 index, inflation, foreign trade balance, industrial production index, oil prices, gold prices, foreign exchange rate and interest rate on short term government bonds. Taking the return of BIST 100 index as the dependent variable, 5 of the remaining 12 variables, namely, S&P 500 index, trade volume, industrial production index, foreign exchange rate and interest rate on short term government bonds are selected as the best model by using an algorithm based on model selection criteria, AIC and LASSO. These variables are regressed on return of BIST 100 index and residual of this regression (market residual) is regarded as the 6th factor, then the explanatory power of this 6-factor
model is analyzed on Fama-French size and book-to-market portfolios. Market residual, S&P 500 index and trade volume are found to have a statistically significant explanatory power on all portfolios, whereas industrial production index and foreign exchange rate are found to be effective with significance level of above 5%. On the other hand, interest rate on short term government bonds has no significant effect on stock returns.
IV
Keywords: APT test, Macroeconomic variables, Turkish stock market, Borsa Istanbul
V ÖZET
KÜRESEL VE YEREL MAKROEKONOMİK DEĞİŞKENLERİN BORSA İSTANBUL’DAKİ HİSSE SENETLERİNİN GETİRİLERİ ÜZERİNDEKİ
ETKİSİ
Fırat, Mustafa
Yüksek Lisans, İşletme Bölümü
Tez Yöneticisi: Doç. Dr. Aslıhan Altay-Salih
Ortak Tez Yöneticisi: Yrd. Doç. Dr. Cemal Deniz Yenigün
Ağustos 2013
Bu çalışmada Borsa İstanbul’da 1998-2011 yılları arasında işlem gören hisse senetlerinin getirileri üzerinde etkili olan küresel ve yerel makroekonomik değişkenler incelenmiştir. BİST 100 endeksi, BİST 100 endeksinin 1 ay gecikmeli serisi, BİST 100 endeksinin gerçekleşmiş oynaklığı, fiyat-kazanç (P/E) oranı, işlem hacmi, S&P 500 endeksi, enflasyon, dış ticaret açığı, sanayi üretim endeksi, petrol fiyatları, altın fiyatları, döviz kuru ve kısa vadeli hazine bonolarının faiz oranı olmak üzere 13 değişken hisse senetlerinin getirilerindeki değişkenliğin kaynağı olabilecek aday değişkenler olarak seçilmiştir. BİST 100 endeksi bağımlı değişken iken S&P 500 endeksi, işlem hacmi, sanayi üretim endeksi, döviz kuru ve kısa vadeli hazine bonolarının faiz oranı olmak üzere geri kalan 12 değişkenden 5 tanesi en iyi model olarak seçilmiştir. Bu model seçiminde AIC ve LASSO model seçme kıstaslarına dayanan bir algoritma kullanılmıştır. Bu değişkenlerle BİST 100 endeksi üzerine regresyon analizi yapılmış, regresyonun artığı (market artığı) 6. faktör olarak alınıp bu 6 faktörlü modelin Fama-French büyüklük ve kitap–piyasa değeri portföyleri üzerindeki açıklama gücü analiz edilmiştir. Market artığı, S&P 500 endeksi ve işlem hacminin tüm portföyler üzerinde istatistiksel olarak anlamlı etkisi bulunurken;
VI
sanayi üretim endeksi ve döviz kurunun ise %5’ten yüksek anlamlılık düzeylerinde açıklama gücü olduğu saptanmıştır. Diğer taraftan, kısa vadeli hazine bonolarının faiz oranının hisse senetleri üzerinde anlamlı etkisine rastlanamamıştır.
Anahtar Kelimeler: APT testi, Makroekonomik değişkenler, Türkiye pay piyasası, Borsa İstanbul
VII
ACKNOWLEDGMENTS
I owe my deepest gratitude to my supervisor Assoc. Prof. Aslıhan Altay-Salih for her guidance during my studies. I must emphasize that answering my persistent phone calls during her vacation was unforgettably kind. Without her intellectual suggestions, tolerance and affectionate personality; it would be impossible to complete this thesis.
It is a pleasure to appreciate my co-supervisor Assist. Prof. Deniz Yenigün for guiding me about the statistical tools, especially for teaching me the R language.
I am also grateful to Assoc. Prof. Levent Akdeniz and Assist. Prof. Esra Bayındır for examining my study in the middle of their holiday and giving feedback.
I am thankful to Assoc. Prof. Zeynep Onder. I can never forget her role in overcoming my problems throughout my life in Bilkent.
Last but not least, I would like to thank my dear friends for their valuable friendship and unconditional support, especially Berk Yayvak for helping me to find part of my data.
VIII
TABLE OF CONTENTS
ABSTRACT ... III ÖZET ... V ACKNOWLEDGMENTS ... VII TABLE OF CONTENTS ... VIII
CHAPTER 1: INTRODUCTION ... 1
CHAPTER 2: LITERATURE REVIEW ... 5
2.1 Capital Asset Pricing Model (CAPM) ... 5
2.2 Arbitrage Pricing Theory (APT) ... 7
2.2 Chen, Roll & Ross (1986) Study of Multi-factor Model ... 9
2.3 International Evidence from Developed Markets ... 12
2.4 International Evidence from Emerging Markets ... 15
2.5 Evidence from Turkish Stock Market ... 19
CHAPTER 3: MODEL SELECTION ... 26
3.1 Model Selection Criteria ... 27
3.2 Comparison Criterion ... 32
CHAPTER 4: DATA AND METHODOLOGY ... 35
4.1 Description of Data... 38
4.1.1 Domestic Financial Variables ... 38
4.1.2 Domestic Macroeconomic Variables ... 41
4.1.3 Global Variables ... 43
IX
4.3 Methodology ... 48
CHAPTER 5: ANALYSIS AND EMPIRICAL RESULTS ... 53
5.1 Variable Selection on Market Index ... 53
5.2 Time Series Regressions on Portfolios ... 57
5.3 Time Series Regressions with Market Residual ... 58
CHAPTER 6: CONCLUSION ... 64
1
CHAPTER 1
INTRODUCTION
Asset pricing is one of the fundamental areas of finance literature. Pricing of stocks and other assets has attracted the attention of a number of researchers and investors since the establishment of stock markets. Thus, the studies about explaining the variation in asset prices are as old as the stock markets. It is often argued that stock prices are affected by macroeconomic environment, which means that macroeconomic variables may influence the decisions of investors. This fact motivates many researchers to investigate the relationship between stock prices and macroeconomic variables.
In this context, there are many studies from both developed and emerging markets investigating the relation between macroeconomic variables and stock returns. Studies of Dhrymes et al. (1984) and Dhrymes et al. (1985)
2
can be seen as the first examples of this area but the most common paper on APT testing is known to be Chen et al. (1986) study, which is famous as
CRR on behalf of the names Chen, Roll and Ross. Some of the replications
or similar studies to CRR from different regions or countries can be listed as; Yli-olli & Virtanen (1992), Antoniou et al. (1998), Altay (2003), Shanken & Weinstein (2006), Humpe & Macmillan (2007), Goswami & Jung (1997), Fifield et al. (2002), Mahmood & Dinniah (2009), Pilinkus & Boguslauskas (2009), Hsing et al. (2012), Dasgupta (2012), Su (2006).
In addition to these studies from different regions, there are also some studies (including published papers and dissertations) from Turkish stock market in the context of macroeconomic variables, such as Altay (2003), Kandir (2008), Acikalin et al. (2008), Pekkaya & Bayramoğlu (2008), Rjoub et al. (2009), Çağlı et al. (2010), Ozbay (2009), Karagöz (2012), Özlen & Ergun (2012) and Kaya et al. (2013). The details of these studies are given in the next chapter.
The main hypothesis of this thesis is that one should be able to find appropriate macroeconomic factors that explain the common variation in stock returns traded in Borsa Istanbul with statistically significant coefficients. For this purpose, the relevant literature was reviewed, the
3
main studies were pursued, their proposed methods and models were considered. As a result, 13 global and domestic macroeconomic variables were chosen as the candidates of source of variations in stock returns traded in Borsa Istanbul and analyzed in 1998-2011 period.
The variables analyzed in this study are: BIST 100 index, one month lagged series of BIST 100 index, realized volatility of BIST 100 index, price-to-earnings (P/E) ratio, trade volume, S&P 500 index, inflation, foreign trade balance, industrial production index, oil prices, gold prices, foreign exchange rate and interest rate on short term government bonds. Taking the return of BIST 100 index as the dependent variable, the remaining 12 variables were analyzed by a model selection algorithm, which is based on model selection criteria, AIC and LASSO. Statistical performances of the models proposed by these two criteria were compared by using a comparison criterion, cross validation leave-one-out approach.
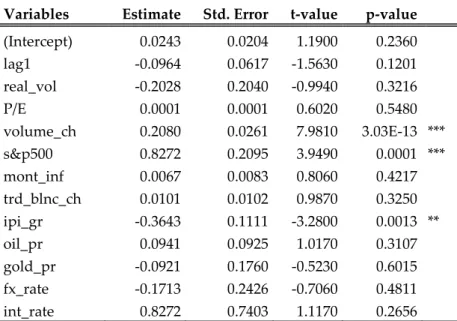
According to result of the comparison, the 5-factor model suggested by AIC performed better, which selected the variables S&P 500 index, trade volume, industrial production index, foreign exchange rate and interest rate on short term government bonds as the best model. BIST 100 index return was regressed on these 5 variables, and then the residual of this
4
regression (market residual) was regarded as the 6th factor. Then, the
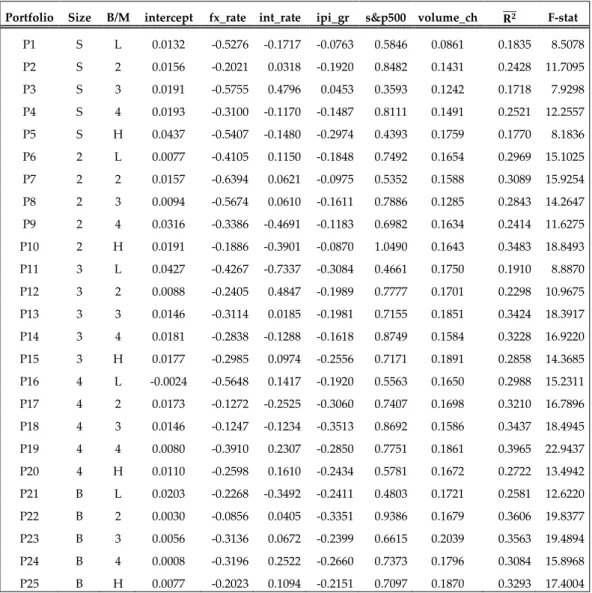
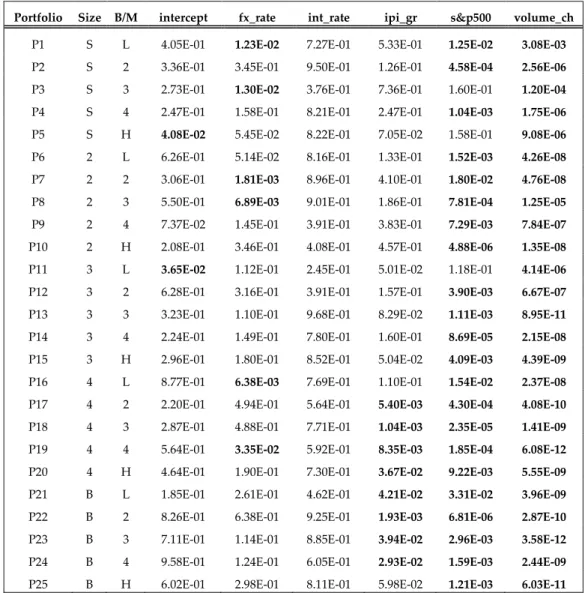
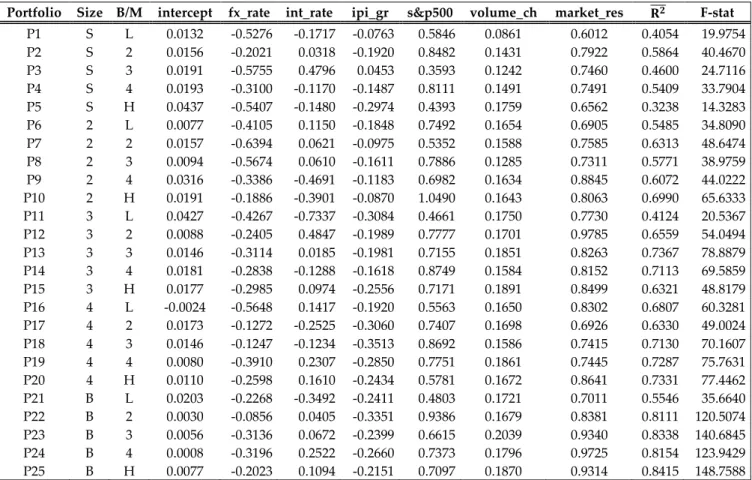
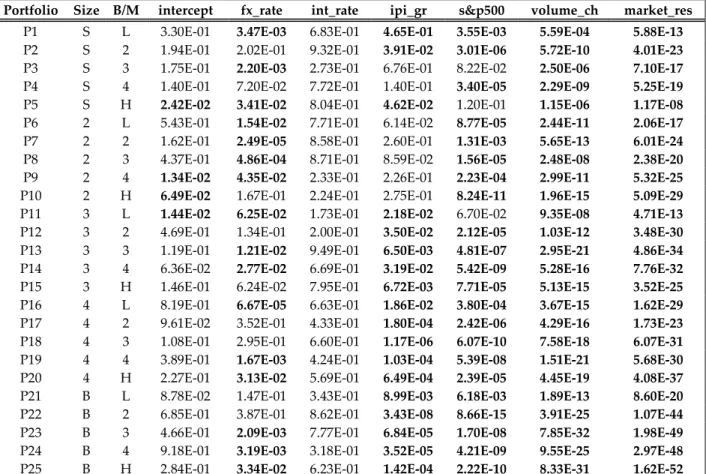
explanatory power of this 6-factor model was analyzed on a sample of consisting 25 portfolios, constructed according to Fama-French size and book-to-market portfolios (Fama & French, 1992). Result of the analyses showed that market residual, S&P 500 index and trade volume have a statistically significant explanatory power on all portfolios, whereas industrial production index and foreign exchange rate were found to be effective with significance level of above 5%. On the other hand, interest rate on short term government bonds had no significant effect on stock returns.
The organization of the thesis is as follows: Chapter 2 reviews the literature on asset pricing with an emphasis on CRR study and similar studies from variety of counties. Chapter 3 is devoted to explain the statistical tools and model selection criteria such as AIC and LASSO. Chapter 4 introduces the data and explains the methodology as well as model selection algorithm used in this study. Chapter 5 explains how the analyses and time-series regressions are performed on the data and presents the empirical results; and finally Chapter 6 concludes.
5
CHAPTER 2
LITERATURE REVIEW
This chapter reviews the literature starting from the 1960s and mentions the relevant studies as recent as 2013. The first part explains the CAPM, the first theoretical base of asset pricing. The second part is about APT, which generalizes the single factor model CAPM to n-factors. The third part is totally devoted to CRR study in order to understand the evolution of the asset pricing literature based on macroeconomic variables. Fourth, fifth and sixth parts presents the similar empirical evidences to this study from developed, emerging and Turkish stock markets respectively.
2.1 Capital Asset Pricing Model (CAPM)
As the finance literature and mathematical tools developed, intuitive studies and interpretations gave way to more analytical and theoretical
6
studies. The first theoretical model was developed in the 1960s. Capital Asset Pricing Model (CAPM) is a model for pricing an individual security or portfolio. CAPM of Sharpe (1964), Lintner (1965) and Mossin (1966) can be regarded as the birth of asset pricing theory. After the introduction of zero-beta-CAPM, one of the problematic assumptions of CAPM, namely unrestricted riskless borrowing assumption was smoothed (Black, 1972).
The risk of a portfolio (or an asset) contains systematic risk, and unsystematic risk. Systematic risk refers to the market risk common to all securities, which is undiversifiable. Unsystematic risk is the risk associated with individual assets, and it can be diversified by including a higher number of assets in the portfolio. Thus, it is reasonable to expect that the variations in stock returns be related to systematic risk. Sharpe starts from this point and shows that stock returns can be shown as a linear function of beta, as follows:
[ ] ( [ ] ) where, [ ] is the expected return on the capital asset i, is the risk-free rate of return, [ ] is the expected return of the market portfolio. The difference between the expected return of the market portfolio and risk free rate of return, namely [ ] , is known as excess market return.
7
to expected excess market returns. The beta is calculated by .
As a result, the return of the given stock can be shown as a linear function of its risk through the beta value. Each stock or portfolio has its own beta value, which is equal to covariance between the given stock and the market portfolio divided by the variance of the market portfolio, as indicated above.
This is the first model in asset pricing that relates risk and return systematically. CAPM is a single linear factor model, which explains the asset prices with a single linear factor, beta. On the other hand, researchers have argued that stock returns are affected by many factors (Ross, 1976).
2.2 Arbitrage Pricing Theory (APT)
Stephen A. Ross tried to find an alternative model for pricing the capital assets in his study (Ross, 1976). As mentioned above, the earlier method, CAPM, deals with only the relationship between risk and return of the assets, and states a linear relation between them. It is simple both mathematically and intuitively; tractability is one of the virtues of CAPM. Ross (1976) proposed an alternative way of pricing the assets, Arbitrage Pricing Theory (APT).
8
If we assume that returns on assets are generated by a k-factor model in a perfectly competitive and frictionless market, , the return on the ith asset
can be written as:
where, is the expected return of asset i, are common orthogonal factors to all assets, is the sensitivity of the return on asset i
to the variations in factor j and is the idiosyncratic risk component with zero mean. In a well-diversified economy with no arbitrage opportunity, ,the equilibrium expected return on the asset i can be written as:
where, are risk premiums corresponding to risk factors . If there is a risk free (or a zero beta) asset, of the equation (3) is expected to be the return of that asset (Chen, 1983).
APT is a more powerful technique than CAPM. APT generalizes the single factor pricing framework to n factors. In other words, one-factor CAPM is a special ( ) case of APT. APT just theoretically proves the existence of benchmark portfolios that are proxies for common risk factors and relates them to the asset returns. However, establishing the benchmark portfolios by factor analysis technique, APT neither tells us about k, the number of
9
common factors, nor states about what the factors ( should be. In spite of having a very strong theoretical background, APT is unlikely to find appropriate proxies for those orthogonal components. There are many empirical studies searching for the possible factors, suggested by APT, and measurable proxies for them to explain asset returns.
2.2 Chen, Roll & Ross (1986) Study of Multi-factor Model
Before 1986, some researchers studied about multifactor asset pricing models and tested the validity of APT such as Roll & Ross (1980), Dhrymes et al. (1984) and Dhrymes et al. (1985). Among these three studies, the first one was performed on very short time period and found out 4 significant factors by using factor analysis for the US markets but could not determine those 4 factors (Roll & Ross, 1980). The other two studies are like an appendix to Roll & Ross (1980) study and concluded that the number of factors depend on the size of the group of securities dealt with. Even though those studies on APT testing were performed earlier, one of the most influential studies on APT is known to be Chen, Roll and Ross’ study in 1986 (abbreviated as CRR). Nai-Fu Chen, Richard Roll and Stephen A. Ross tried to determine the possible measurable factors of APT for the US stock market, in 1953-72 period (Chen, Roll, &
10
Ross, 1986). They intended to examine the relation between macroeconomic variables and returns on stocks.
As mentioned above, if we consider APT as a multi-factor model, it is difficult to find orthogonal benchmark common risk factors. Chen et al. stated that orthogonal factors are some combinations of known variables, called state variables (Chen et al., 1986). In their study, systematic risk was considered only, since unsystematic risk can be diversified, as mentioned above. The theoretical approach was employed and 10 macroeconomic variables were introduced as candidates for being sources of systematic risk. The industrial production variable was taken as the monthly (MP) and yearly (YP) growth rates, which depend on monthly rate of industrial production. Two inflation measures were used. Those are the unexpected inflation (UI) and change in expected inflation (DEI). The unexpected risk premium (UPR), which reflects the unanticipated change in risk aversion, was derived from money markets, which is the difference between low-grade bond returns and long-term government bonds. UTS, the proxy for term structure, was defined as the difference between the returns of long-term and short-long-term government bonds. Equally weighted (EWNY) and value weighted (VWNY) NYSE indices were added to the analysis for testing the role of the market returns. And finally, percentage changes in
11
real consumption (CG) and realized monthly first differences of logarithmic oil prices (OG) were included as the possible factors affecting the stock returns.
Using Chen’s algorithm, which is based on factor loading technique, most important stock factors were extracted from these candidate variables (Chen, 1983). The resulting factor model, based on factor loading, is of the form:
where, the betas are the loadings on the state variables, a is the intercept term, and e is the error term of idiosyncratic form. In order to find the beta coefficients of selected factors and significancy of them, Fama - MacBeth methodology was employed (Fama & MacBeth, 1973).
Basically, CRR study tries to find some “state variables” that can be good proxies for APT factors and empirically documents that the stock returns are statistically significantly correlated with macroeconomic variables. The results showed that industrial production (MP), risk premium (UPR), term structure (UTS) and unexpected inflation (UI) are systematic sources of risk which are significantly priced. In comparison with the state variables, market index has an insignificant effect on pricing. Moreover, change in
12
consumption does not have a significant effect on asset pricing as well as oil price changes.
In the finance literature, CRR (1986) paper became one of the most important articles on multifactor studies. There are many applications and replications of this study in many regions and countries, for both developed and emerging markets, as listed chronologically in the following sections.
2.3 International Evidence from Developed Markets
In order to empirically test the APT in Finland economy, Yli-Olli and Virtanen used monthly stock price data of the Helsinki Stock Exchange, in the 1970-1986 time period (Yli-olli & Virtanen, 1992). By using principal component based factor analysis (to determine the number of factors) and transformation analysis (to make sure that the factors remain stable over different time periods), they found that there are at least three very stable factors; and a fourth factor that is quite stable. However, they failed to determine what these factors are. They tested “own variance” and “firm size” variables and concluded that these factors had poor explanatory power on stock returns.
13
A more convenient study was done to investigate the performance of the APT for the UK markets. An empirical study was performed on London Stock Exchange (Antoniou et al., 1998). The presence of common factors was analyzed in January 1980 – August 1993 time period by dividing the sample into two sub-periods. Money supply, inflation and market excess returns were found to be priced significantly in both sub-periods.
In order to test the effect of macroeconomic factors on asset returns in an APT framework, there is another paper deriving factor realizations from a set of main economic indicators for both German and Turkish markets by using factor analytic techniques (Altay, 2003). This study raises the interest since it compared a developed market and an emerging market. The paper found out 4 factors for the multi-factor structure of the German economy in 1988-2002 period, whereas the Turkish economy yields only 3 factors for 1993-2002 period, even if the same macroeconomic indicators were employed in the factor analysis procedures. According to this study, unexpected interest rate and unexpected inflation are the two factors significantly affecting the asset returns of the German Stock Market. Results for the Turkish Stock Market are discussed in the “Evidence From Turkish Stock Market” section.
14
Shanken and Weinstein (2006) re-examined the CRR asset pricing method for the same market and for the same time period with alternative procedures (Shanken & Weinstein, 2006). They used the full-period post-ranking return approach as used in many recent studies. Similar to CRR study, they found strong evidence of pricing for industrial production growth factor. Contrary to CRR, value weighted market index was found to be priced significantly. Surprisingly, the coefficient of corporate – government bond return spread was found to be insignificant, again contrary to CRR.
A more recent study examined the influence of similar macroeconomic factors on the US and Japan stock markets with cointegration analysis, where the tested factors were industrial production, consumer price index, money supply and long term interest rates for both countries (Humpe & Macmillan, 2007). For the US market, stock prices were found to be positively correlated with industrial production; and negatively correlated with consumer price index and long term interest rate. According to this study, there is an insignificant relationship between US stock prices and the money supply. On the other hand, Japanese stock prices are positively affected by industrial production and negatively affected by the money supply.
15
2.4 International Evidence from Emerging Markets
Gautam Goswami and Sung-Chang Jung (1997) studied the relationship between stock price and 9 macroeconomic variables from Korean economy by using the vector error correction model (VECM). The stock prices of the firms traded on Korean Stock Market were found to be positively correlated with industrial production, short-term interest rate and inflation; and negatively correlated with oil prices and long-term interest rates. It was also found that the foreign exchange rate changes may affect stock prices in either direction.
An important study was performed by Fifield et al. (2002) on many emerging markets with many candidate macroeconomic variables. The study was done essentially for 13 markets, with monthly returns of market indices over the 10-year period 1987–96. Principal component analysis was the main method used in this study. In addition to six domestic macroeconomic variables: inflation, foreign exchange rates, short-term interest rates, gross domestic product, money supply and the trade balance; some global factors from the world information set such as world market return, world inflation, commodity prices, world industrial production, oil prices and US interest rates were selected as independent variables. In many of the emerging markets analyzed, GDP, inflation,
16
money supply, interest rates, world industrial production and world inflation are found to be the common sources of variations in stock returns. It was reported that, while global variables such as world industrial production and world inflation play a crucial role in explaining stock returns in some countries (Greece, Korea, Mexico, Portugal, Singapore and Thailand), local factors are more important in some other markets (India and Turkey).
Another multi-national study was performed by Mahmood and Dinniah (2009) for six Asian-Pacific countries: Malaysia, Korea, Thailand, Hong Kong, Japan, and Australia. Market price indices, foreign exchange rates, consumer price index and industrial production index variables were used as independent variables explaining the variation in stock returns, in 10-year period: 1993-2002. In Japan, Korea, Hong Kong and Australia, long run equilibrium relationships were determined between the stock returns and all the variables listed. It was reported that Thai economy has significant relationship only between industrial production and stock prices, whereas Hong Kong shows interaction only between exchange rate and stock prices.
17
A European emerging economy, Lithuania was also studied in multifactor model framework (Pilinkus & Boguslauskas, 2009). The relationship between the OMX Vilnius index, main Lithuanian stock market index, and macroeconomic variables is studied by using impulse response function technique. Money supply and gross domestic product (GDP) were found to have a positive effect on stock market prices. On the other hand, exchange rate, unemployment rate, and short-term interest rates have negative effect on the stock market prices in Lithuania.
Being a major Latin American country, Argentina is another important emerging economy; and the Argentine stock market index was studied in multifactor model framework by applying the exponential GARCH model in 1998-2011period with quarterly data (Hsing et al., 2012). The findings reported that Argentine stock market index is positively correlated to real GDP, the peso/USD exchange rate, the ratio of money supply to GDP, and the US stock market index. It, however, is negatively influenced by the money market rate, government spending, and the inflation rate. It is important to note that the U.S. stock market index was tested in the Argentine economy, and it was found to be statistically significant in the stock market.
18
Having the second largest population in the world and being one of the BRIC countries, India is becoming more popular among economists. A study has attempted to explore the relationships between BSE SENSEX (Bombay Stock Exchange Sensitive Index, announced by S&P) and four key macroeconomic variables of Indian economy by using Johansen and Juselius’s cointegration test, ADF tests, and Granger causality test (Dasgupta, 2012). By using monthly data in the 2007-2012 period, the effects of wholesale price index, industrial production index, exchange rate and call money rate on BSE SENSEX were analyzed. It was reported that there is at least one cointegration vector between BSE SENSEX with industrial production index and call money rate.
It is very important to refer to the studies performed on China since it is the biggest emerging market with the highest growth rate in the world. Su (2006) proposed a multifactor model on China’s stock market. The study reported that market index is correlated to individual stock returns with a significantly positive beta (Su, 2006). On the other hand, deposit interest rate, inflation rate, money supply, GDP growth rate, saving amount, and loan amount indicated significant negative effect.
19
There are other studies on emerging markets on which we will not give detailed information. For further examples, the study of Zhu (2012) about effect of macroeconomic factors in Shanghai Stock Market (not mentioned detailed since it considers energy sector only), the analysis on Karachi Stock Exchange in Pakistan (Hasan & Nasir, 2008), paper on Colombo all share price index from Sri Lanka can be consulted. The studies about the effect of macroeconomic factors on asset prices, performed on low-income countries such as Ghana, Bangladesh, Nigeria, etc. are not mentioned here due to market efficiency concerns about these countries.
2.5 Evidence from Turkish Stock Market
There is a study about the influence of macroeconomic factors on Turkish stock market (compared with Germany), and it analyzed different time periods for two countries, as mentioned above (Altay, 2003). In the paper, industrial production, inflation (consumer price index), whole sale price index, imports, exports, and foreign exchange rate variables were used for both countries, for the candidate factors of source of variation in stock prices. As mentioned above, some of these factors were found to be significant for Germany but none of them were significant for Turkish stock markets. The author interprets this result according to assumptions of APT: “This result may be due to its [Turkish stock market’s] relatively
20
low market efficiency, low trading volume and low free float” (Altay, 2003). The data period could be another problem, since the 1993-2002 period can be regarded as short for this analysis. Furthermore, this relatively small sample includes two main financial handicaps in Turkey: the 1995 devaluation and the 2001 financial crisis.
Another study was performed on Turkish stock market for 1997-2005 time period by analyzing portfolio returns rather than single stocks (Kandir, 2008). Among all the non-financial firms listed on BIST (Borsa Istanbul), 12 portfolios were constructed by using four criteria: market value, the book-to-market ratio, earnings-to-price equity (P/E ratio) and the leverage ratio. The paper reported that exchange rate, interest rate and world market return are the common macroeconomic factors affecting all of the portfolio returns, whereas industrial production, money supply and oil prices do not seem to affect any portfolio returns significantly. And inflation rate found to have a significant effect for only three of the twelve portfolios. Stationarity and unit roots were tested by “Augmented Dickey-Fuller (ADF) test” and “Phillips-Perron (PP) test”, and the regressions were performed by ordinary least squares (OLS) method in this study.
21
Acikalin et al. (2008) studied the relationships between Borsa Istanbul market index BIST 100 (formerly known as ISE 100) and macro-economic variables of Turkish economy. By applying cointegration tests and VECM on a quarterly data set in 1991-2006 period, it was reported that there is a significant relationship between BIST and four macroeconomic factors: GDP, exchange rate, interest rate, and current account balance. Causality tests were also performed and it was concluded that BIST100 index affects interest rates, contrary to expectations. This unexpected result may be the result of the quarterly data usage.
Pekkaya and Bayramoğlu (2008) focused on relationship between the BIST100 index, YTL/USD exchange rate and S&P 500 index by using Granger causality for the period of 1990-2007. This study neither analyzed the effect of macroeconomic variables on stock returns, nor it was an APT application but it is important to note that a significant relationship was reported between BIST100 and S&P 500 indices. It was reported that S&P 500 index Granger causes the foreign exchange rate and BIST100 index in one direction and is not affected from these variables. This can be interpreted to mean that S&P 500 index can be a good international market proxy for Turkish stock market.
22
Another study aimed to investigate the performance of the APT in Borsa Istanbul (BIST) with monthly data, for 2001-2005 time period (Rjoub et al., 2009). The study tried to replicate CRR paper for Turkish economy. Thus, pre-specified macroeconomic variables were used and a new one was introduced: unemployment. Stock returns were analyzed by forming port-folios, which were constructed according to sectors. By using OLS technique, the authors documented that there is a significant relationship between stock returns and some macroeconomic factors; namely, inflation, term structure of interest rate, risk premium and money supply.
Based on well-known unit root testing procedures, which allow structural breaks in the time series data, an empirical analysis was done on BIST100 index and some macroeconomic variables for the period 1998-2008 (Çağlı et al., 2010). Results showed that GDP, oil prices, and industrial produc-tion are cointegrated with BIST100 index, whereas, inflaproduc-tion was not found to be cointegrated with the market index.
A dissertation submitted to University of Exeter investigated relationship between stock prices (BIST 30 index as the proxy) and macroeconomic factors based on Granger causality concept (Ozbay, 2009). By using monthly stock returns data from Turkey for the 1998-2008 period, it was
23
reported that interest rate, inflation (CPI, consumer price index), GDP and foreign sale Granger cause stock returns, while stock returns do Granger cause money supply, exchange rate, interest rate, inflation (PPI, producer price index) and foreign transactions. No causality was reported between industrial production and BIST 30. The author concluded that “The evidence related to predict macroeconomic factors by using stock returns is somewhat stronger than the evidence related to predict stock returns by applying macroeconomic variables” (Ozbay, 2009).
Another dissertation, submitted to Tilburg University, analyzed the long run (by Johansen’s cointegration technique) and short run (by Granger causality test) relationships between stock prices (BIST100 index as the proxy) and macroeconomic variables in Turkey for the 1988-2012 time period (Karagöz, 2012). It was reported that production index, exchange rate and oil price have long run equilibrium relationship with the market index, BIST100.
The effect of macroeconomic variables on stock returns was studied in another paper by using autoregressive distributed lag (ARDL) method for the 2005-2012 period (Özlen & Ergun, 2012). Stock returns of 45 companies from 11 different sectors were analyzed with the selected macroeconomic
24
variables; namely, inflation, exchange rate, interest rate, current account deficit and unemployment rate. Exchange rate and interest rate were found to be the most significant factors accountable for the stock price fluctuations.
In a very recent study, the relationship between the macroeconomic factors and BIST100 index returns was investigated for the 2002-2012 period (Kaya et al., 2013). Being BIST100 index the dependent variable, the effect of independent variables, i.e. interest rate, money supply, industrial production index and exchange rate was analyzed with OLS method of multiple regression models. It was reported that M2 money supply and exchange rate are the significant sources of the variation in BIST100 index.
The asset pricing literature includes many papers that study the effect of macroeconomic factors, or test APT in Turkish economy, as mentioned above. However, a few of them analyze the individual stocks or portfolios rather than the market index. Those of which did not study only market index data either focus on short periods of data or lack some of the factors that need to be included. These studies mostly suffered from relatively young stock market and lack of some macroeconomic data in the past decades. In the meantime, almost none of these studies have their own
25
model selection procedure. Either they use the models suggested by international literature, or they analyze the some macroeconomic factors intuitionally selected by the authors. In this study, we used a specific model selection procedure that explains the variations in market index returns. Then, we used the selected model to analyze the effect of those macroeconomic variables on Fama-French size and book-to-market portfolios. The details of this process are discussed in the following chapter.
26
CHAPTER 3
MODEL SELECTION
As mentioned in the previous chapter, there are many candidate macro-economic variables that can be responsible for variations in stock returns. If we consider them one by one as single factors, all the variables may have partial effects on the stock returns individually but the aim of this study is to find an appropriate multifactor model that performs better than single factor models. In order to detect the most influential macroeconomic variables on stock returns in Borsa Istanbul, we propose a model selection algorithm based on the model selection criteria AIC and LASSO. This chapter introduces the model selection procedure we used in this study and demonstrates the statistical power of our technique.
27 3.1 Model Selection Criteria
For n observations and p independent variables, the most common form of a regression equation can be given by:
where, Y is the dependent variable of n dimensional vector, β is p dimensional vector containing all regression coefficients, X is n by p matrix of independent variables and ε is n dimensional vector of normal noise terms. According to common notation, X matrix can be divided into two subsets such that where, is the set of active terms and is the set of inactive terms that are not relevant to regression problem (Weisberg, 2005).
Model selection criteria deal with how to divide X matrix and bring out active terms , which consist of the most reasonable variables to explain the variation in Y. There are subset selection methods to detect , such as stagewise regression, all-subsets regression, leaps-and-bounds regression and stepwise regression. Among these options, the most common one is stepwise regression. For the details of other three methods, Miller (2002) can be consulted. Stepwise regression method can be applied in two ways; forward stepwise selection and backward stepwise elimination methods
28
(Miller, 2002). The former one considers all candidate variables individual-ly in the first step and selects one of them according to a model selection criterion. In the remaining steps, the same procedure is repeated with the remaining subset. The procedure stops when the model selection criterion reaches the optimum value, maximum or minimum depending on the criterion. The later one, backward stepwise elimination method, regresses all available variables in the first step and eliminates the worst performing variable from the model. As seen from the descriptions, both methods need some selection criteria in order to select or eliminate the variable at each step.
In statistics literature, there are several model selection criteria for choosing the best model out of all candidate models of different combinations of candidate variables. Most common ones are Akaike Information Criterion (AIC) and Bayesian Information Criterion (BIC). The general form of AIC is given by
where, k is the number of independently adjusted parameters within the model and L is the maximized value of the likelihood function for the model (Akaike, 1974). For multiple regression models, AIC value was formulized as follows
29
( ) where, n is observation number, RSS is residual sum of squares and p is number of independent variables (Sakamoto et al., 1986). Similarly, the general form of Bayesian Information Criterion (BIC) is given by
and formulized for multiple regression models, for the same notation as AIC, as follows:
( ) (Schwarz, 1978). As seen from the equations (7) and (9), both AIC and BIC increase as RSS increases, meaning that lower values of them are preferable. For low values of p and relatively large values of n, it can be expected that both AIC and BIC give similar results. The only difference is, BIC penalizes additional parameters more strongly, which makes AIC more useful in our cases since it is more tolerant.
There are alternative methods for model selection such as LASSO (Tibshirani, 1996). LASSO is the abbreviation for least absolute shrinkage and
selection operator and it is very similar to ridge regression. These two
methods are classified as shrinkage methods since they penalize the unimportant variables and “shrink” their coefficient estimates. In order to
30
understand LASSO, it is crucially important to mention ridge regression, firstly. Ridge regression shrinks the regression coefficients by imposing a penalty on their size. The ridge coefficients minimize a penalized residual sum of squares. This optimization problem can be written as
̂ { ∑ ( ∑ ) ∑ }
where is a complexity parameter controlling the amount of shrinkage: the larger the value of λ, the greater the amount of shrinkage (Hastie et al., 2008). In matrix notation, this equation can be written as ̂ ( ) where is identity matrix. Indeed, ridge regression is not a model selection criterion but it reduces the impact of insignificant coefficients and penalize them. As the penalty increases, all parameters are reduced while still remaining non-zero. Similarly, LASSO coefficient can be defined as ̂ { ∑ ( ∑ ) ∑| | }
Contrary to ridge regression, however, LASSO allows the penalty to increase, so that more of the coefficients can be set to zero. As a result, LASSO can be implemented as a model selection criterion, as done in this
31
study. Note that ridge penalty term ∑ is replaced by the lasso
penalty term ∑ | | , which makes the solutions nonlinear. Computing the lasso solution is a quadratic programming problem and this was solved by “R”, an open software special for statistical studies, by loading the required package lars (Team, 2013).
There are many studies about other techniques and algorithms related to model selection. For example, Efron et al. (2004) suggest an algorithm called LARS, least angle regression, which is very effective for very high dimensional data, especially when the number of independent variables is significantly greater than the number of observations, i.e. . LARS can be easily modified to produce solutions for LASSO. There are even more recent studies concerning ultra-high dimensional data sets, such as
the elastic net, that encourages a grouping effect, where strongly correlated
predictors tend to be in or out of the model together (Zou & Hastie, 2005) and sure independent screening, which is based on correlation learning, to reduce p from high to a moderate scale that is below the sample size, n (Fan & Lv, 2008). Since is not the case in this study, we will not go in detail about these studies. For the purposes of this study we used AIC and LASSO.
32 3.2 Comparison Criterion
The main comparison criterion used in this study is cross validation, which is based on averaging the prediction error. Cross validation technique can be used for estimating how accurately a predictive model performs in practice, so that, comparing the performance of two or more predicted model. The data is partitioned into complementary subsets; training set and validating set. Training set is the subset analysis performed on, and validating set is the subset in which the analysis tested. In k-fold cross
validation, the general form of the cross validation technique, the original
sample data is divided into k equal sub-samples. One of the sub-samples is hold as the validation and the remaining sub-samples are used as training set. For a given set of independent variables from the whole X set, regression equation is estimated and fitted according to training set and then the estimated model is tested on the validating set. The prediction error of this validation is calculated. Each k sub-samples is used as the validating set in turn, so that the procedure is repeated k times. The resulted prediction errors of k folds [repeating times] are averaged to get the cross validation error.
Leave-one-out cross validation is a special case of k-fold cross validation,
33
As the name suggests, only one observation becomes the validation set and the rest of the observations become the training set. So, each observation is tested with the largest available set, which is the whole sample except itself. That is to say, for a given model from all the available models, one observation is chosen as the validation set, and the regression equation is estimated according to remaining observa-tions. This estimate is tested on the validation set (single observation in this case), and the difference between this estimate and the single observation reveals the prediction error for the given validation set. This procedure is repeated n times so that every single observation is chosen as the validation set. At the end, total n prediction error measures, one from each observation’s validation, are computed and averaged to get the leave-one-out cross validation error for the given model. This process can be applied to two or more candidate models to compare the performances of them and select the most reliable one. The model that produces minimum leave-one-out cross validation error can be selected.
In order to find the best model among a number of candidate variables, a model selection method should be implemented for selecting the most reliable variables rather than regressing all the candidates; because adding unnecessary explanatory variables to the regression analysis can have
34
serious side-effects such as multicollinearity. As mentioned in this chapter, there are model selection methods for such model selection problems when the number of parameters is large. We employed forward stepwise selection method by using two common model selection criteria: AIC and LASSO. In order to compare the statistical performances of these two models, we used a comparison criterion, cross validation error leave-one-out approach. By taking the advantage of our model selection technique, we are able to consider as many candidate variables as we can because the variables that have low explanatory powers or statistically insignificant ones are eliminated by the algorithm. Once the best model is constructed among many candidate models, one can easily perform the analyses on individual stocks or portfolios. The details of the our model selection procedure and the algorithm are mentioned in the next chapter.
35
CHAPTER 4
DATA AND METHODOLOGY
This study investigates the effects of macroeconomic variables on monthly returns of stocks trading in the Borsa Istanbul, formerly known as Istanbul Stock Exchange. The data used in this study spans the period from January 1998 to December 2011. This time interval can be regarded as a relatively short period because the stock market under analysis is young. Istanbul Stock Exchange was established in January 1986, and the market index had different number of firms until January 1995. In 1995, the number of firms listed in market index was fixed to 100 under the name of ISE 100 (İMKB 100, in Turkish) index. Later in 2013, the exchange market was renamed as Borsa Istanbul and the index name was updated as BIST 100. Since it is difficult to find sufficient number of firms and most of the variables are not available for the earlier periods, 1998-2011 was chosen as
36
the sample period without any missing or extrapolated observations. The data sources are Datastream and Bloomberg, as well as web pages of Borsa Istanbul and Central Bank of Turkey.
Based on the literature and economic intuition, some macroeconomic variables from both domestic and global markets were chosen as the candidate factors that might affect the stock returns. These factors are BIST 100 index return, one month lagged series of BIST 100, realized volatility of BIST 100, price-to-earnings ratio, change in total traded volume, S&P 500 index return, monthly inflation, change in foreign trade balance, industrial production index growth, crude oil prices, gold prices, foreign exchange rate and interest rate on short term government bonds. For all variables, monthly series were used and end-of-month values taken into account. Brief explanations and the glossary of these variables are given in Table 1. The detailed information and literature behind them are discussed in the next section.
37
TABLE 1: Glossary and Descriptive Statistics of the Candidate Variables
Symbol Variable Mean Std. Dev. Explanation
bist100 BIST100 Index Return 0.0256 0.1433 monthly return, not logarithmic
lag1 1 Month Lagged Series of bist100 0.0271 0.1438 BIST100 Return of the month before
real_vol Realized Volatility of BIST 100 0.1128 0.0595 calculated based on daily data
P/E Price-to-earnings Ratio 32.9859 91.4241 source: Borsa Istanbul
volume_ch Change in Total Traded Volume -0.0374 0.3546 monthly change, not logarithmic
s&p500 s&p500 Index Return 0.0027 0.0478 monthly return, not logarithmic
mont_inf Monthly Inflation (%) 1.7846 1.8975 monthly change in consumer price index
trd_blnc_ch Change in Foreign Trade Balance 0.0260 0.8841 difference between export and import ipi_gr Industrial Production Index Growth 0.0063 0.0812 monthly growth, not seasonally adjusted
oil_pr Crude Oil Prices 0.0291 0.1047 Change in oil prices in TL currency
gold_pr Gold Prices 0.0257 0.0670 Change in gold price in TL currency
fx_rate Foreign Exchange Rate 0.0147 0.0552 Change in USD/TL ratio
int_rate Interest Rate on Short Term Government Bonds 0.0274 0.0212 monthly rate converted from annual rate Note: Brief explanations and the glossary of these variables: The first column is the symbols of the variables, the second column is the names of the variables, the third and fourth columns are means and standard deviations of the variables respectively, brief explanations about the variables are given in the last column.
38 4.1 Description of Data
The data set consists of three groups of variables. The first group consists of domestic financial variables based on BIST 100 index or index related variables. The second group also consists of domestic factors, based on macroeconomic variables. The last group consists of internationally deter-mined financial or macroeconomic variables. Throughout the paper, monthly returns (or changes) in the variables were calculated as:
where, is the series imposed into regressions as independent variables, which is monthly return (or change) in and the is the original value of the variable in the given month.
4.1.1 Domestic Financial Variables
BIST 100 Index Return, symbolized as bist100, is the monthly normal return on BIST 100 index; using equation (13) it is calculated as:
where, is BIST 100 index price at time t. Logarithmic returns were not used because of highly volatile structure of the returns in Turkish market. If the log-returns were used, the effect of high fluctuations would be smoothed, which can mean information loss in some cases.
39
One period lag return on BIST 100 index was also taken as a candidate variable due to possible synchronous trending. In case of any non-synchronous trending, the effect of this trend should be captured by variable, which was constructed as .
Realized Volatility of BIST 100, indicated as RealVol, was calculated using daily data of index returns. Realized volatility of a particular day is constructed by computing the standard deviation of past 22 days of the given day. Among these daily volatility data, end-of-month values are pulled out to determine the data point of the given month. Mathematically, realized volatility is calculated as:
√ ̂ where, ̂ is the standard deviation of the daily BIST 100 returns sample covering the days between t and t-22. The constant value of 22 represents the number of trading days in a typical month. Due to some extraordinary holiday schedules of Turkey, the actual number of trading days in any particular month may be slightly higher or lower than 22. However, it is preferred to have one approximate constant than having a variety of exact values.
40
Price-to-earnings Ratio (P/E) is the ratio of the price of a stock in a given time to the net earnings of the firm in the last fiscal year. Investors can use P/E ratios of different stocks in order to compare the value of them. This variable was put to the analyses as a proxy to see the effect of investors’ preferences about trading a stock. Dividend yield can be another proxy for serving a similar purpose, but use of dividend yield is problematic for Turkish stock market. In Borsa Istanbul, dividend yield of a certain data is calculated as follows: last dividend payment divided by the price of the stock on the given day. Since Turkish firms hardly pay dividends regularly, this data becomes misleading. This fact canalizes the investors to speculative investments, rather than holding the asset for its future cash flow, dividend payments.
Having the symbol “volume_ch”, Change in Total Traded Volume is, as the name suggests, the change in monthly total traded volume of BIST 100 index. It was calculated according to equation (13); logarithmic differences were not used for the same purpose. Change in volume might signal about changes in the market or change in information arrival rate.
41
4.1.2 Domestic Macroeconomic Variables
Inflation is regarded as another candidate for variation stock returns by many authors, as discussed in the 2nd chapter. As an initial step, CRR
study found a significant relationship between unanticipated inflation and stock returns. Many studies (for example, Goswami & Jung (1997), Antoniou et al. (1998), Fifield et al. (2002), Hsing et al. (2012)) in different markets supported the result of CRR. Since there was no inflation targeting policy in Turkey until 2006, the studies on Turkish stock markets concerned only about observed values of inflation; Kandir (2008), Ozbay (2009) and Rjoub et al. (2009) found siginificant impact of inflation on the Turkish stock market in their sample period. We, also, took inflation into account and used monthly percentage changes in consumer price index, symbolized as “mont_inf”, as the proxy of monthly inflation.
Fifield et al. (2002) and Acikalin et al. (2008) analyzed the effect of current account balance and foreign trade balance in their studies and could not find any significant relationship. Foreign trade balance is an important macroeconomic factor for Turkey since it is one of the biggest fragilities of Turkish economy according to some credit rating agencies. For that reason, it is beneficial to take this factor into account in the analyses of this study. Firstly the difference between monthly export and import was
42
calculated to find the monthly foreign trade balance of Turkey, then the monthly change of this series was calculated according to equation (13) to construct the variable “trd_blnc_ch”.
Industrial production index is another economic indicator since it directly relates the real production level and industrial firms. It was started to be analyzed with CRR study, and most of the proceeding APT tests or multifactor pricing studies checked the efectiveness of this variable. For example, Shanken & Weinstein (2006), Humpe & Mac-millan (2007), Goswami & Jung (1997), Fifield et al. (2002), Mahmood & Dinniah (2009) and Dasgupta (2012) reported significant relations between industrial production and stock prices from both developed and emerging markets. Çağlı et al. (2010) reported a significant effect of industrial production from Turkey. In this study, industrial production index was analyzed by converting the series to monthly growth rate (ipi_gr) with the same method as equation (13).
Interest rate on short term government bonds is a crucially important indicator about the return on any kind of asset. It keeps its importance since the very first asset pricing model, CAPM. Turkish Government did not export bond in every maturity in every month. This limitation urged
43
us to use 1-month, 3-months and 6-months maturity bonds for different data points. Interest rates on all of these bonds were converted to monthly interest rates to construct the variable “int_rate”.
4.1.3 Global Variables
S&P 500 index, introduced as s&p500 to the software in this study, is one of the most common and well-known stock market indices in the world. The 500 firms to be included are determined by Standard & Poor's. The index is based on the prices of leading 500 companies’ stocks traded in the U.S. stock exchange markets NYSE and NASDAQ. In most of the studies performed on the U.S. markets, S&P 500 is taken as the proxy for market portfolio. So, S&P 500 index can be regarded as the locomotive force for the global financial markets. Fifield et al. (2002) and Kandir (2008) studied the effect of world market return on stock prices, and Kandir (2008) reported that world market return is effective on Turkish stock markets. Pekkaya & Bayramoğlu (2008) found a Granger causality between S&P 500 index and Turkish stock market. Furthermore, Hsing et al. (2012) analyzed the effect of U.S. market index on Argentine stock market as mentioned above. In our study, S&P 500 was used to analyze the global markets’ effect on stock price variations in Borsa Istanbul. The series s&p500 was
44
constructed with the same method as equation (13) rather than using log – returns to be consistent with rest of the data.
The foreign exchange rate is a crucial variable that may affect foreign trade, inflation, as well as cost of many products. This factor was added to analysis of many studies especially performed on emerging markets, and some of them such as Goswami & Jung (1997), Mahmood & Dinniah (2009), Pilinkus & Boguslauskas (2009) and Hsing et al. (2012) reported significant results about the effect of foreign exchange rate on stock prices. From Turkish stock market, Kandir (2008), Acikalin et al. (2008), Pekkaya & Bayramoğlu (2008), Ozbay (2009), Karagöz (2012), Özlen & Ergun (2012) and Kaya et al. (2013) studies presented significant results about this variable. In this study, foreign exchange rate (with the symbol fx_rate) was analyzed as the monthly percentage change in USD/TL exchange rate and calculated according to equation (13).
Gold price is another global variable that can be effective on stock prices since it is the most common comodity for investment. Even though it is not very common to add gold prices to multifactor pricing studies, this was analyzed by many authors for example, Bhunia & Mukhuti (2013), Ray (2013), Shahzadi & Chohan (2011) and Omag (2012) in univariate
45
context especially in emerging markets; and some significant results were reported in these papers. In this study, gold price (with the symbol gold_pr) was analyzed by converting the prices into Turkish Liras since the effect of USD currency on stock price would be captured by fx_rate variable. If we let the gold price varying with USD currency, gold_pr and fx_rate variables would create multicollinearity problem. Gold prices were also analyzed in a montly return context according to equation (13).
Being one of the most important sources of energy, and being a row material for many sectors, oil is a crucial factor in economics and it might affect the cost of many products directly. Thus, effect of oil prices on stock returns was firstly analyzed in CRR study, which could not report a significant relationship. Following this study, many authors analyzed the effect of oil prices on stock prices, as mentioned in literature review section. Most of them could not find significant results as in CRR paper but there are some studies, such as Karagöz (2012) and Çağlı et al. (2010) reporting significant effects of oil price in their sample period. This study analyzes oil price, with the symbol oil_pr, in a montly return context according to equation (13). Due to the same concern in gold price case, “oil_pr” was also analyzed by converting the prices into Turkish Liras.
46
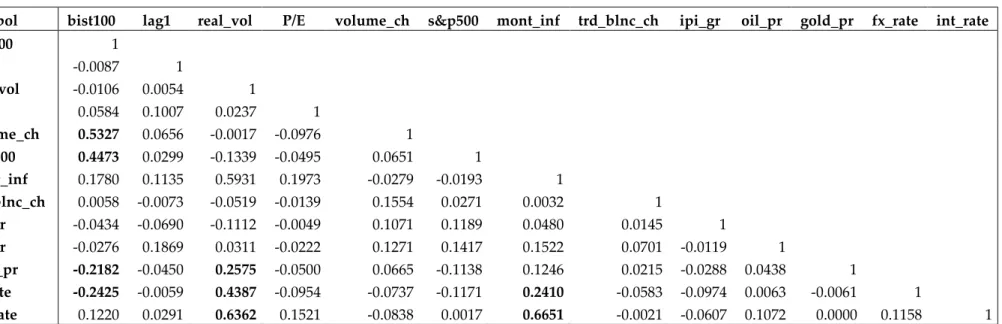
TABLE 2: Correlation Matrix
Symbol bist100 lag1 real_vol P/E volume_ch s&p500 mont_inf trd_blnc_ch ipi_gr oil_pr gold_pr fx_rate int_rate bist100 1 lag1 -0.0087 1 real_vol -0.0106 0.0054 1 P/E 0.0584 0.1007 0.0237 1 volume_ch 0.5327 0.0656 -0.0017 -0.0976 1 s&p500 0.4473 0.0299 -0.1339 -0.0495 0.0651 1 mont_inf 0.1780 0.1135 0.5931 0.1973 -0.0279 -0.0193 1 trd_blnc_ch 0.0058 -0.0073 -0.0519 -0.0139 0.1554 0.0271 0.0032 1 ipi_gr -0.0434 -0.0690 -0.1112 -0.0049 0.1071 0.1189 0.0480 0.0145 1 oil_pr -0.0276 0.1869 0.0311 -0.0222 0.1271 0.1417 0.1522 0.0701 -0.0119 1 gold_pr -0.2182 -0.0450 0.2575 -0.0500 0.0665 -0.1138 0.1246 0.0215 -0.0288 0.0438 1 fx_rate -0.2425 -0.0059 0.4387 -0.0954 -0.0737 -0.1171 0.2410 -0.0583 -0.0974 0.0063 -0.0061 1 int_rate 0.1220 0.0291 0.6362 0.1521 -0.0838 0.0017 0.6651 -0.0021 -0.0607 0.1072 0.0000 0.1158 1 Note: Given is the correlation matrix of the whole data set. The variables are given in the first row and first column with their symbols. High correlations among independent variables may cause multicollinearity problem, if they are selected to the best model. The correlations greater than 0.2 are written in bold.
47 4.2 Portfolio Formation
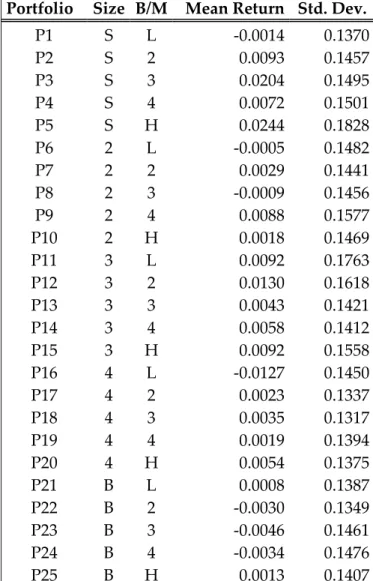
In order to analyze the effect of selected variables on stock returns, 25 portfolios were constructed according to Fama & French (1992) size and book-to-market portfolios by using two criteria: market value and the book-to-market ratio. The sample of 25 portfolios consisting of Turkish firms’ stocks traded in Borsa Istanbul was taken from a master’s thesis submitted to Bilkent University Management Department (Yayvak, 2013). The financial companies such as banks, holding companies, investment trusts and insurance companies are excluded from the sample. This is a caution to prevent the negative effect of high leverage capital structure of these firms on our analysis.
All the companies fulfilling the criteria mentioned above were first sorted with respect to their market capitalization at the end of June for each year. These sorted stocks were classified in 5 groups. First group consists of smallest (S), and the 5th group consists of biggest (B) firms. Then, each group divided into 5 groups according to book-to-market values, sorted from lowest (L) to highest (H) book-to-market value.
As a result, 25 portfolios were constructed such that the first one consists of the smallest firms with the lowest book-to-market values and the 25th