FEMALE LABOR FORCE IN THE NEXUS OF PREMATURE DEINDUSTRIALIZATION AND AUTOMATION
A Master’s Thesis
by GÜL YÜCEL
Department of Economics İhsan Doğramacı Bilkent University
Ankara November 2018
FEMALE LABOR FORCE IN THE NEXUS OF PREMATURE DEINDUSTRIALIZATION AND AUTOMATION
The Graduate School of Economics and Social Sciences of
İhsan Doğramacı Bilkent University
by
GÜL YÜCEL
In Partial Fulfilment of the Requirements for the Degree of MASTER OF ARTS IN ECONOMICS
THE DEPARTMENT OF ECONOMICS İHSAN DOĞRAMACI BİLKENT UNIVERSITY
ANKARA November 2018
ABSTRACT
FEMALE LABOR FORCE IN THE NEXUS OF PREMATURE DEINDUSTRIALIZATION AND AUTOMATION
Yücel, Gül
M.A., Department of Economics Supervisor: Prof. Dr. Alp Erinç Yeldan
November 2018
In this study, the effects of automation trends on the occupation groups are studied. Routine task index of occupations in Turkey are calculated and fe-male labor force participation as well as fefe-male to fe-male ratios in these occupa-tions are analyzed. Further, the ability of Turkish female workers in adapting themselves to changing nature of occupations is explored by summary statis-tics from PIAAC survey results. We find that the occupation groups that are susceptible to automation are occupied by female workers.
Keywords: Automation, Premature Deindustrialization, Routine Intensity In-dex
ÖZET
SANAYİSİZLEŞME VE OTOMASYON BAĞLAMINDA KADIN İŞGÜCÜ
Yücel, Gül
Yüksek Lisans, İktisat Bölümü Tez Danışmanı: Prof. Dr. Alp Erinç Yeldan
Kasım 2018
Bu çalışmada otomasyon trendinin meslek grupları üzerindeki etkileri incelen-mektedir. Çalışma kapsamında Türkiye’deki meslek gruplarının rutin görev endeksleri hesaplanmış ve bu mesleklerdeki kadın işgücü katılım oranları ile kadın-erkek işgücü oranları analiz edilmiştir. Ayrıca Türk kadın işçilerin mes-leklerin değişen yapılarına hangi ölçüde uyum sağlayabildiği PIAAC anket sonuçları üzerinden araştırılmaktadır. Çalışmanın sonucuna göre otomasyona yüksek düzeyde elverişli olan meslekler aynı zamanda yoğunlukla kadın işgücü istihdam eden meslekler olarak karşımıza çıkmaktadır.
ACKNOWLEDGMENTS
First of all, I would like to thank Alp Erinç Yeldan for his endless support and exceptional supervision. He taught me how to see the big picture behind the numbers and connect them to reality. He inspires me not only as an economist but also as a human being and as a father. I feel honored to be colleagues with him. I also would like to express my gratitude to Çağla Ökten as the second reader of my thesis for her comments.
I am forever indebted to Mine Kara, Bahar Sağlam and Hüseyin Çağrı Sağlam for allocating their time on my thesis and commenting on it. Their support made it easier for me to express my ideas more clearly.
Also, I would like to thank Refet Soykan Gürkaynak, Hakan Berument, Fatma Taşkın and Mustafa Eray Yücel for supporting me when I needed the most. They believed in me from the very beginning until the very end.
My biggest achievement in this program was the friends made: Gizem, Dilara, Asu, Arda, Orhun, Gökberk, Begüm, Ebru, Hanifi, Fatih and Furkan. I will never forget the memories I had with you.
I also would like to thank Elif, Ece, Zeynep, Ekin, Oğulcan, Berktay, Doğa, Umut, Berkay, Arda, Ali, Yalın, Ata Alp, Ayberk, Berken, Mert Can and Oğuz Cem for being there for me. They are best friends that one can ask for.
Lastly, I would like to thank my family for all the sacrifices they made to raise me. I feel extremely lucky to have sisters like Merve and Güliz. Their love has made the difference.
TABLE OF CONTENTS
ABSTRACT . . . iii
ÖZET . . . iv
ACKNOWLEDGEMENTS . . . v
TABLE OF CONTENTS . . . vi
LIST OF TABLES . . . vii
LIST OF FIGURES . . . viii
CHAPTER 1: INTRODUCTION & LITERATURE REVIEW . . . 1
CHAPTER 2: GLANCE AT FEMALE LABOR FORCE IN THE CON-TEXT OF AUTOMATION AND DEINDUSTRIALIZA-TION . . . 6
2.1 Female Labor Force in Turkey . . . 6
2.2 The Linkage From Deindustrialization to Automation . . . 9
2.3 Overview of Automation Trends in the World . . . 12
2.4 Routine Component of Tasks . . . 16
CHAPTER 3: THE APPLICATION OF ROUTINE COMPONENT METHODOLOGY TO TURKISH PIAAC DATA . . . 18
3.1 Data & Methodology . . . 18
3.2 Routine Component of Occupations in Turkey . . . 21
3.3 Are Female Workers Prepared for ICT and Automation Trends? . 23 CHAPTER 4: Conclusion . . . 29
LIST OF TABLES
1 Automation Potentials of Job Groups . . . 32 2 Median annual wages and the probabilities of computerisation . . 33 3 Median annual wages and the probabilities of
computerisa-tion,continued . . . 34 4 Top ten occupations with the highest degree of automation . . . . 35 5 Top ten occupations with the highest degree of
automa-tion,(continued) . . . 36 6 Female-to-male ratios of job categories in USA,20 years and older 38 7 Occupations with the least Contact with others index . . . 39 8 Summary of principal component analysis . . . 40 9 Routine Intensity Index of Occupations in Turkey . . . 41 10 Routine Intensity Index of Occupations in Turkey, (continued) . . 42 11 Routine Intensity Index of Occupations in Turkey,(continued) . . 43 12 Female-to-male ratios of major occupation groups in Turkey . . . 44
LIST OF FIGURES
1. Female Labor Force Participation Rate (as a percentage of
fe-male population ages +15 . . . 7 2. Female Labor Force Participation Rates for Selected Countries,
2017 . . . 7 3. Female Employment Rate by Sectors,Turkey, 1988-2016 . . . 8 4. Female Employment Rate by Sectors, 1991-2017 . . . 8 5. Gross Value Added Per Hour Worked (Annual growth/change) ,
USA and EU countries, constant prices, annual growth/change . . 10 6. Gross Value Added Per Hour Worked, Total Economy, constant
prices, annual growth/change, services and manufacturing . . . . 10 7. Gross Value Added Per Hour Worked Index, EU area,
Manufac-turing and Services, constant prices . . . 11 8. Labor and capital productivity in manufacturing sector, US . . . 11 9. R&D intensity of manufacturing sector . . . 23 10. The percentage of 16-65 year-olds scoring at Level 2 or 3 in
problem solving in technology-rich environments . . . 25 11. Difference of percentage of women and men who has no
experi-ence of computer usage or failed ICT core test . . . 26 12. Summary of Responses to the question GQ03b: In your last job,
how often did you usually calculate prices,costs and budget? . . . 26 13. Summary of responses to question GQ04: Did you use a
com-puter in your last job? . . . 27 14. Summary of responses to question GQ06: What level of
15. Summary of responses to question GQ08: Has a lack of com-puter skills affected your chances of being hired for a job or
get-ting a promotion or pay raise? . . . 28 16. Business expenditure on R&D for selected countries, 2005-2015
total economy, million euros . . . 28 17. Number of installed industrial robots per 10000 employees in the
manufacturing industry in 2016 . . . 37 18. Number of installed industrial robots per 10000 employees in the
CHAPTER 1
INTRODUCTION & LITERATURE REVIEW
Globalization has been visible through liberalization of international com-modity trade and the expansion of FDI and cross-border capital and financial flows (World Commission, 2004). Global exports as a share of total output has increased by 20 percentage points since 1970’s. The average tariff rates have declined from 7% in 1980 to roughly 3% in 2014 for developed economies and from 22% in 1980 to approximately 6% in 2014 for the developing economies (United Nations Conference on Trade and Development, 2016). The world economy is becoming more integrated and the international trade, in return, is expanding.
The decline in communication and transportation services coupled with trade liberalization policies have led to a new international division of labor in which “South” has specialized in labor-intensive manufacturing activities whereas industrialized “North” has experienced a shift from manufacturing ac-tivities to knowledge-intensive service sectors . Some authors have suggested that the ongoing trends of the North-South trade had, in fact, caused income inequalities and uneven development across countries (Krugman & Venables, 1995: Slaughter, 2001); while others suggest that trade liberalization will result in the convergence of per capita incomes across countries (Dowrick & Nguyen, 1989)
The increasing integration of the South with the global economy is pointed out to be one of the main reasons for the decline in the manufactur-ing employment in the developed economies, namely the “deindustrialization” (Saeger, 1997). The term deindustrialization mainly refers to the declining share of in manufacturing value added in GDP as well as the decreasing rates of employment in manufacturing sector when countries achieve a certain level of income per capita (Palma, 2000). For instance, data reveal that the share of manufacturing employment has decreased from 28% in 1970 to 18% in 1994 and among the industrialized economies. United States is among the countries that have experienced deindustrialization in the most severe way with its share of manufacturing falling from 28% to 16% over the period of 1965-1994 (Ra-maswamy & Rowthorn, 1997). Lawrence & Edwards (2013) explain the declin-ing trend in employment in manufacturdeclin-ing with 3 main factors: (1) the rela-tively more rapid productivity growth in manufacturing processes compared to the services sector, (2) relative decline in the demand for goods compared to the demand for services, therefore the decline in the value of spending on goods relative to services, (3) the expansion in the volume of international trade as a result of global integration and specialization.
Initially, the concept of deindustrialization had been associated with ma-ture industrialized developed economies, however, lately there has been a grow-ing body of literature on the “premature deindustrialization” that has been observed particularly in developing economies. Premature deindustrialization refers to the decline of manufacturing value added and the employment share of manufacturing at per capita income levels that are way lower compared to the levels at which the advanced countries had started to de-industrialize (Dasgupta & Singh, 2006: Rodrik, 2016: Greenstein & Anderson, 2017). For in-stance, the GDP per capita level at which United States, as an advanced econ-omy, started to deindustrialize is around $14,765; whereas the same number
is only $602 for India, $4,447 for Brazil and $6,634 for Mexico (Rodrik, 2016). Interestingly, manufacturing sector in the developing economies is experienc-ing “jobless growth”, a term coined to describe the phenomenon in which the employment in manufacturing sector is declining with positive growth rates in output (Bhalotra, 1998: Tejani, 2016)
The literature on women’s participation in the labor force has stressed the effect of globalization processes. In particular, Standing (1999) had sug-gested that labor force has actually been experiencing “feminization”. The structural adjustments of the labor markets to the globalization forces and the supply-side macroeconomics are considered as the reasons for the “femi-nization” process. Standing (1999) explains the labor flexibility by the ongoing international division of labor. As the developing countries industrialize, “la-bor rights in industrialized countries become increasingly perceived as costs of production to be avoided in the interest of enhancing or maintaining national competitiveness.” Hence, the international division of labor has given incentives for firms to allocate their production where labor costs are lower, in particular less-developed countries. The goal of cost-minimizing, particularly of costs of labor, has motivated the transnational global corporations to search for work-ers who are willing to work for low wages. As a result, the demand for contract labor, outsourcing and home-working has increased. The labor market flex-ibility in its essence would mean the increase in the “informalization” of the labor force and women are reported to be more suitable for low-wage informal occupations. In fact in South Asia 95% of women in employment work in the informal economy. The same ratio is 89% for Sub-Saharan and 59% for Latin America and the Caribbean countries (UN Women, 2016). From this point of view, “feminization” of the labor force is inevitable.
However, there have been studies that suggest that feminization of the labor is likely to be reversed as the export activities are deepened and
diver-sified along with the development of the economy (Joekes, 1995). The under-lying idea is that the feminization of the labor force is most strongly evident in the labor intensive manufacturing production. However, as the deindustri-alization process kicks in the industrialized and the developing countries and as the industrial production becomes more capital-intensive, the female labor force would be more affected by the decline in manufacturing employment com-pared to male workers. In fact, Greenstein & Anderson (2017) find that the “premature deindustrialization is likely to amplify the male bias of the indus-trial upgrading.” In addition, Tejani & Milberg (2016) suggest that the capital intensity of production is a significant explanatory variable for the “defeminiza-tion” trend in the labor force, whereas export growth is a statistically insignif-icant factor in terms of explaining the shift in the female labor employment in the manufacturing sector.
As the advanced economies adopt automation technologies across manu-facturing, the production of labor intensive industries might be re-shored due to declining costs of production enabled by productivity gains from automa-tion. Therefore developing economies might lose out on their manufacturing exports-led growth strategies and hence workers in labor-intensive manufactur-ing, female workers in particular, might be driven out of the labor force. From this perspective, it is of crucial importance to analyze automation and trends of robotics in advanced economies as well as the extent to which the developing countries are able to catch up with the latest technologies. Further, the gen-der implications of robotics would provide in which ways jobs of female workers both in advanced and developing economies are likely to transform, enabling the researchers to forecast the future path of female employment.
The sections of this study are as follows. Chapter 2 analyzes descriptive data on Turkish female labor force, links the concept of deindustrialization to automation and introduces the routine task component of occupations.
Chap-ter 3 introduces a new methodology for the assessment of routine intensity in-dexes across occupation groups in Turkey and combines the results with the female-to-male ratios of occupational groups.
CHAPTER 2
GLANCE AT FEMALE LABOR FORCE IN THE
CONTEXT OF AUTOMATION AND
DEINDUSTRIALIZATION
2.1 Female Labor Force in Turkey
In order to study how female employment in Turkey is shaped by prema-ture deindustrialization and automation trends, first we need to look at cur-rent trends in female labor force. The female labor force participation rate in Turkey has experienced a declining trend until 2007. Female labor force was around 34% of the female working age population in 1990, steadily decreased to almost 23% in 2009 and gradually went back to 35% until 2017 (Figure 1). Despite these improvements, however, Turkey’s female labor force participa-tion is very much below other countries: 8 percent below the average of middle income countries and a striking 20 percent below the OECD average(Figure 2).
The gender implications of premature deindustrialization become very clear when the female employment is disaggregated into the broad sectors. The female employment has been mostly stagnant in construction. There has been a slight increase, around 5%, in the female employment rate. Strikingly, how-ever, female employment has decreased substantially in agriculture, starting from 76% in 1988 to 28% in 2016. Services sector seem to absorb the female
Figure 1: Female Labor Force Participation Rate (as a percentage of female population ages +15
Source: World Bank
Figure 2: Female Labor Force Participation Rates for Selected Countries, 2017
Source:World Bank
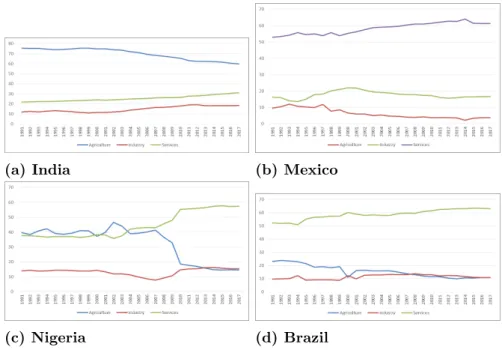
workers leaving the agriculture sector, showing a total increase of almost 40% (Figure 3). Although the shift of female workforce from agriculture to services sector might seem peculiar to Turkey, it is actually a common phenomenon among other developing economies. For instance, in India, following 15% de-crease in agriculture, female employment rate in services has inde-creased by 10% whereas in industry it increased by 6% (Figure 4). Furthermore in Mexico, fe-male employment in industry has been almost stagnant whereas services sector has experienced a 10% increase in female employment rate. Brazil follows a similar pattern as well with its female employment in services sector growing faster than that in industry. Among these selected countries however, Nigeria is the one that resembles Turkish female employment trends the most. Female
employment in agriculture decreased steadily and almost all of female work-ers are absorbed by the services sector. The shifts among the two sectors are almost symmetrical.
Figure 3: Female Employment Rate by Sectors,Turkey, 1988-2016
Source: Turkish Statistical Institute
(a) India (b) Mexico
(c) Nigeria (d) Brazil
Figure 4: Female Employment Rate by Sectors, 1991-2017
Source: World Bank
Despite their differences in cultures and geographical locations what these developing countries share in common with Turkey is that they are prema-turely deindustrializing economies (Rodrik, 2016). In line with the premature deindustrialization hypothesis, these countries achieve their highest employ-ment in manufacturing levels at very low GDP per capita levels (much lower than the peak manufacturing shares of advanced economies). For Brazil, for
example, the GDP per capita level at which manufacturing employment share peaks is 5202$, whereas for Mexico 7275$ (Castillo & Neto, 2016). The number for Nigeria and Brazil is even more striking, only 602$ (Rodrik, 2016).
2.2 The Linkage From Deindustrialization to Automation
The decline in the share of manufacturing in GDP is closely associated with the productivity growth in manufacturing activities (Ramaswamy & Rowthorn, 1997). From 1971 until 2016, manufacturing jobs in United King-dom have declined by 66 percent, however, since 1950s manufacturing output in UK has grown by 113% (SPERI, 2016). Similarly, manufacturing industry has grown by 67% between 1987-2018, whereas, employment in manufacturing declined by 27% for the same period. These figures suggest that productivity in manufacturing industry increases for advanced economies.
Gross Value Added per hour worked is considered as a close proxy for measuring labor productivity. It gives an idea about the efficiency of the labor input in production. The figure below shows an overall downward trend in the annual growth of gross value added per hour for both USA and EU countries. Starting from financial crisis period, productivity growth of labor in total econ-omy in both USA and European Union has fallen from 3 percent to 0 percent. From this picture, it can be concluded that advanced economies have been ex-periencing a decline in their labor productivity(Figure 5).
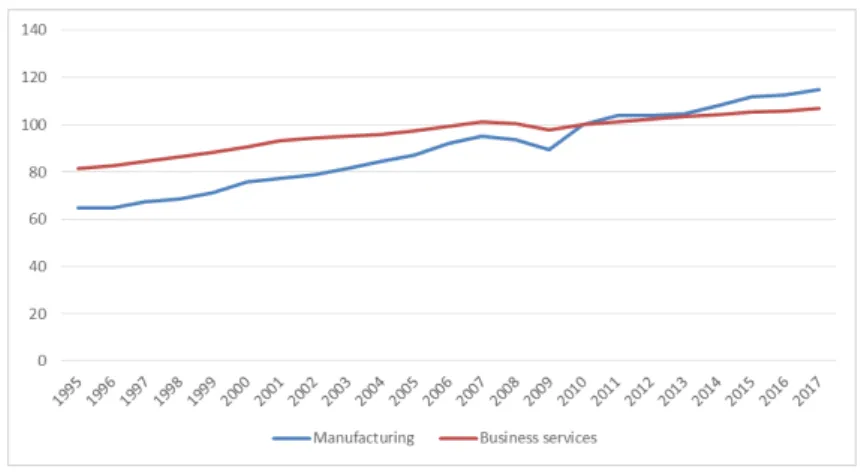
Dissecting productivity growth into sectors provides different results. Although, the productivity growth in total economy is experiencing a declin-ing trend, manufacturdeclin-ing sector in particular shows higher annual change in productivity compared to services sector. According to Figure 6, productiv-ity growth in manufacturing is on average 3 percent higher than services sec-tor. This productivity difference reaches its climax in 2010 where productivity
Figure 5: Gross Value Added Per Hour Worked (Annual growth/change) , USA and EU countries, constant prices, annual growth/change
Source: OECDstat
growth in manufacturing is 10 percent higher than services sector. In alignment with the relative increase in productivity in manufacturing industry, Figure 7 shows how productivity in manufacturing catches up with services sector and follows a differential path. Differential productivity growths in manufacturing in comparison to services sector might be a reason for deindustrialization and these figures prove this point as suggested by Ramaswamy & Rowthorn (1997).
Figure 6: Gross Value Added Per Hour Worked, Total Economy, constant prices, annual growth/change, services and manufacturing
Source: OECDstat
Gross Value Added per hour index gives a clearer perspective on pro-ductivity trends in both industries. Labor propro-ductivity in business services in EU area seems to show a better performance than manufacturing until 2010. Starting from 2010, manufacturing catches up with business services and shows higher labor productivity onwards(Figure 7).
Figure 7: Gross Value Added Per Hour Worked Index, EU area, Manufacturing and Services, constant prices
Source: OECDstat
Labor productivity in US (Figure 8), measured as output per hour worked, between 1987-2016 has showed constant increase, whereas, productiv-ity of capital, measured as per unit of capital services, following a stable path until 2008 experienced a sudden fall in 2009 and kept being steady from then on.
Figure 8: Labor and capital productivity in manufacturing sector, US
Source: Bureau of Labor Statistics
Overall, we can conclude that productivity in manufacturing is rising faster relative to other sectors. But how did this recent productivity growth in manufacturing sector happen? The answer to this question lies in the techno-logical advancements. Incorporation of machinery into production processes fa-cilitated a cheaper and faster way of producing manufacturing goods, by com-plementing the tasks that workers do. Hence, less labor could produce more
output with the help of machines.
The deindustrialization in industrialized countries, USA and European countries, happened due to offshoring of manufacturing activities to developing countries, where labor is cheaper. However, deindustrialization in developing countries, namely premature deindustrialization, happens due to increasing use of machines in manufacturing factories. Therefore, rather than reshoring of manufacturing jobs back to developed economies, we observe increasing use of technological capital input in production in the developing countries. Ac-cordingly, a World Bank (2016) report found that “share of occupations that could experience significant automation is actually higher in developing coun-tries than in more advanced ones, where many of these jobs have already disap-peared.” The displacement of manufacturing jobs depend on the pace of tech-nological disruption. Thus, it is very important to analyze current trends in automations in order to pin down where developing countries’ manufacturing industries are at in their premature deindustrializing trajectory.
2.3 Overview of Automation Trends in the World
Following the invention of cotton gin, steam locomotive and internal com-bustion engine, industrialization has changed the nature of the work we do. The incorporation of machinery into manufacturing has brought efficiency to production; however it has also given rise to concerns about the future of the occupations. Is there a technology-induced unemployment and if there is, how many jobs will be lost due to technology? Researchers have differing answers to this question: Frey & Osborne (2013), in their analysis of the probabilities of computerization among 702 distinct occupations, found that 47% of US em-ployment is at risk due to automation. Further, Acemoglu & Restrepo (2017) found that from 1993 to 2007, exposure to robots has a significantly negative
effect on both employment and wages.
Rapid automatization of jobs around the world also has different impli-cations for the future trends in employment of female and male workers. Re-cently, PricewaterhouseCoopers (2018) have held a comprehensive survey to measure the impact of AI (artificial intelligence), robotics and automation on over 200000 jobs in 29 countries. Their methodology distinguishes 3 waves of automation: algorithmic period which lasts until 2020’s, augmentation period which lasts until the end of 2020s and autonomy period which lasts through mid-2030s. During the first wave, share of jobs that could be automated across all industries is only 3%. When we compare the automation potentials of men and women, women workers seem to be more exposed to the threat of their jobs being substituted by machines with 4% of female workers, whereas the same number for men is only 2%. During the second wave, share of jobs that could be fully automated rises to 19%. Asymmetric exposure to the risk of au-tomation still persists in this period with 23% of female workers and 16% of male workers being under the risk of automation. The impact of automation on jobs becomes more pronounced during autonomy period with 30% of jobs with automation potential. However, the gendered effects become reversed with 26% of female workers and 34% of male workers under the risk of automation. Hence, male workers are expected to be affected more by the job displacements due to automation in the long run.
According to International Federation of Robotics, the average number of installed industrial robots per 10000 employees in the manufacturing in-dustry throughout the world is currently 74. Manufacturing robots in South Korea is 8.5 times higher than this average, in Singapore 6.5 times higher and in Germany 4 times higher. United States is ranked 7th with 189 robots per 10000 employees; whereas China stands below the world average with 68 robots per 10000 employees. This figure shows that Chinese production is relatively
more labor intensive compared to countries like Japan, Singapore or Germany. Turkey is far below the world average as well with only 23 robots per 10000 employees (Figure 9 & 10).
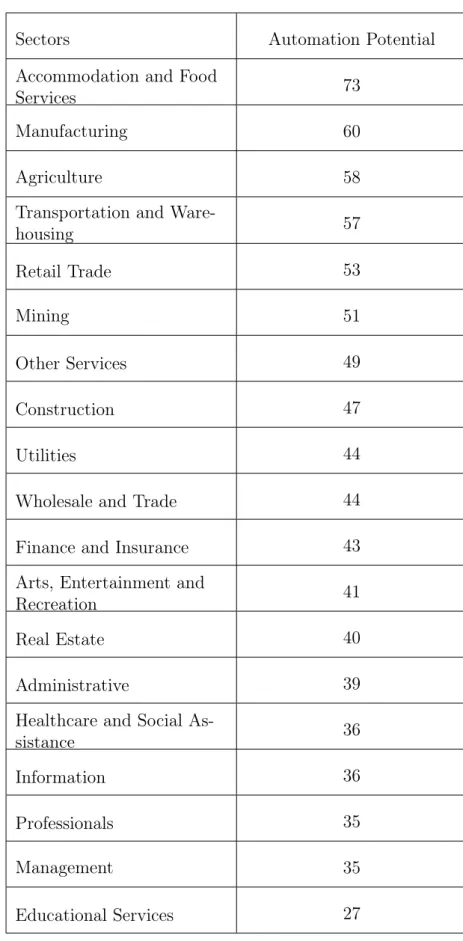
The reason for manufacturing having higher productivity growth com-pared to services is because the manufacturing activities have higher possibil-ities of being automated. According to McKinsey & Company (2017) estima-tions, the top 3 sectors with the highest automation potential are accommo-dation and food services, manufacturing and transportation and warehousing with manufacturing having 60% potential of being automated. These sectors are closely followed by agriculture, mining and construction, both of which re-quire relatively less human capital, creativity, organisational traits and exper-tise in decision making(Table1).
The decomposition of broad job categories into occupations supports this view more clearly. Number of jobs with probability of computerization, a proxy to evaluate how propitious the jobs are for automation, that is higher than 70% is 320. In Table 2, the automation potential of broad job categories are calculated by taking simple average of the automation potential of occupa-tions, which was calculated by Frey and Osborne’s study (2013) corresponding to each job category. Five occupation groups with the highest probabilities of computerization are Building and Grounds Cleaning and Maintenance; Farm-ing, FishFarm-ing, and Forestry; Construction and Extraction; Food Preparation and Legal Occupations. Except for legal occupations, what these jobs have in common is that they require very few analytical skills and their median annual wages are relatively lower than other occupation groups.
Although probability of computerization is an informative proxy for tomation potentials of occupations, it only represents a possible path for au-tomation trends, hence might be pretty far from reality. According to O*Net
(Occupational Information Network) database, a data collection program spon-sored by U.S. Department of Labor/Employment and Training Administration providing a detailed analysis of the degree of automation of occupations, top ten occupations with the highest degree of automation are comprised of oc-cupations like farm workers, telephone and machine operators, processors and travel agents. These occupations belong to different job categories, however, majority of them are projected to have losses in employment according to the estimates of US Department of Labor. Another interesting commonality be-tween these occupations is that majority of them require high-school education and their annual wages are located at the middle of the wage distributions, supporting the hypothesis that middle skill jobs with middle wages are highly susceptible to automation (Table 4).
The gender implications of automation trends in these occupations can be drawn from the female-to-male ratios. Table 6 provides the female-to-male ratios of broad job groups for both workers older than 16 years old and older than 20 years for 2016 and 2017. Female-to-male ratio can be defined as num-ber of female workers divided by numnum-ber of male workers in a particular indus-try. If the ratio is below 1, number of male workers exceeds the number of fe-male workers and hence the industry is fe-male dominant. Conversely, if the ratio is above 1, number of female workers is higher than male workers. According to Table 5, the job categories with the highest probability of computerization, i.e. highest potential of automation, are generally male dominant, except for food preparation and serving related occupations. On the other hand, occupation groups with the lowest potential for automation such as healthcare, personal care or education are female dominant. Number of female workers in these oc-cupations is almost three times higher than their male counterparts. Female workers’ dominance in these jobs is pretty natural in the sense that the en-trance of female workers into From this perspective, under current automation
trends women seem to be better off in the future since the “female” occupations are threatened less by the risk of going extinct.
2.4 Routine Component of Tasks
Computerization is reported to have asymmetric effects across various occupations. In order to assess to what extent adoption of high-technology ma-chinery affects the employment of occupations, some researchers have come up with several methodologies to evaluate the routine component of tasks in occu-pations. Routine tasks are defined as tasks “that can be accomplished by ma-chines following explicit programmed rules.“ (D. Autor et al., 2003). Hence, the degree of codifiability, the extent to which the tasks can be reduced to codes, should be considered to evaluate the routineness of occupations. In con-trary, non-routine tasks are characterized as “tasks requiring analytical reason-ing skills or interactive, communication and managerial skills” (Marcolin et al., 2016). Services occupations such as management and administrative occupa-tions, sales, personal care or healthcare which involve face-to-face interaction, decision-making, forming and testing hypotheses, organizing and managing people are hard and expensive to automate.
Contact with others index can be considered as a proxy to measure the intensity of tasks requiring face-to-face interaction and communication and hence it might be useful in identifying the occupations which are not very easy to automate. According to the classification of O*NET database, there are 19 occupations that scores 100 in “Contact with Others” index, which evaluates to what extent the job require to be in contact with others. Among these 19 occu-pations with the highest score, 11 of them belong to the category of healthcare practitioners and healthcare support occupations. The remaining is comprised of office and administrative occupations, sales and personal care. Despite
sig-nificant differences, these occupations are altogether services. On the other hand, the occupations with the least degree of “contact with others” index are generally production occupations like machine operators, machine setters or farm workers and laborers.(Table 7).
CHAPTER 3
THE APPLICATION OF ROUTINE COMPONENT
METHODOLOGY TO TURKISH PIAAC DATA
3.1 Data & Methodology
The routineness of an occupation may give an idea about how likely an occupation can be automated, hence it is a very useful measure to assess the automation trends of occupations in a country. In D. H. Autor & Dorn (2013)’s study, routine task intensity indicator, namely RTI, is measured as the linear combination of routine, manual and abstract tasks of an occupation. The definition, content and degree of these tasks are determined in Dictionary of Occupational Titles (DOT), compiled by US Department of Labor.
In order to quantify the routineness and non-routineness of occupations, D. Autor et al. (2003) have introduced a novel methodology to the literature where they decomposed occupations into 5 distinct tasks. These tasks are non-routine analytic, non-non-routine interactive, non-routine cognitive, non-routine manual and non-routine manual. For non-routine interactive skills, they have checked Di-rection, Control and Planning (DCP) variable, defined as “adaptability to ac-cepting responsibility for the direction, control, or planning of an activity” and for non-routine analytic skills they have checked GED-MATH variable which can take 3 different levels: lowest, middle and highest level. Workers with
low-est level of GED-MATH variable are able to perform very basic mathematical operations like addition and subtraction of 2-digit numbers, whereas the ones with highest level are able to analyze aerodynamic and thermodynamic sys-tems or design complex machinery. Routine cognitive tasks are measured by STS variable which stands for Sets Limits, Tolerances or Standards. Routine manual tasks are calculated by “finger dexterity” variable which stands for “the ability to move fingers and manipulate small objects with fingers, rapidly or accurately”. Non-routine manual tasks are measured by “eye-hand-foot coordi-nation” variable.
The variables aforementioned are not readily available for Turkish data, hence they should be constructed. Following Marcolin et al. (2016), this study utilizes PIAAC survey responses in order to construct routine intensity index of occupations (RII). Survey of Adult Skills (PIAAC) held by OECD among 33 countries provides a wide range of information regarding the numeracy, liter-acy, problem solving and information processing skills of the respondents. Also, the Background Questionnaire of the survey includes information about control variables such as gender, age, occupation, educational status and compensa-tion, as well as the kind of tasks they are assigned and the frequency of ICT and internet usage both at work and everyday life. Covering the responses of almost 250000 adults aged 16-65, PIAAC is one of the most comprehensive sur-veys for assessing the skill level of workforce in both advanced and developing economies. Turkey has participated in Round 2 of PIAAC survey in 2014-2015 with 5277 respondents aged 15-65 years old.
The equation below specifies how the Routine Intensity Indicator is calcu-lated:
wplanownP lanownk,i,o+ worgownOrganiseownk,i,o(1.1)
Sequentiability variable is measured by the responses to question D_Q11a: “To what extent, can you choose or change the sequence of your tasks?”.
Flexibility variable is measured by the responses to question D_Q11b: “To what extent can you choose or change how you do your work?”
Plan_own variable is measured by the responses to question F_Q03a: “How often your current job involves planning your own activities?”
Organise_own variable is measured by the responses to question F_Q03c: “How often your current job involves organizing your own time?”
The responses to these variables can give an idea as to what extent work-ers can manage the order and the content of their tasks. The higher their abil-ity or freedom to decide or control these tasks, the more non-routine tasks there are in their occupation. Occupations with non-routine tasks in majority are less likely to be automated, hence workers with these occupations should report lower values.
In their study, Marcolin et al. (2016) construct numerous indexes by uti-lizing different methodologies. One of these indexes are built by determining the weights according to coefficient of variation, so that each variable take on their weights according to their dispersion. Another way in which they com-puted RII was by assigning equal weights. In this study, the index is preferred to be computed by assigning weights to each variable according to their prin-cipal components, the third method applied by the authors. In the original study, the components are reported to be approximately the same. The results of the principal components analysis for the Turkish PIAAC data are
summa-rized below (Table 8).
W eight_of _variable = 1st component of variable
Total of 1st component (1.2)
Component 1 captures almost the half of the total variation in each vari-able, hence it is selected for computation of weights. Weights are calculated by dividing the first component of the variable by the summation of components.
Just as in the study of Marcolin et al. (2016), the principal component analysis yields weights that are almost equal to each other. Equal weights im-ply that each variable of the questionnaire attain equal importance in deter-mining how routine the occupations are in Turkey.
3.2 Routine Component of Occupations in Turkey
Table 9 below shows the weighted average of Routine Intensity Indicators for all ISCO08 1-digit job categories. On a scale from 1 to 5, the occupations with RII close to 1 contain relatively less routine component whereas the ones with RII close to 5 are relatively more routine. There are 2284 respondents from Turkey which have answered the 4 questions aforementioned from 114 different ISCO08 occupations at the 3 digit level. Among 2284 respondents, there are 1696 men and 588 women.
The lowest RII among ISCO08 3 digit occupations is 0.99 whereas the highest RII is 4.99. The 25th percentile value is 2,76; the median is 3,77 and the 75th percentile is 4,5. Routine intensity classes are designated accord-ing to these percentiles. So, occupations with RII between 0.99 and 2.76 are grouped as low routine intensity occupations, whereas the ones with RII be-tween 2,76 and 3,77 are grouped as medium routine intensity, and the ones
with RII higher than 4,5 are grouped as high routine intensity occupations. The routine intensity index is calculated at the occupation level and then RII for ISCO08 1-digit level occupations is calculated by taking the weighted aver-age of the corresponding 3-digit occupations.
Overall, all job categories in Turkey fall into either medium or high rou-tine intensity class. Interestingly, the highest RII belongs to the group of Man-agers, with administrative and commercial managers having the highest routine task component. This is a striking result in the sense that administrative and commercial managers are expected to be less suited to being substituted by automated machines.
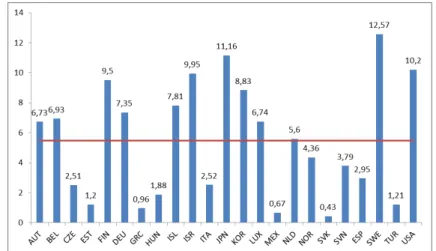
In contrast, plant and machine operators and the assemblers report the lowest RII. Again, a very striking result, because relatively lower RII suggests that occupations related to operating industrial equipment or assembling prod-ucts according to a certain procedure are relatively less likely to be automated. At first glance, this result might seem unrealistic, however, low RII might be due to the fact that Turkish industrial production consisted of low or middle technologies. According to TUBİTAK, Turkey’s industrial production is lo-cated between Industry 2.0 and Industry 4.0 in terms of “digital maturity”, a term coined to define the extent to which the industrial enterprises are able to integrate automation systems into their production channels. In parallel to dig-ital maturity, as of 2007, R&D intensity of manufacturing sector in Turkey is 1.21 very well below the OECD average which is 5.47 represented by the red line in the figure(Figure 9).
Female-to-male ratios of ISCO08 1 digit level job categories suggest that in every major occupation group number of male workers exceed number of female workers (Table 12). However, professionals, clerks and elementary oc-cupations recently employ more female workers than they used to. So, we can
say that female workers leaving agricultural work situate themselves in low-skill service occupations lately. This is not a surprising trend since almost every de-veloping country experience the shift of female labor force from labor-intensive industries into services occupations as a result of premature deindustrialization. Interestingly, these job categories have high number of RII indexes, suggesting that they are adequate for the adoption of automated systems, as routine tasks dominate their task composition. So, it could be said that low skill service oc-cupations which women take up are likely to experience decreases in demand for labor, resulting in the layoff of workers. Under this scenario, Turkish female workers in these industries are under threat of automation systems in the near future.
Figure 9: R&D intensity of manufacturing sector
Source: OECD STAN database
3.3 Are Female Workers Prepared for ICT and Automation Trends?
In order to assess how much risk female workers have in the face of in-corporation of automation technologies into manufacturing, their technological literacy should be closely examined. The degree of compatibility of a worker to changing nature of production systems can be evaluated by their access to and use of information and communications technologies, as well as the analytical
requirements of the tasks they are assigned.
According to PIAAC survey results, Turkey ranks at the bottom among OECD countries in problem-solving in technology-rich environments. Prob-lem solving in technology rich environments is defined as “using digital tech-nology, communication tools and networks to acquire and evaluate informa-tion, communicate with others and perform practical tasks” (OECD,2016). From this perspective, survey questions does not only assess cognitive analyti-cal skills but also to what extent they are able to complement their computer skills with their problem solving skills, therefore, provide a good proxy for eval-uating the capacity of workers to manage their work on technological devices like computer. 35.6% percent of Turkish respondents have no computer expe-rience, in other words, approximately 1 in 3 Turkish adults doesn’t use and hasn’t used a computer at all. Among the Turkish participants 17.7 percent has opted out of computer-based assessment, 2.4 percent has failed the ICT core test which tests whether the participant is able to use tools of the com-puter such as mouse or keyboard. 15.9% has scored below Level 1 and 18.9% scored at Level 1. At Level 1, the individual is able to use e-mail software and search content through web browsers. Only 8 percent of Turkish respondents has scored Level 2 or Level 3. At this level, problem solving depends on the individual’s capability of using computer programs and employing complex commands and functions to search, find and manage the information. It is observed that Turkey is far below the world average of 31 percent in this cat-egory. Despite the fact that industrialized countries like Germany, Australia, Canada and United States score above the OECD average, surveyed countries have scored below 50 percent and 5.4 percent of adults in all OECD countries have scored at Level 3 (Figure10).
Analyzed with a gendered perspective, again Turkey performs worse than OECD countries. Difference between men and women in problem-solving in
Figure 10: The percentage of 16-65 year-olds scoring at Level 2 or 3 in problem solving in technology-rich environments
Source: OECD Survey of Adult Skills (PIAAC), (2012,2015)
technology-rich environments test is the highest in Turkey. The percentage of Turkish women who has no computer experience or failed the ICT core test is 46 percent, whereas, the percentage of Turkish men who has no computer experience or failed the ICT core test is 29%. This makes a difference of 17 percentage points between men and women which is the highest difference among OECD countries. Turkey is followed by Greece with 7 percent differ-ence(Figure11). However, it is important to note that women outperform men in ICT core test in more than half of the OECD countries.
The responses to the Background Questionnaires reveal further in-formation about the degree of quantitative analysis required in the tasks that female and male workers do in their jobs. When they are asked how often they usually calculate prices, costs and budget, 56.44 percent of female adults report “Never”, whereas, 45% of men report “Never”. 18% of women and 20% of men are required to calculate prices, costs and budget every day at work (Figure12).
48% of female adults and 42% of male adults in Turkey used computer in their last job(Figure13).
In Turkey, the degree of complexity of tasks completed using a computer is pretty low. 44 percent of female and 50 percent of male respondents of
sur-Figure 11: Difference of percentage of women and men who has no experience of computer usage or failed ICT core test
Source: OECD Survey of Adult Skills (PIAAC), (2012,2015)
Figure 12: Summary of Responses to the question GQ03b: In your last job, how often did you usually calculate prices,costs and budget?
Source: OECD Survey of Adult Skills (PIAAC), (2012,2015)
vey report their degree of complexity in computer usage at work as “Straight-forward” which includes routine tasks like data entry or sending e-mails. Only 3 percent of female and 6 percent of male respondents use computer for com-plex tasks such as developing software or coding (Figure 14)
Although the computer and ICT skills of Turkish workers seem pretty low for both genders, it is also clear that demand for ICT skills in Turkey is pretty low too. When the respondents are asked whether lack of
com-Figure 13: Summary of responses to question GQ04: Did you use a computer in your last job?
Source: OECD Survey of Adult Skills (PIAAC), (2012,2015)
Figure 14: Summary of responses to question GQ06: What level of computer use is needed to perform your job?
Source: OECD Survey of Adult Skills (PIAAC), (2012,2015)
puter skills affected their chances of being hired for a job or getting a pro-motion or pay raise, 82 percent of women and 80 percent of men answer “No”(Figure15). These findings altogether suggest that Turkey is lags behind advanced economies under the era of so-called technological transformation and Industry 4.0.
The development of ICT in a country is closely linked to spending on Re-search and Development. Business expenditures on R&D in Turkey are very low compared to other industrialized countries and/or emerging economies.
Al-Figure 15: Summary of responses to question GQ08: Has a lack of computer skills affected your chances of being hired for a job or getting a promotion or pay raise?
Source: OECD Survey of Adult Skills (PIAAC), (2012,2015)
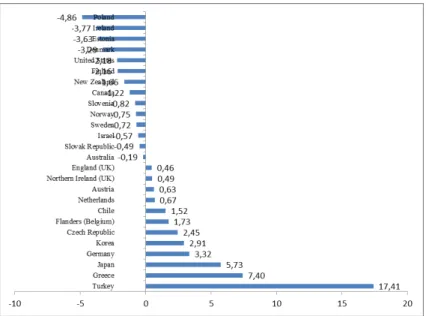
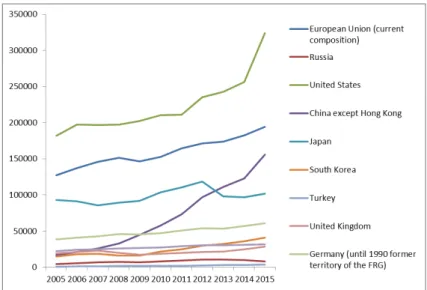
though Turkey has the second highest growth rate, right after China, in R&D expenditures over 2005-2015 period, still business expenditures on R&D is pretty low compared to other countries. China has remarkably increased its R&D spending despite not being able to catch up with USA’s R&D spending levels. Turkey seems pretty far from catching up with R&D expenditure levels of industrialized countries(Figure16).
Figure 16: Business expenditure on R&D for selected countries, 2005-2015 total economy, million euros
CHAPTER 4
CONCLUSION
The main aim of this study is to situate Turkey’s position among the pre-maturely deindustrializing developing countries under a gendered perspective. Deindustrialization, the shift from manufacturing to services appear in a rather ”premature“ fashion among developing countries like Turkey. These economies are characterized by sudden shifts in their labor force from agriculture to ser-vices without fully internalizing the technological advancements and incorpo-rating institutions which will invent new technologies in manufacturing indus-try. hence, they end up importing the latest technology from industrialized and advanced countries. These imported technologies mostly affect occupations re-lated to manufacturing production such as operators, assemblers, sewers, tai-lors, food preparation workers and so forth. Hence, in order to analyze the job destructing effect of premature deindustrialization on labor markets of develop-ing economies, we need to analyze how technological advancements in manufac-turing, namely automation, affect employment in certain occupation groups.
The tasks in occupations around the world are observed to follow a trend of rapid change as automation and artificial intelligence technologies are incor-porated into the production processes. One of the main concerns about this change is whether these technologies start to substitute workers rather than complementing their work. Therefore it is necessary to investigate to what
ex-tent workers around the world are going to be affected by the changing task compositions in occupations. By this motive, we utilize a novel measure, called routine intensity indicator (RII), to identify the components of occupations that can easily codified and hence automatized. To our knowledge, routine in-tensity indicator has not been calculated for Turkish data before, hence this study is a contribution to the literature.
According to the results of our analysis, managers, professionals and skilled agricultural forestry and fishery workers are the top three occupations with the highest RII. It is surprising to find that occupations like chief exec-utives or ICT professionals or teachers, which require high human capital as well as communication and decision making skills, have high potential for au-tomation. However, at this point we should note that the questions selected for calculating the index do not only reflect potential of substitutability but also of complementarity. In this sense, it could be said that automation complement the tasks in these occupation groups.
At this point, a question naturally comes up: Given that tasks in these occupations have higher potential of being complemented by automation tech-nologies, are workers capable of using these technologies? The results from re-sponses of Turkish workers to Survey of Adult Skills, workers in Turkey have very little familiarity with information and communication technologies. 51% of women and 57% of men never used a computer in their job. However, it is also surprising to find that 83% of women and 81% of men state that lack of computer skills did not affect their chances of being hired for a job. So, not only supply side but also demand side of labor market is not ready to incorpo-rate automation into the occupations.
From a gender perspective, the occupations with relatively higher RII val-ues, also have relatively high female-to-male ratios. In all major occupation
groups, men outweigh women in labor force, however the occupations that have female-to-male ratios closer to 1 are professionals, skilled agricultural,fishery workers,clerks and elementary occupations. All of these jobs have RII above 3,5 which means they are likely to be automatized. However, again as PIAAC survey results suggest women have very basic knowledge of using ICT. Consid-ering that men have performed fairly the same in the survey, it is possible to say that automation of tasks in occupations would not result in gender differ-entiated outcomes. Still, relatively higher number of women are employed in occupation groups like clerks, elementary occupations, agricultural and fishery workers. These occupation groups require relatively low levels of human capital with a low average salary. Female workers are still at a disadvantageous posi-tion against male workers in that sense.
Table 1: Automation Potentials of Job Groups
Source: McKinsey & Company (2017)
Sectors Automation Potential
Accommodation and Food
Services 73
Manufacturing 60
Agriculture 58
Transportation and
Ware-housing 57 Retail Trade 53 Mining 51 Other Services 49 Construction 47 Utilities 44
Wholesale and Trade 44
Finance and Insurance 43
Arts, Entertainment and
Recreation 41
Real Estate 40
Administrative 39
Healthcare and Social
As-sistance 36
Information 36
Professionals 35
Management 35
Table 2: Median annual wages and the probabilities of computerisation
Source:Frey & Osborne (2013),usawage.com
Occupations Probability of
Computerisa-tion
Median Annual Earnings
Building and Grounds Cleaning and
Main-tenance Occupations 82% 24700
Farming, Fishing, and Forestry Occupations 78% 23510
Construction and Extraction Occupations 68% 43610
Food Preparation and Serving Related
Oc-cupations 67% 20810
Legal Occupations 64% 79650
Transportation and Material Moving
Occu-pations 60% 30730
Office and Administrative Support
Occupa-tions 58% 34050
Business and Financial Operations
Occupa-tions 58% 66530
Computer and Mathematical Occupations 56% 82830
Production Occupations 55% 33130
Table 3: Median annual wages and the probabilities of computerisation,continued
Source: Frey & Osborne (2013),usawage.com
Occupations Probability of
Computerisa-tion
Median Annual Earnings
Education, Training, and Library
Occupa-tions 54% 48000
Installation, Maintenance, and Repair
Oc-cupations 53% 43440
Arts, Design, Entertainment, Sports, and
Media Occupations 53% 47190
Architecture and Engineering Occupations 53% 77900
Personal Care and Service Occupations 53% 22710
Life, Physical, and Social Science
Occupa-tions 52% 63340
Management Occupations 48% 100790
Protective Service Occupations 48% 38660
Healthcare Support Occupations 47% 27910
Healthcare Practitioners and Technical
Oc-cupations 43% 63420
Community and Social Services
T able 4: T op ten o ccupations with the highest degree of automation Source: O*Net, BLS Occupations Automation Degree Emplo ymen t 2016 (thou- sands) Emplo ymen t 2026 (thou- sands) Emplo ymen t Change 2016-2026 (p ercen t) 2017 Median Ann ual W age W age P ercen tile T ypical En try-lev el education T ypical on-the-job training F arm w ork ers and Lab or ers, Crop 74 503,7 509,2 1,1% 23380 30,4% No formal education creden tial
Short-term on-the-job training
Claims Examiners, Prop ert y and Casualt y Insurance 73 311,1 306,7 -1,4 64900 74% High- scho ol diploma or equiv alen t
Long-term on-the-job training
T ra v el Agen ts 70 81,7 72,2 -11,7% 36690 49% High- scho ol diploma or equiv alen t Mo derate term on-the-job training Rob otics E ngineers 69 132,5 141 6,4% 97250 87,2% Bac helor’s Degree None P ostal Service Mail Sorters, Pro-cessors, and Pro cessing Mac hine Op erators 68 106,7 89,1 -16,5 57260 69,5% High- scho ol diploma or equiv alen t
T able 5: T op ten o ccupations with the highest degree of automation,(con tin ued) Source: O*Net, BLS Occupations Automation Degree Emplo ymen t 2016 (thou- sands) Emplo ymen t 2026 (thou- sands) Emplo ymen t Change 2016-2026 (p ercen t) 2017 Median Ann ual W age W age P ercen tile T ypical En try-lev el education T ypical on-the-job training Medical and Clinical Lab oratory T ec hnologists 67 171,4 191,2 11,5 N/A N/A Bac helor’s Degree None Chemical Plan t and System Op-erators 66 33,2 30,1 -9,2% 62170 73,1% High- scho ol diploma or equiv alen t Mo derate term on-the-job training T elephone Op erators 66 9,1 7 -22,6% 36320 49% High- scho ol diploma or equiv alen t
Short-term on-the-job training
Air T raffic Con trollers 65 24,9 25,8 3,5% 124540 92,4% Asso ciate’s Degree
Long-term on-the-job training
Reserv atio n and T ransp ortation Tic k et Agen ts and T ra v el Clerks 65 150,1 155,8 3,8% 36280 48,9% High- scho ol diploma or equiv alen t
Figure 17: Number of installed industrial robots per 10000 employees in the manufacturing industry in 2016
Source: International Federation of Robotics
Figure 18: Number of installed industrial robots per 10000 employees in the manufacturing industry in 2016,continued
Table 6: Female-to-male ratios of job categories in USA,20 years and older
Source: Bureau of Labor Statistics
Occupations 2016 2017
Building and Grounds Cleaning and Maintenance Occupations 0,68 0,70 Farming, Fishing, and Forestry Occupations 0,28 0,30 Construction and Extraction Occupations 0,03 0,03 Food Preparation and Serving Related Occupations 1,17 1,17
Legal Occupations 1,07 1,12
Transportation and Material Moving Occupations 0,19 0,21 Office and Administrative Support Occupations 2,66 2,68 Business and Financial Operations Occupations 1,21 1,18 Computer and Mathematical Occupations 0,34 0,34
Production Occupations 0,39 0,41
Sales and Related Occupations 0,92 0,92
Education, Training, and Library Occupations 2,72 2,71 Installation, Maintenance, and Repair Occupations 0,04 0,04 Arts, Design, Entertainment, Sports, and Media Occupations 0,94 0,87 Architecture and Engineering Occupations 0,17 0,19 Personal Care and Service Occupations 3,47 3,23 Life, Physical, and Social Science Occupations 0,79 0,90
Management Occupations 0,64 0,66
Protective Service Occupations 0,27 0,27
Health care Support Occupations 7,23 6,80
Healthcare Practitioners and Technical Occupations 3,09 3,01 Community and Social Services Occupations 1,91 1,96
T able 7: Occupations w ith the least Con tact with others index Source: O*Net Database Con tact with Others Index Industry Occupations 51 Arts, Design, En tertainmen t, Sp orts, and Media Occu-pations Fine Artists , Including P ain ters, Sculptors, and Illus-trators 51 Pro duction Occupations Sew ers, Hand 50 Arts, Design, En tertainmen t, Sp orts, and Media Occu-pations Music Comp osers and Arrangers 50 Pro duction Occupations Sho e Ma chine Op erators and T enders 49 Pro duction Occupations P otters, Man ufacturing 48 Life, Ph ysical, and So cial Science Occupations Geological Sample T est T ec hn icians 46 F arming, Fishing, and F orestry Occupations F allers 46 Pro duction Occupations Meat, P oultry , and Fish Cutters and T rimmers 46 Pro duction Occupations P ain ters, T ransp ortation Equipmen t 44 Arts, Design, En tertainmen t, Sp orts, and Media Occu-pations P o ets, Lyricists and Creativ e W riters 40 F arming, Fishing, and F orestry Occupations F arm w ork ers and Lab ore rs , Crop 25 Computer and Mathematical Occupations Mathematical T ec hni ci a n s
T able 8: Summary of principal comp onen t analysis V ariable Comp1 W eigh ts Comp2 W eigh ts Comp3 W eigh ts Comp4 W eigh ts D_Q11a 0,4865 0,2433 0,5183 11,8063 0,6971 145,229 0,0932 7,8319 D_Q11b 0,4912 0,2456 0,5032 11,4624 -0,7074 -147,375 -0,0717 -6,0252 F_Q03a 0,5146 0,2573 -0,4768 -10,86 0,089 18,729 -0,71 -59,411 F_Q03c 0,5072 0,2536 -0,5 -11,407 -0,074 -15,583 0,6974 58,605 T otal 1,995 0,0439 0,0048 0,0119
T able 9: Routine In tensit y Index of Occupations in T urk ey ISCO08 Sectors Num b er of Resp on-den ts W eigh ted A v erag e RI I 1 Managers 171 4,04 11 Chief Executiv es, Senior Officials and L egislators 52 4,02 12 A dministrativ e and Commercial Manage rs 79 4,14 13 Pro duction and Sp ecialized Services Managers 27 3,83 14 Hospitalit y, Retail and Other Services Managers 13 3,90 2 Professionals 342 3,88 21 Science and engineering professionals 48 4,11 22 Health Professionals 28 3,82 23 T eac hing Professionals 147 3,97 24 Business and A dministration Professionals 59 3,75 25 Information and Comm unications T ec hnology Profes-sionals 8 3,91 26 Legal, So cial and Cultural P ro fes sionals 52 3,59 3 T ec hnicians and Asso c iate Professiona ls 235 3,54 31 Science and Engineering Asso ciate Professionals 54 3,45 32 Health Asso ciate Professionals 35 3,21 33 Business and A dministration Asso ciate Professionals 110 3,60 34 Legal, So cial, Cultural and Rela ted Asso ciate Profes-sionals 22 76 35 Information and Comm unications T ec hnicians 14 3,87
T able 10: Routine In tensit y Index of Occupations in T urk ey , (con tin ued) ISCO08 Sectors Num b er of Resp on-den ts W eigh ted A v erag e RI I 4 Clerical Supp ort W ork ers 116 3,48 41 General and Keyb oard Clerks 65 3,36 42 Customer Services Clerks 22 3,50 43 Numerical and Material Recording Clerks 28 3,71 44 Other Clerical Supp ort W ork ers 1 4,02 5 Services and Sales W ork ers 567 3,54 51 P ersonal Services W ork ers 221 3,42 52 Sales W ork ers 257 3,89 53 P ersonal Care W ork ers 9 3,53 54 Protectiv e Services W ork ers 80 2,74 6 Skilled Agricultural, F orestry and Fishery W ork ers 22 3,72 61 Mark et-orien ted Skilled Agricultural W ork ers 17 3,82 62 Mark et-orien ted Skilled F orestry , Fish ery and Hun ting W ork ers 3 2,33 63 Subsistence F armers, Fishers, Hun ters and Gatherers 2 5,00
T able 11: Routine In tensit y Index of Occupations in T urk ey ,(con tin ued) ISCO08 Sectors Num b er of Resp on-den ts W eigh ted A v erag e RI I 7 Craft and Related T rades W ork ers 326 3,28 71 Building a n d Related T rades W ork ers 113 3,19 72 Metal, Mac hinery and Related T ra d es W ork ers 87 3,40 73 Handicraft and Prin ting W ork ers 15 2,85 74 Electrical and Electronic T rades W ork ers 34 3,34 75 F o o d Pro cessing, W o o dw orking, Garm en t and Other Craft and Related T rades W ork ers 77 3,35 8 Plan t and Mac hine Op erators and Assem blers 194 2,87 81 Stationary Plan t and Mac hine Op erators 60 2,89 82 Assem blers 13 2,97 83 Driv ers and Mobi le Plan t Op erators 121 2,85 9 Elemen tary Occupations 258 3,26 91 Cleaners and Help ers 5 3,05 92 Agricultural, F orestry and F ishery Lab ourers 164 3,66 93 Lab ourers in Mining, Construction, Man ufacturing and T ransp ort 48 2,23 94 F o o d Preparation A ssistan ts 9 2,61 95 Street and Related Sales and Services W ork ers 4 4,26 96 Refuse W ork ers and Other E leme n tary W ork ers 28 2,80
T able 12: F emale-to-male ratio s of ma jor o ccupation groups in T urk ey Occupations 2005 2006 2007 2008 2009 2010 2011 2012 2013 2014 2015 2016 2017 T otal 0,34 0,35 0,35 0,36 0,38 0,40 0,41 0,42 0,43 0,42 0,43 0,44 0,45 Legislators, senior, officials and manage rs 0,08 0,09 0,09 0,11 0,11 0,11 0,12 0,14 0,17 0,15 0,15 0,18 0,18 Professionals 0,53 0,56 0,63 0,65 0,67 0,65 0,63 0,76 0,78 0,77 0,82 0,85 0,89 T ec hnicians & asso-ciate professionals 0,44 0,46 0,42 0,46 0,48 0,48 0,49 0,36 0,33 0,35 0,36 0,36 0,35 Clerks 0,63 0,64 0,73 0,71 0,75 0,76 0,79 0,76 0,73 0,73 0,75 0,77 0,72 Service w ork ers 0,23 0,25 0,26 0,27 0,29 0,30 0,33 0,36 0,37 0,41 0,44 0,46 0,48 Skilled agricultural, and fishery w o rk ers 0,80 0,80 0,78 0,77 0,76 0,81 0,79 0,75 0,73 0,68 0,66 0,62 0,62 Craft and related trades w ork ers 0,12 0,12 0,10 0,10 0,13 0,14 0,13 0,12 0,13 0,13 0,13 0,14 0,14 Plan t & mac hine op-erators & ass em blers 0,12 0,11 0,11 0,10 0,10 0,11 0,11 0,12 0,12 0,13 0,12 0,12 0,12 Eleman tary o ccupa-tions 0,41 0,44 0,45 0,47 0,49 0,53 0,57 0,65 0,70 0,65 0,70 0,70 0,75
REFERENCES
Acemoglu, D., & Restrepo, P. (2017). Robots and jobs: Evidence from us labor markets (NBER Working Papers No. 23285). National Bureau of Economic Research, Inc. Retrieved from https://EconPapers.repec.org/RePEc:nbr: nberwo:23285
Autor, D., Levy, F., & Murnane, R. J. (2003). The skill content of recent tech-nological change: An empirical exploration. The Quarterly Journal of Eco-nomics, 118 (4), 1279-1333. Retrieved from https://EconPapers.repec.org/ RePEc:oup:qjecon:v:118:y:2003:i:4:p:1279-1333.
Autor, D. H., & Dorn, D. (2013, August). The Growth of Low-Skill Service Jobs and the Polarization of the US Labor Market. American Economic Review , 103 (5), 1553-1597. Retrieved from https://ideas.repec.org/a/aea/ aecrev/v103y2013i5p1553-97.html
Bhalotra, S. R. (1998). The puzzle of jobless growth in indian manufacturing. Oxford Bulletin of Economics and Statistics.
Castillo, M., & Neto, A. (2016). Premature Deindustrialization in Latin Amer-ica. United Nations, ECLAC. Retrieved from https://books.google.com.tr/ books?id=8yAqnQAACAAJ (Citation Key: a2016premature)
Dasgupta, S., & Singh, A. (2006, May). Manufacturing, services and premature deindustrialization in developing countries [4]. , 2006 (20).
Dowrick, S., & Nguyen, D.-T. (1989). Oecd comparative economic growth 1950-85: Catch-up and convergence. American Economic Review , 79 (5), 1010-30. Retrieved from https://EconPapers.repec.org/RePEc:aea:aecrev:v: 79:y:1989:i:5:p:1010-30
Frey, C. B., & Osborne, M. (2013, September 17). The future of employment: How susceptible are jobs to computerisation? [Academic Publication]. On-line PDF. Oxford. Retrieved from http://www.oxfordmartin.ox.ac.uk/ publications/view/1314
Greenstein, J., & Anderson, B. (2017). Premature deindustrialization and the defeminization of labor. Journal of Economic Issues, 51 (2), 446-457. Retrieved from https://doi.org/10.1080/00213624.2017.1321397 doi: 10.1080/00213624.2017.1321397
Joekes, S. (1995). Trade-related employment for women in industry and ser-vices in developing countries (UNRISD Occasional Paper No. 5). Geneva: United Nations Research Institute for Social Development (UNRISD). Re-trieved from http://hdl.handle.net/10419/148777
Krugman, P., & Venables, A. J. (1995). Globalization and the Inequality of Nations*. The Quarterly Journal of Economics, 110 (4), 857–880. Retrieved from http://dx.doi.org/10.2307/2946642 doi: 10.2307/2946642
Lawrence, R. Z., & Edwards, L. (2013). Us employment deindustrialization: In-sights from history and the international experience. Retrieved from https:// piie.com/publications/policy-briefs/us-employment-deindustrialization
-insights-history-and-international
Marcolin, L., Miroudot, S., & Squicciarini, M. (2016). The routine content of occupations. (188). Retrieved from https://www.oecd-ilibrary.org/content/ paper/5jm0mq86fljg-en doi: https://doi.org/https://doi.org/10.1787/ 5jm0mq86fljg-en
McKinsey & Company. (2017). A future that works : Automation, employ-ment and productivity. Retrieved from https://www.mckinsey.com/mgi/ overview/2017-in-review/automation-and-the-future-of-work/a-future-that -works-automation-employment-and-productivity
Palma, J. G. (2000). Four sources of de-industrialisation and a new concept of the dutch disease. In J. A. Ocampo (Ed.), Beyond reforms: Structural dy-namic and macroeconomic vulnerability. Stanford University and the World Bank.
PricewaterhouseCoopers. (2018). Will robots really steal our jobs? : An in-ternational analysis of the potential long term impact of automation. Re-trieved from https://www.pwc.com/hu/hu/kiadvanyok/assets/pdf/impact _of_automation_on_jobs.pdf
Ramaswamy, R., & Rowthorn, B. (1997). Deindustrialization; causes and im-plications (IMF Working Papers No. 97/42). International Monetary Fund. Retrieved from https://EconPapers.repec.org/RePEc:imf:imfwpa:97/42 Rodrik, D. (2016, March). Premature deindustrialization. Journal of Economic
Growth, 21 (1), 1-33. Retrieved from https://ideas.repec.org/a/kap/jecgro/ v21y2016i1d10.1007_s10887-015-9122-3.html doi: 10.1007/s10887-017-9151 -1
Saeger, S. S. (1997). Globalization and Deindustrialization: Myth and Reality in the OECD. Weltwirtschaftliches Archiv , 133 (4), 579–608. Retrieved from http://www.jstor.org/stable/40440610
Slaughter, M. J. (2001). Trade liberalization and per capita income conver-gence: a difference-in-differences analysis. Journal of International Eco-nomics, 55 (1), 203–228. Retrieved from http://www.sciencedirect.com/
science/article/pii/S0022199600000878 (Intranational & International Eco-nomics Citation Key: SLAUGHTER2001203) doi: https://doi.org/10.1016/ S0022-1996(00)00087-8
SPERI. (2016). Uk manufacturing decline since the crisis in historical per-spective. Retrieved from http://speri.dept.shef.ac.uk/2016/10/20/british -manufacturing-has-entered-a-new-phase-of-decline-new-speri-brief/ Standing, G. (1999). Global feminization through flexible labor: A theme
revisited. World Development , 27 (3), 583-602. Retrieved from https:// EconPapers.repec.org/RePEc:eee:wdevel:v:27:y:1999:i:3:p:583-602
Tejani, S. (2016). Jobless growth in India: an investigation. Cambridge Journal of Economics, 40 (3), 843–870. Retrieved from http://dx.doi.org/10.1093/ cje/bev025 doi: 10.1093/cje/bev025
Tejani, S., & Milberg, W. (2016). Global defeminization? industrial up-grading and manufacturing employment in developing countries. Femi-nist Economics, 22 (2), 24-54. Retrieved from https://doi.org/10.1080/ 13545701.2015.1120880 doi: 10.1080/13545701.2015.1120880
UN Women. (2016). Progress of the world’s women 2015-2016. Retrieved from http://progress.unwomen.org/en/2015/
United Nations Conference on Trade and Development. (2016). UNCTAD trade and development report. Retrieved from https://unctad.org/en/ PublicationsLibrary/tdr2016_en.pdf
World Bank. (2016). World development report 2016: Digital divi-dends. Retrieved from http://documents.worldbank.org/curated/en/ 896971468194972881/pdf/102725-PUB-Replacement-PUBLIC.pdf
World Commission. (2004). A fair globalization - creating opportunities for all. Retrieved from https://www.ilo.org/fairglobalization/lang--en/index.htm