Non-intercalative, Deoxyribose Binding of Boric Acid to Calf
Thymus DNA
Ayse Ozdemir&Refiye Tekiner Gursaclı&Turgay Tekinay
Received: 10 February 2014 / Accepted: 20 February 2014 / Published online: 21 March 2014 # Springer Science+Business Media New York 2014
Abstract The present study characterizes the effects of the boric acid binding on calf thymus DNA (ct-DNA) by spec-troscopic and calorimetric methods. UV–Vis absorbance spec-troscopy, circular dichroism (CD) specspec-troscopy, transmission electron microscopy (TEM), isothermal titration calorimetry (ITC), and Fourier transform infrared (FT-IR) spectroscopy were employed to characterize binding properties. Changes in the secondary structure of ct-DNA were determined by CD spectroscopy. Sizes and morphologies of boric acid–DNA complexes were determined by transmission electron micros-copy (TEM). The kinetics of boric acid binding to calf thymus DNA (ct-DNA) was investigated by isothermal titration calo-rimetry (ITC). ITC results revealed that boric acid exhibits a moderate affinity to ct-DNA with a binding constant (Ka) of
9.54×10⁴M−1. FT-IR results revealed that boric acid binds to the deoxyribose sugar of DNA without disrupting the B-conformation at tested concentrations.
Keywords Calf thymus DNA . Boric acid . Spectroscopy . Binding mode . FT-IR
Introduction
Boron is a non-metallic element well-known in biochemistry for its properties of catenation and has recently attracted
considerable attention in the development of potential thera-peutic and delivery agents. In a manner analogous to carbon atoms in organic compounds, boron atoms can be linked in a series of covalent bonds to form a number of structures, such as polyhedral boranes, that display properties of considerable interest for biomedical applications. These properties include a low chemical reactivity and a high resistance to enzymatic degradation and have triggered the design of various boron-based materials to be utilized in biological systems [1]. Other medical applications of boron are primarily related to the element’s capacity to absorb neutrons, and the potential of this element for use in cancer therapy was recognized as early as the 1950s [2]. Boric acid in particular is principally utilized in boron neutron capture therapy (BNCT), a non-invasive therapeutic method for the treatment of various cancers [3] and especially brain tumors [1,4]. To date, several strategies have been employed to selectively deliver boron atoms or boron derivative drugs into tumor cells [5] by the use of various agents, such as liposomes [6,7] and nanoparticles [8]. There are several studies conducted on the antitumor ac-tivity of boric acid itself. Barranco showed that boric acid is effective for preventing prostate cancer [9] and reported the cytotoxic effects of boric acid on prostate cancer cells [10], and the effectiveness of boric acid for the inhibition of breast cancer cells’ growth was also noted in the literature [11,12]. However, the therapeutic potential of boric acid and its deriv-atives is yet to be established in full, and the effects of these compounds on healthy and diseased tissues remain largely unknown. As such, the precise metabolic effects of boric acid on key organic molecules, such as nucleic acids, need to be investigated in order to evaluate the potential of this com-pound, as well as other boron derivatives, in biomedical applications.
The mononuclear species boric acid B(OH)3 and borate
B(OH)4have been reported as the main forms of inorganic
boron. The present study focuses on boric acid as the boron compound of interest, as the hydroxyl groups of boric acid can
A. Ozdemir
UNAM-National Nanotechnology Research Center, Bilkent University, Ankara, Bilkent 06800, Turkey
R. T. Gursaclı
:
T. TekinayLife Sciences Research and Application Center, Gazi University, Ankara 06500, Turkey
R. T. Gursaclı
:
T. Tekinay (*)Polatlı Science and Literature Faculty, Gazi University, Ankara 06900, Turkey
e-mail: [email protected] DOI 10.1007/s12011-014-9924-8
readily interact with water molecules associated with biolog-ical ligands, and boric acid is known to form covalent and ester bonds with such molecules [13]. Calf thymus DNA was selected as our organic compound of choice, because it is an attractive target of many potent chemotherapeutics which act by interacting with DNA of tumor cells (by intercalation, inter- or intrastrand cross-linking, or binding to the N3 atom of DNA purines) and inorganic boron compounds can pro-duce lethal effect if they are located within or near the cancer cell nucleus [14]. Consequently, a greater understanding of the basic mechanism between DNA–boric acid interactions may allow the design of novel boron derivates for cancer inhibition.
The present study characterizes the interactions between boric acid (BA) and calf thymus DNA (ct-DNA) using several spectroscopic, calorimetric, and microscopic methods. Briefly, the binding of BA to ct-DNA was initially analyzed using absorbance studies, changes in the secondary structure of ct-DNA following boric acid binding were investigated by circular dichroism (CD) spectroscopy, transmission electron microscopy (TEM) was utilized to investigate the morphology of BA–ct-DNA complexes, and infrared spectroscopy was used to understand the binding mode and conformational changes in boric acid bound DNA. Isothermal titration calo-rimetry (ITC) was utilized to obtain vital information about binding constant and affinities of BA–ct-DNA complex.
Materials and Methods
Materials
C a l f t h y m u s D N A , b o r i c a c i d , a n d T r i s [tris(hydroxymethyl)aminomethane)-HCl] were purchased from Sigma-Aldrich (USA). Tris-EDTA (TE) was purchased from Invitrogen (USA). Both reagents were used as supplied without further purification. Tris-EDTA (TE) [10 mMTris, pH 8.0 (Tris–base and Tris–HCl) and 0.1 mMEDTA] or 0.01 M Tris-HCl buffer (pH 7.5) was used as buffer medium in all experiments. Buffer pH was adjusted using NaOH or HCl.
A stock solution of boric acid was prepared by dissolving boric acid in double-distilled water to a final concentration of 31 mg/ml and diluted as necessary to obtain the desired concentrations of boric acid prior to each experiment.
Calf thymus DNA stock solutions (0.1 mg/ml DNA or 1.18× 10⁻⁴ M base pairs) [15] were obtained by directly dissolving ct-DNA in buffer. Molarities of calf thymus DNA solutions were confirmed by spectrophotometric analysis (as-sumingε260=6,600 M−1cm−1[16]). The ratio of absorbance
at 260 and 280 nm was determined to verify solution purity, and a ratio between 1.7 and 2.0 was taken to indicate that the DNA samples were satisfactorily free of protein [17–20].
Stock solutions yielded 260:280 absorbance ratios between 1.72 and 1.84.
DNA Binding Studies
Ultraviolet–Visible Absorbance Spectroscopy
UV absorbance measurements were carried out on a Thermo Scientific Nanodrop 2000 benchtop spectrophotometer (Thermo Fisher Scientific, USA). For ultraviolet–visible (UV–Vis) spectroscopic measurements, mixtures of boric acid and ct-DNA were prepared by adding a constant concentration (0.01 mM) of ct-DNA to varying concentrations of boric acid (0.01, 0.05, 0.1, and 0.50 mM) in 0.01 M Tris-EDTA (pH 8.0). In order to obtain homogeneous solutions, all DNA and boric acid mixtures were vortexed before each bout of use. Plotting was conducted using GraphPad Prism5 software (La Jolla, CA).
Circular Dichroism Spectroscopy
A Jasco J-815 spectrophotometer (Jasco, Japan) was used to record the circular dichroism (CD) spectra of calf thymus DNA and boric acid mixtures in the 200–320 nm range. A quartz cell with a path length of 5.0 mm was utilized for all measurements. Titration experiments were performed with a mixture of 0.1 mM boric acid (BA) and 0.1 mM ct-DNA in 10 mM Tris-HCl (pH 7.5). CD measurements were performed with a scan speed of 100 nm/min at 25 °C in a nitrogen atmosphere.
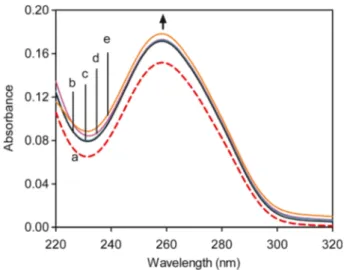
Fig. 1 UV–Vis spectra of the calf thymus DNA in 0.01 M TE buffer (pH 8.0) in the presence and absence of boric acid (BA). Total volume was constant. Arrow shows absorbance change upon increasing concentra-tions of boric acid. a Free ct-DNA (0.01 mM) and DNA–BA complexes with varying DNA/BA ratios—b [1:1], c [1:5], d [1:10], and e [1:50]
Transmission Electron Microscopy
Size and morphologies of BA–ct-DNA mixtures were deter-mined by transmission electron microscopy. Transmission electron microscopy (TEM) samples were prepared by over-night incubation of boric acid with ct-DNA in water at 4 °C. A drop of this mixture was placed on a copper TEM grid coated with carbon film and negative stained with 2 % uranyl acetate for 5 min. Following staining, the excess solu-tion on grid was removed by pipetting, and the grid was allowed to air dry prior to imaging. Images were obtained
with a Tecnai G2Spirit Biotwin microscope (FEI, USA) set to an accelerating voltage of 80 kV.
Fourier Transform Infrared Spectroscopy
Fourier transform infrared (FT-IR) spectra of ct-DNA and BA mixtures were obtained using a Nicolet 6700 FT-IR Spectrometer (Thermo-Scientific, US). Varying concentra-tions of BA were incubated with a final DNA concentration of 1 mM. After 3 h of incubation, 20μl of final solution was pipetted and subsequently dried on a 96-well plate at 37 °C for
Fig. 2 (a) CD spectra of (dashed line) free ct-DNA and BA–DNA mixtures in 10 mM Tris-HCl (pH 7.5). (b) CD spectra changes of ct-DNA are plotted as a function of increased BA concentration relative absorption at 247 nm and (c) at 277 nm. Arrows indicate CD spectrum change with increasing boric acid (BA) concentration
Fig. 3 TEM images of (a) free ct-DNA (0.1 mM), (b) 1 mM free BA, and (c) 0.1 mM ct-DNA+ 1 mM BA mixture. All samples were in double-distilled water
1 h prior to FT-IR transmittance analysis. All measure-ments were performed at room temperature. The spec-troscopy software OMNIC was used for measurements and basic modifications such as baseline and back-ground corrections. Backback-ground corrections for H2O
and CO2 were carried out for each analysis. Experiments
were run in at least three separate batches, each batch contained triplicate samples. Four-point data smoothing was performed by Sawatzky–Golay functionality prior to peak evaluation.
Thermodynamic Studies
Isothermal Titration Calorimetry
line adjustment. ITC data were acquired in two modes, the upper panel denoting heat flow versus time and the lower panel reflecting energy exchange per mole of sample in the syringe [21].
Thermodynamic parameters were calculated by the follow-ing formula:
ΔG0¼ −RTInKa¼ ΔH–TΔS0 ð1Þ
where T is the absolute temperature (298 K) and R is the ideal gas constant.
Results and Discussion
Absorbance Studies
UV–Vis spectroscopy of unmodified DNA yields a sigmoidal curve that typically peaks at 260 nm. Following the confirma-tion of this peak, absorpconfirma-tion spectral titraconfirma-tion experiments can be utilized to observe changes in absorbance peaks and shifts in the absorbed wavelengths, which reflect changes in the DNA secondary structure [3]. Molecule– and ion–DNA asso-ciations in particular result in the denaturation of the DNA helical structure due to the disruption of the hydrogen bonds between base pairs [22,23].
Absorption spectral titration experiments were performed and evaluated to determine that boric acid moieties are capable of binding to ct-DNA. Our results demonstrate that a molec-ular association exists between boric acid and ct-DNA (Fig.1). Although the absorbance change at 260 nm is negli-gible at lower concentrations of BA, it is increased signifi-cantly at higher concentration which results from DNA dena-turation. The observed hyperchromism without any shift is related to the non-intercalative binding of small molecule [24, 25]. Furthermore, an ethidium bromide displacement assay was utilized to determine the strength of non-intercalative binding between BA and ct-DNA. Our results confirmed the absorbance study, as the addition of boric acid to the ct-DNA-bound ethidium bromide did not result in a significant reduc-tion in emission intensities (data not shown). The binding mode of boric acid to calf thymus DNA was further investi-gated by several calorimetric and spectroscopic methods.
Circular Dichroism Spectra
Base staking of DNA nucleotides was reported to yield a positive CD band at 277 nm, and the helicity of DNA in turn generates a negative CD band at 247 nm [26]. As shown in Fig.2a, bands associated with free ct-DNA display a classical Gaussian shape, which is characteristic of the B-DNA
Table 1 Peak positions and spectral shifts of the free ct-DNA and ct-DNA–BA complex at dif-ferent molar ratios
Concentration of ct-DNA was kept constant (1 mM) for all samples
DNA band assignments Free DNA (cm−1) DNA–0.25 mM BA (cm−1) DNA–0.5 mM BA (cm−1) DNA–1 mM BA (cm−1) Guanine 1715 0 0 0 Thymine 1663 0 −1 0 Adenine 1604 +2 +1 −2 Cytosine 1496 +1 0 +3 Phosphate asymmetric 1231 +7 +8 +6 Phosphate symmetric 1084 +1 0 0 Sugar phosphate 1055 0 −6 −2 Backbone marker 967 0 0 +2 Deoxyribose 891 −10 −10 −9 B-conformation marker 825 −3 −1 −3
Isothermal titration calorimetry (ITC) measurements were performed at 25 °C (±0.2) on an ITC200
microcal-orimeter (Microcal®, USA). The data was analyzed using a one-site binding model by the Windows-based Origin software pack (Microcal®, USA). A ct-DNA concentration of 0.5 mM was present in the cell, and a 5 mM boric acid solution was used in the syringe. In order to prevent the potential protonation of the buffer, sample and titrant solutions were prepared in double-distilled water. Solutions were degassed before each titra-tion experiment, and ITC data were evaluated following
base-conformation [27]. An intensity increase at the 277-nm band, which is indicative of a conformational change from B to A-DNA [28], was not observed in our BA–ct-DNA samples. However, following the addition of boric acid, the intensity of both positive and negative peaks decreased gradually and without experiencing significant shifts. The absence of shifts
in the CD spectrum rules out the possibility of conformational change in DNA following the addition of boric acid. Figure 2b, c shows changes in CD spectra following the addition of boric acid. Zaludova et al. reported that decreases in the positive CD band at around 280 nm were indicative of the presence of denaturated regions [29]. Therefore, the re-duction observed in our dichroic bands may also correspond to the degradation of nucleotides which is consistent with our UV–Vis spectroscopy result.
Transmission Electron Microscopy
The general morphology of BA–DNA complexes was ob-served using TEM images. Structures of free ct-DNA and free boric acid are shown in Fig.3a, b.
Free ct-DNA was found to form irregular structures, prob-ably because the DNA samples utilized were sheared (Fig.3a). Figure3b demonstrates that boric acid molecules form large aggregates. The structural changes in ct-DNA were observed in the presence of two different molarities (1 and 5 mM) of boric acid. Conspicuous aggregates were observed in the presence of 1 mM BA (Fig.3c). Curiously, boric acid molecules were homogenously dispersed and bore regular shapes with diameters in the range of 10–15 nm. It is likely that BA molecules bound to the exposed surfaces of double-stranded DNA clusters, which indicates that boric acid could bind to the ct-DNA. The resulting binding may be derived from van der Waals and electrostatic interaction between ct-DNA helix and boric acid. Ct-ct-DNA could not be observed in 5 mM boric acid which indicated the excessive boric acid made DNA denaturation.
Fourier Transform Infrared Analysis
Spectral analysis of the binding mode of BA to ct-DNA was investigated via FT-IR spectroscopy. In the region of 700–
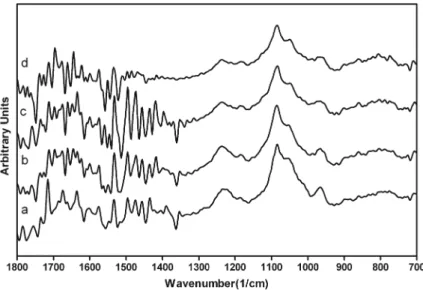
Fig. 4 FT-IR spectra of ct-DNA– BA mixtures in the region of 700– 1,800 cm−1. (a) Free
DNA(1 mM), (b) DNA+ 0.25 mM BA, (c) DNA+0.5 mM BA, and (d) DNA+1 mM BA
Fig. 5 ITC titration calorimetry curve of 5 mM BA binding to 0.5 mM ct-DNA in double-distilled water (T=25 °C). Top panel shows the differ-ential power of the experiment. Bottom panel shows integrated heat change after each injection of BA
1800 cm−1, several marker bands and shifts are tabulated in Table 1. The peaks at 1715, 1663, 1604, and 1496 cm−1 correspond to the vibrations of guanine (G), thymine (T), adenine (A), and cytosine (C), respectively [26]. When 1 mM BA is added to the DNA mixture, the cytosine band at 1496 cm−1shifts to 1499 cm−1. In addition, a number of peaks around 1400–1500 cm−1disappear upon the addition of
BA (Fig. 4). The spectral features for nitrogenous bases, however, are overall similar to free DNA, which suggests that BA does not intercalate between DNA strands. Peaks at 1231 and 1082 cm−1 are attributed to phosphate asymmetric and symmetric stretching, and the band at 1231 cm−1gradually shifts to 1239 cm−1for increasing concentrations of BA. This phosphate asymmetry band is one of the markers for B-DNA conformation, and its shift may be attributed to a distortion in the conformation of DNA, which supports our CD spectros-copy observations. The only change in the phosphate symme-try peaks is a 1 cm−1shift in the DNA–0.25 mM BA complex. The sugar band at 1055 cm−1shifts to 1049 or 1053 cm−1in the presence of high concentration of boric acid. Despite minor shifts in those regions, our data suggests that the main binding target of BA is deoxyribose, as evidenced by a major shift from 891 to 881 cm−1that appears in the deoxyribose band following the addition of boric acid. Another B confor-mation peak at 825 cm−1 slightly shifts to 822, 824, and 821 cm−1 in 0.25, 0.5, and 1 mM BA–DNA mixtures, respectively.
Isothermal Titration Calorimetry
Isothermal titration calorimetry (ITC) is a powerful tool for direct determination of thermodynamic parameters (ΔH, ΔG, andΔS) associated with binding reactions, stoichiometry of interaction between two molecules (n), and binding affinity (KA) [21]. Several reports in literature detail ITC-based
quan-titative measurements of interactions between biological mac-romolecules, such as proteins [30–35] or DNA [36–39] and metal ions. In this work, ITC was utilized to characterize the thermodynamics of boric acid binding to ct-DNA. 5 mM BA in double-distilled water was titrated into 0.5 mM ct-DNA; the thermogram obtained is shown in Fig.5. As it is known that metal ions can competitively bind to Tris [40], double-distilled water was utilized as solvent. Our results suggest that the number of binding sites for the BA–ct-DNA complex forma-tion is 0.2. Because the BA–ct-DNA interacforma-tions do not involve the formation of a 1:1 bound complex, a sigmoidal plot could not be fully fitted with the one-site binding model, but a partial fit has been obtained. Furthermore, our ITC results demonstrated that the rapid saturation of the BA–ct-DNA complex resulted from the high initial molarity of BA. Enthalpy change in calories per mole was found to be−920.6 (±1.44), which revealed the binding reaction is exothermic, and the affinity constant Ka was found to be 9.54 × 10⁴
(±1.51×10⁴) (M−1). The reaction was enthalpically driven with a slightly favorable contribution from an entropy change (ΔS 5.97 cal/K.mol). Based on Eq. (1), the Gibb’s free energy (ΔG) change was −28.416 kJmol−1.
Conclusions
In this report, we describe the binding properties of boric acid to calf thymus DNA.
Hyperchromic shifts observed in UV–Vis results of ct-DNA–boric acid complexes indicate that boric acid is capable of DNA binding which is further supported by TEM obser-vations. Our FT-IR data indicates that deoxyribose sugar of DNA is the main target for binding of boric acid to ct-DNA. Additionally, CD data indicated that although the secondary structure of DNA was not so much influenced after the treat-ment with low concentrations of BA, DNA degradation occurred at high concentrations. The study presented here provided further evidence for a moderately strong interaction between BA and ct-DNA.
Our investigation of the BA–DNA binding mechanism is of considerable importance for the synthesis of novel boric acid-based bioactive molecules and therapeutic agents for cancer treatment. However, more sensitive methods like nu-clear magnetic resonance (NMR) and X-ray photoelectron spectroscopy (XPS) should be used to further investigate the unique binding mode of boric acid to ct-DNA. While the biochemical analysis of the association between BA and ct-DNA is important to demonstrate the therapeutic potential of boric acid, cellular uptake of boric acid in cancer cells is being elucidated in our laboratory in order to identify the major targets of boric acid.
Acknowledgments The authors are thankful to the Turkish National Boron Research Institute (BOREN, Ankara, Turkey), for the financial support through Research Grant No. 2012.ç0356 and to A. D. Özkan and Z. Erdoğan for their help in conducting the experiments described. We also thank Middle East Technical University Central Laboratory for their expert help in the acquisition of transmission electron microscopy im-ages. A.Ö. is supported by TUBITAK BIDEB (2211) PhD fellowship.
References
1. Grimes RN (2004) Boron clusters come of age. J of Chem Educ 81: 657–672
2. Barth RF, Coderre JA, Vicente MG, Blue TE (2005) Boron neutron capture therapy of cancer: current status and future prospects. Clin Cancer Res 11:3987–4002
3. Tabassum S, Sharma GC, Arjmand F (2010) DNA interaction studies of new nano metal based anticancer agent: validation by spectroscop-ic methods. Nanotechnology 21:1–9
4. Kabalka GW (1998) Recent developments in boron neutron capture therapy. Expert Opin Ther Pat 8:445–551
5. Chen W, Mehta SC, Lu DR (1997) Selective boron drug delivery to brain tumors for boron neutron capture therapy. Adv Drug Deliv Rew 26:231–247
6. Low LY, Hernández H, Robinson CV, O'Brien R, Grossmann JG, Ladbury JE et al (2002) Metal-dependent folding and stability of nuclear hormone receptor DNA-binding domains. J Mol Biol 319: 87–106
7. Shelly K, Feaks DA, Hawthorne MF, Schmidt PG, Kritsch TA, Bauer WF (1992) Model studies directed toward the boron neutron capture therapy of cancer: boron delivery to murine tumors with liposomes. Proc Natl Acad Sci U S A 89:9039–9043
8. Lu DR, Mehta SC, Chen W (1997) Selective boron drug delivery to brain tumors for boron neutron capture therapy. Adv Drug Deliv Rev 26:231–247
9. Barranco WT, Eckhert CD (2004) Boric acid inhibits human prostate cancer cell proliferation. Cancer Lett 216:21–29
10. Barranco WT, Eckhert CD (2006) Cellular changes in boric acid-treated DU-145 prostate cancer cells. British J of Cancer 94:884–890 11. Meacham SL, Elwell KE, Ziegler S, Carper SW (2007) Advances in
plant and animal boron nutrition. Springer, Netherlands
12. Scorei R, Ciubar R, Ciofrangeanu CM, Mitran V, Cimpean A, Iordachescu D (2008) Comparative effects of boric acid and calcium fructoborate on breast cancer cells. Biol Trace Elem Res 122:197–205 13. Weser U (1967) Chemistry and structure of some borate polyol
compounds of biochemical interest. Struct Bond 2:160–180 14. Gabel D, Foster S, Fairchild RG (1987) The Monte Carlo simulation
of the biological effect of the 10B(n, alpha)7Li reaction in cells and tissue and its implication for boron neutron capture therapy. Radiat Res 111:14–25
15. Rodríguez-Pulido A, Aicart E, Llorca O, Junquera E (2008) Compaction process of calf thymus DNA by mixed cationic-zwitterionic liposomes: a physicochemical study. J Phys Chem B 112:2187–2197
16. Ramakrishnan S, Suresh E, Riyasdeen A, Akbarsha MA, Palaniandavar M (2011) DNA binding, prominent DNA cleavage and efficient anticancer activities of tris(diimine)iron(II) complexes. Dalton Trans 40:3524–3536
17. Milyutin AV, Amirova LR, Kolla VE, Nazmetdinov FY, Drovosekova LP, Andreichikov YS (1998) Synthesis and study of antiinflammatory and analgesic activity ofβ-aroylpyruvoyl hydra-zides of 2-methy(phenyl)-4-quinolinecarboxylic acids. Pharm Chem J 32:422–424
18. Moreira BG, You Y, Behlke MA, Owczarzy R. (2005) Effects of fluorescent dyes, quenchers, and dangling ends on DNA duplex stability. Biochem Biophys Res Comm 327:473-84.
19. Barreleiro PCA, Lindman B (2003) The kinetics of DNA–cationic vesicle complex formation. J Phys Chem B 107:6208–6213 20. Esposito D, Vecchio PD, Barone G (1997) Interactions with natural
polyamines and thermal stability of DNA. A DSC study and a theoretical reconsideration. J Am Chem Soc 119:2606–2613 21. Jelesarov I, Bosshard HR (1999) Isothermal titration calorimetry and
differential scanning calorimetry as complementary tools to investigate the energetics of biomolecular recognition. J Mol Recognit 12:3–18 22. Theophanides T (1981) Fourier transform infrared spectra of calf
thymus DNA and its reactions with the anticancer drug cisplatin. Appl Spectrosc 35:461–465
23. Yang D, Wang AH-J (1996) Structural studies of interactions be-tween anticancer platinum compounds and DNA. Prog Biophy Mol Biol 66:81–111
24. Arjmand F, Parveen S, Afzal M, Toupet L, Ben HT (2012) Molecular drug design, synthesis and crystal structure determination of CuII-SnIV heterobimetallic core: DNA binding and cleavage studies. Eur J Med Chem 49:141–150
25. Chitrapriya N, Jang YJ, Kim SK, Lee H (2011) Non-intercalative binding mode of bridged binuclear chiral Ru(II) complexes to native duplex DNA. J Inorg Biochem 105:1569–1575
26. Jangir DK, Charak S, Mehrotra R, Kundu S (2011) FTIR and circular dichroism spectroscopic study of interaction of 5-fluorouracil with DNA. J Photochem Photobiol B 105:143–148
27. Panja S, Jana B, Aich P, Basu T (2008) In vitro interaction between calf thymus DNA and Escherichia coli LPS in the presence of divalent cation Ca2+. Biopolymers 89:606–613
28. Kypr J, Vorlícková M (2002) Circular dichroism spectroscopy re-veals invariant conformation of guanine runs in DNA. Biopolymers 67:275–277
29. Zaludová R, Zákovská A, Kasparková J, Balcarová Z, Kleinwächter V, Vrána O et al (1997) DNA interactions of bifunctional dinuclear platinum(II) antitumor agents. Eur J Biochem 246:508–517 30. Morales KA, Lasagna M, Gribenko AV, Yoon Y, Reinhart GD, Lee
JC et al (2011) Pb2+ as modulator of protein-membrane interactions. J Am Chem Soc 133:10599–10611
31. Divsalar A, Damavandi SE, Saboury AA, Seyedarabi A, Moosavi-Movahedi AA (2012) Calorimetric and spectroscopic investigations ofβ-lactoglobulin upon interaction with copper ion. J Dairy Res 79: 209–215
32. Liu G, Xu H, Zhang L, Zheng Y (2011) Fe binding properties of two soybean (Glycine max L.) LEA4 proteins associated with antioxidant activity. Plant Cell Physiol 52:994–1002
33. Murai MJ, Sassonia RC, Zamboni AH, Conte FF, Martins-de-Souza D, Aparicio R et al (2008) Characterization of the C-terminal half of human juvenile myoclonic epilepsy protein EFHC1: dimer formation blocks Ca2+ and Mg2+ binding to its functional EF-hand. Arch Biochem Biophys 477:131–138
34. José TJ, Conlan LH, Dupureur CM (1999) Quantitative evaluation of metal ion binding to PvuII restriction endonuclease. J Biol Inorg Chem 4:814–823
35. Sacco C, Skowronsky RA, Gade S, Kenney JM, Spuches AM (2012) Calorimetric investigation of copper(II) binding to Aβ peptides: thermodynamics of coordination plasticity. J Biol Inorg Chem 17: 531–541
36. Prislan I, Khutsishvili I, Marky LA (2011) Interaction of minor groove ligands with G-quadruplexes: thermodynamic contributions of the number of quartets, T-U substitutions, and conformation. Biochimie 93:1341–1350
37. Bhattacharjee AJ, Ahluwalia K, Taylor S, Jin O, Nicoludis JM, Buscaglia R et al (2011) Induction of G-quadruplex DNA structure by Zn(II) 5,10,15,20-tetrakis(N-methyl-4-pyridyl)porphyrin. Biochimie 93:1297–1309
38. Shukla S, Sastry M (2009) Probing differential Ag+-nucleobase interactions with isothermal titration calorimetry (ITC): towards pat-terned DNA metallization. Nanoscale 1:122–127
39. Wu J, Du F, Zhang P, Khan IA, Chen J, Liang Y (2005) Thermodynamics of the interaction of aluminum ions with DNA: implications for the biological function of aluminum. J Inorg Biochem 99:1145–1154
40. Zhang Y, Wilcox DE (2002) Thermodynamic and spectroscopic study of Cu(II) and Ni(II) binding to bovine serum albumin. J Biol Inorg Chem 7:327–337