Selection of our books indexed in the Book Citation Index in Web of Science™ Core Collection (BKCI)
Interested in publishing with us?
Contact [email protected]
Numbers displayed above are based on latest data collected. For more information visit www.intechopen.com Open access books available
Countries delivered to Contributors from top 500 universities
International authors and editors
Our authors are among the
most cited scientists
Downloads
We are IntechOpen,
the world’s leading publisher of
Open Access books
Built by scientists, for scientists
12.2%
118,000
130M
TOP 1%
154
Laboratory Approach to Anemia
Ebru Dündar Yenilmez and Abdullah Tuli
Additional information is available at the end of the chapter http://dx.doi.org/10.5772/intechopen.70359
© 2016 The Author(s). Licensee InTech. This chapter is distributed under the terms of the Creative Commons Attribution License (http://creativecommons.org/licenses/by/3.0), which permits unrestricted use, distribution, and reproduction in any medium, provided the original work is properly cited.
Ebru Dündar Yenilmez and Abdullah Tuli
Additional information is available at the end of the chapter
Abstract
Anemia is a major cause of morbidity and mortality worldwide and can be defined as a decreased quantity of circulating red blood cells (RBCs). The epidemiological studies suggested that one-third of the world’s population is affected with anemia. Anemia is not a disease, but it is instead the sign of an underlying basic pathological process. However, the sign may function as a compass in the search for the cause. Therefore, the prediag-nosis revealed by thorough investigation of this sign should be supported by laboratory parameters according to the underlying pathological process. We expect that this review will provide guidance to clinicians with findings and laboratory tests that can be followed from the initial stage in the anemia search.
Keywords: anemia, complete blood count, red blood cell indices, reticulocyte
1. Introduction
Anemia, the meaning of which in Greek is “without blood,” is a relatively common sign and symptom of various medical conditions. Anemia is defined as a significant decrease in the count of total erythrocyte [red blood cell (RBC)] mass, although this definition is rarely used in clinical settings. According to the World Health Organization, anemia is a condition in which the number of red blood cells (RBCs, and consequently their oxygen-carrying capacity) is insufficient to meet the body’s physiologic needs [1, 2]. The individual variation such as a person’s age, gender, residential elevation above sea level (altitude), and different stages of pregnancy changes the specific physiologic requirements of the body. Anemia is not a dis-ease, but is instead the sign of an underlying basic pathological process. Nonetheless, the sign may function as a compass in the search for the cause, as well as function as a road marker
© 2018 The Author(s). Licensee InTech. This chapter is distributed under the terms of the Creative Commons Attribution License (http://creativecommons.org/licenses/by/3.0), which permits unrestricted use, distribution, and reproduction in any medium, provided the original work is properly cited.
in the investigation of underlying pathological process [3]. Hence, the diagnosis according to the symptoms obtained by history and physical examination of patients with anemia should be supported by laboratory parameters related to the underlying pathological cause. The first step in the diagnosis of anemia is detection with predictive, accurate tests so that important clues to underlying disease are not missed and patients are not subjected to unnecessary tests for and treatment of nonexistent anemia. Instead, clinicians rely on several other measures to identify the degree and the cause of anemia in a given patient.
The purpose of this chapter is to discuss the clinical approaches with which a practicing physician is able to evaluate a patient with underlying anemia.
2. Classification of anemia
Based on determination of the red blood cell mass, anemia can be classified as either relative or absolute. Relative anemia is characterized by a normal total red blood cell mass in an increased plasma volume, resulting in a dilution anemia, a disturbance in plasma volume regulation. However, dilution anemia is of clinical and differential diagnostic importance for the hema-tologist [4]. Classification of the absolute anemias with decreased red blood cell mass is dif-ficult because the classification has to consider kinetic, morphologic, and pathophysiologic interacting criteria. Anemia of acute hemorrhage is not a diagnostic problem and is usually a genitourinary or gastrointestinal event, not a hematologic consideration.
Initially, anemias should be classified into two groups as diminished production and increased destruction of RBCs. The number of reticulocytes is a remarkable parameter in the materialization of this classification. Then, diagnostic analysis is able to be based upon both morphologic and pathophysiological hallmarks.
Anemias can morphologically be classified into three subgroups as macrocytic, normocytic, and microcytic hypochromic anemias. This classification is based on mean corpuscular vol-ume (MCV) and mean corpuscular hemoglobin concentration (MCHC) of complete blood count (CBC) and aids the physician to the diagnosis and monitoring of anemias that can be easily cured, such as deficiency of vitamin B12, folic acid, and iron.
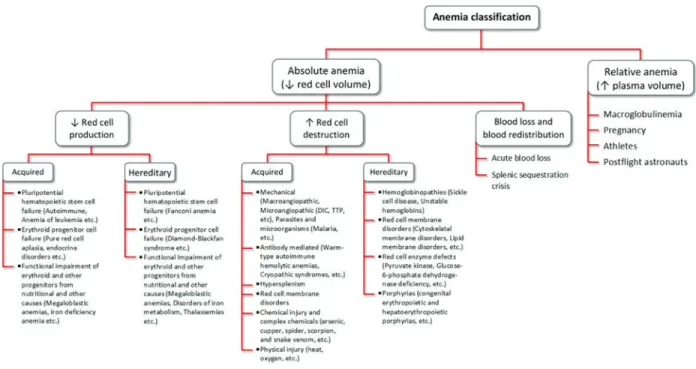
Pathophysiologic classification is best suited for relating disease processes to potential treat-ment (Figure 1). In addition, anemia resulting from vitamin- or iron-deficiency states occurs in a significant proportion of patients with normal red blood cell indices.
Each step indicated in Figure 1 can be disrupted and cause anemia. Identifying the affected step is important for therapeutic intervention and specific treatment. The limitation of pathophysiologic classification is that pathogenesis involves several steps in most anemias. Therefore, the provided chapter is a guideline for the practical understanding of the processes underlying the production and destruction of RBCs. Despite all these morphological clas-sification is more useful in terms of convenience and clinical usage. Hence, morphological classification serves to support the diagnosis and indirectly treatment in connection with the laboratory and clinic. The major limitation of such a classification is that it tells nothing about the etiology or reason for the anemia [5].
3. Laboratory evaluation
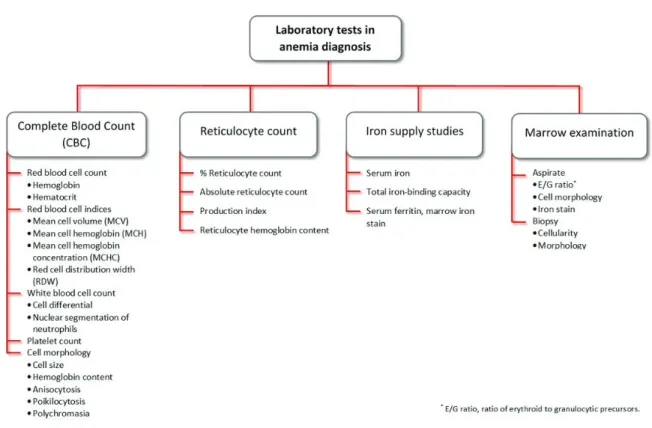
A comprehensive laboratory evaluation is required for definitive diagnosis and treatment for any anemia, although the anamnesis (history of patient) and physical examination of the patient may indicate the presence of anemia and propose its cause. As appropriate to this aim, the various tests for the diagnosis of anemia are done with routine hematological tests such as CBC and reticulocyte counts as well as studies of iron status that serve as a leaping point to the diagnosis (Figure 2). When the diagnosis of specific anemic conditions is confirmed, a large number of other specific tests are used [6]. Laboratory tests used in the diagnosis of ane-mia are roughly summarized in Figure 2. The laboratory investigation of aneane-mias involves the quantitative and semiquantitative measurements of RBCs and supplementary testing of blood and body fluids. The laboratory results obtained from these parameters are important arguments in the diagnosis, treatment, and monitoring of the anemias.
3.1. Complete blood count
Prior to the development of modern hematology blood analyzers, blood counts included hemoglobin (Hb) concentration, white blood cell (WBC) count, and manual platelet count. The other parameters like mean corpuscular volume (MCV) had to be mathematically calculated by using the measured parameters such as Hb, RBC count, and hematocrit (Hct). Modern ana-lyzers provide CBC indices by using various physical and chemical methods such as electronic impedance, laser light scattering, light absorption, and staining properties [7].
How will CBC parameters such as Hb concentration, Hct, RBC count, MCV, MCHC, WBC count, platelet count, and other parameters related to formed elements of blood measured by modern blood analyzers help the diagnosis or management of the patient? CBC identifies
several different parameters and can provide a great deal of information. Hematologic and biochemical variations of red blood cells determine whether the patient is anemic or not. If anemia is present, MCV is likely to provide clues about the cause of anemia. While an infection can lead to increased WBC, lymphocytosis can be seen in viral infections (but not always so). Abnormal size or number of platelets may be either due to the direct effect of any underlying blood disease or may simply be the reflection of the presence of some other underlying pathol-ogies. Because of all these, CBC parameters obtained as a result of clinical evaluation should be reassessed more carefully and curiously [7]. Therefore, the fundamental parameters of CBC such as Hb concentration, RBC, Hct, MCV, mean corpuscular hemoglobin (MCH), MCHC, and red blood cell distribution width (RDW) which plays an important role in the diagnosis, treatment, and monitoring of the anemic patient will be explained below.
3.2. Hemoglobin concentration
Determination of Hb is a part of CBC. Hemoglobin is intensely colored, and this property has been used in methods for estimating its concentration in the blood. Erythrocytes contain a mixture of hemoglobin, oxyhemoglobin, carboxyhemoglobin, methemoglobin, and minor amounts of other forms of hemoglobin [4].
Monitoring the response to treatment of anemia and to evaluate polycythemia, Hb concentration is used to screen for diseases associated with anemia and to determine the severity of anemia [6]. Finding an increased Hb concentration requires a systematic clinical approach for differential diagnosis and further investigation. The conditions such as polycythemia vera, congestive heart failure, chronic obstructive pulmonary disease, etc., can cause Hb levels to rise.
Decreased Hb levels are found in anemia. Hb must be evaluated along with the RBC and Hct.
In iron deficiency, hemoglobinopathies, pernicious anemia, liver disease, hypothyroidism, hemorrhage (chronic or acute), hemolytic anemia (caused by transfusions, reactions to chemi-cal or drugs, infectious and physichemi-cal agents), and various systemic diseases (e.g., Hodgkin’s disease, leukemia, etc.), decrease in Hb levels can be observed.
Variations in Hb levels occur after hemorrhages, transfusions, and burns (Hb and Hct are both high during and immediately after hemorrhage). Hb and Hct supply valuable information in an emergency situation [8].
Excessive fluid intake, pregnancy, and drugs, etc., which cause increase in plasma volume and decrease the Hb values, are interfering factors. Drugs such as methyldopa and extreme physi-cal exercise can give rise to increased Hb levels. In addition, people living in high altitudes have increased Hb concentration, Hct, and RBC count [8].
3.3. Red blood cell count
The quantification of the percentage of microcytic and hypochromic RBCs has proved its clinical usefulness in the differential diagnosis of microcytic anemia [9]. RBC count has been recognized as the most efficient single classical measurement in the differential diag-nosis of microcytic anemia [10]. Iron-deficient erythropoiesis is characterized by the pro-duction of RBC with a decrease in Hb content, so a high percentage of hypochromic cells are present.
In β-thalassemia cases, increased RBC count is a characteristic as a result of chronic increase in erythropoiesis. Therefore, MCV and MCH are lower in beta thalassemia than in iron deficiency anemia [11].
3.4. Hematocrit
The word hematocrit, also called packed cell volume (PCV), means “to separate blood,” which underscores the mechanism of the test, because the plasma and blood cells are separated by centrifugation [6].
Decreased Hct values are an indicator of anemia, in which there is a reduction in the Hct. An
Hct ≤30% means that the patient is severely anemic. Decreased values also occur in leukemias, lymphomas, Hodgkin’s disease, adrenal insufficiency, chronic diseases, acute and chronic blood loss, and hemolytic reactions (transfusions, chemical, drug reactions, etc.).
Increased Hct values are observed in erythrocytosis, polycythemia vera, and shock (when
hemoconcentration rise) [4].
Interfering factors such as pregnancy, age, sex, and dehydration have different effects in Hct.
People living in high altitudes have increased Hct values and RBC count. Hct decreases in the physiologic hydremia of pregnancy. Hct varies with age and gender. Hct levels are lower in men and women older than 60 years of age. Severe dehydration from any cause falsely increases the Hct value [8, 12].
4. Red blood cell indices
The size and hemoglobin content of erythrocytes (red blood cell indices), based on popu-lation averages, have traditionally been used to assist in the differential diagnosis of ane-mia [13]. Some red blood cell parameters (for instance, RBC count, Hb concentration, MCV, RDW) are directly measured, while the others (e.g., Hct, MCV, MCHC) are derived from these primary measurements [14]. These measurements are provided by any of the common automated instruments. Instruments vary somewhat in their technologies. The most com-monly used method is either a combination of a highly focused light source, an electric field, and a laser-based flow cytometry or a radiofrequency wave to discriminate between cells. Automated instruments are not only fast but extremely accurate. The coefficient of variation (measurement error) of an automated counter is usually less than 2%, and each of the major measurements, including the hemoglobin level, red blood cell count, and mean corpuscular volume, can be standardized independently with commercial red blood cell and hemoglobin standards [4, 6, 12].
4.1. Mean corpuscular volume (MCV)
MCV has been used to guide the diagnosis of anemia in patients, for example, testing patients with microcytic anemia for iron deficiency or thalassemia and those with macrocytic anemia for deficiency of folate or vitamin B12 [4, 15].
The reference value of MCV ± 2 SD is 90 ± 9 fL and generally coincides with the peak of the Gaussian distribution of RBC size. Although MCV is both accurate and highly reproducible, errors may be introduced by RBC agglutination, distortions in cell shape, the presence of very high numbers of WBCs, and sudden osmotic swelling [8]. MCV results are the basis of the classification system used to evaluate an anemia (Table 1, Figure 3).
Increased reticulocytes and marked leukocytosis can also increase MCV [8]. The mixed popula-tion of microcytes and macrocytes results in normal MCV values and is an interfering factor in evaluating MCV.
4.2. Mean corpuscular hemoglobin (MCH)
MCH, the amount of hemoglobin per red blood cell, increases or decreases in parallel with MCV and generally provides similar diagnostic information. Because this parameter is affected by both hypochromia and microcytosis, it is least sensitive as MCV in detecting iron deficiency states [16].
The reference value of MCH is 32 ± 2 pg. This is an excellent measure of the amount of hemo-globin in individual red blood cell. Patients with iron deficiency or thalassemia who are unable to synthesize normal amounts of hemoglobin show significant reductions in the MCH [8, 17]. An increase of MCH is associated with macrocytic anemia; a decrease of MCH is associated with microcytic anemia.
Microcytic anemias (MCV 50–79 fL)
• Disorders of iron metabolism Iron deficiency anemia, anemia of chronic disease, congenital hypochromic-microcytic anemia with iron overload
• Disorders of porphyrin and heme synthesis Acquired sideroblastic anemias, idiopathic refractory sideroblastic anemia
• Disorders of globin synthesis Thalassemias, hemoglobinopathies, characterized by unstable hemoglobins
Normocytic normochromic anemia (MCV 80–98 fL)
• Anemia with appropriate bone marrow response
Acute posthemorrhagic anemia, hemolytic anemia
• Anemia with impaired marrow response Aplastic anemia, pure red blood cell aplasia, myelofibrosis
Macrocytic anemias (MCV 99–150 fL)
• Cobalamin (B12) deficiency Lack of animal products, intrinsic factor deficiency, pernicious anemia, hyperthyroidism, pregnancy, enzyme deficiencies • Folate deficiency Lack of vegetables, celiac disease, hypothyroidism, folic acid
antagonists, hemodialysis
• Unresponsive to cobalamin or folate Metabolic inhibitors (i.e., 6-mercaptopurine), inborn errors (Lesch-Nyhan syndrome)
Table 1. Classification and possible diagnosis of anemia according to MCV in clinical use [8].
Hyperlipidemia is one of the interfering factors of MCH because it falsely increases MCH values. WBC counts >50,000/mm3 also falsely provide increased level for MCV as well as for
Hb. In addition, high heparin concentrations also falsely elevate MCH value [8].
4.3. Mean corpuscular hemoglobin concentration (MCHC)
MCHC is not used frequently for diagnostic purpose, but is primarily useful for quality con-trol purposes, such as detecting sample turbidity. Because MCHCs are average quantities in the blood with mixed-cell populations, it is difficult for these red blood cell indices to detect abnormalities in the blood [4].
The reference value of MCHC is 33 ± 3 g/dL. The principal purpose of MCHC is to detect patients with hereditary spherocytosis who has very small, dense spherocytes in the circula-tion. These spherocytes represent cells that have lost considerable intracellular fluid because of a membrane defect. In situations such as sideroblastic anemia, recently transfused patients, patients with severe pernicious anemia with red blood cell fragmentation, and in conditions where both folate and iron deficiency are present, both large and small red blood cells are observed, which compromise the value of MCV. When present in significant numbers, they will cause MCHC to increase to levels in excess of 36 g/dL [4, 6, 15].
Decreased MCHC indicates that packed RBCs (a unit volume) contain less Hb than normal.
MCHC is decreased in hypochromic anemia (MCHC < 30 g/dL) observed in iron deficiency, microcytic anemias, chronic blood loss anemia, and some thalassemias.
Increased MCHC levels (RBCs cannot accommodate more than 37 g/dL Hb) occur in
sphero-cytosis, in newborns and infants.
Because of falsely elevating MCHC, lipemia, cold agglutinins or rouleaux, and high heparin concentrations may be among the interfering factors. MCHC cannot be greater than 37 g/dL because the RBC cannot accommodate more than 37 g/dL Hb [8].
4.4. Red blood cell distribution width (RDW)
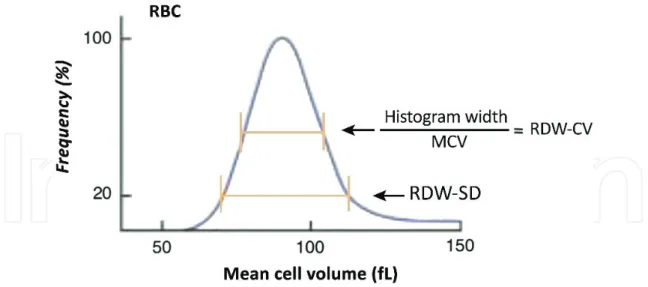
RDW is an estimate of the variance in the volume within the population of red blood cells [4]. RDW, provided by automated counters, is an index of the distribution of RBC volumes. RDW is derived from pulse height analysis and can be expressed as an SD (fL) or as a coefficient of vari-ation (%) of the red cell volume. Automated counters use two methods to calculate RDW [6]. The first is referred to as RDW-CV. RDW-CV is the ratio of the width of the red blood cell distribution curve at 1 SD divided by MCV (normal RDW-CV = 13 ± 1%) (Figure 4). Since it is a ratio, changes in either the width of the curve or MCV will influence the result. In micro-cytosis, any changes in the RDW-CV simply reduce the denominator of the ratio. Conversely, in macrocytosis the change in the width of the curve will minimize the change in RDW-CV. A second method of measuring the RDW is RDW-SD and is independent of MCV. RDW-SD is measured by calculating the width at the 20% height level of the red blood cell size distribu-tion histogram (normal RDW-SD = 42 ± 5 fL) [6, 8, 15].
Both measurements of RDW are essentially mathematical statement of anisocytosis. Increases
in the RDW suggest the presence of a mixed population of cells. Double populations, whether
microcytic cells mixed with normal cells or macrocytic cells mixed with normal cells, will widen the curve and increase the RDW. The RDW-SD is more sensitive to the appearance of minor populations of macrocytes or microcytes since it is measured lower on the red blood cell volume-distribution curve (Figure 4) [4, 8].
The RDW can be used to distinguish thalassemia (normal RDW) from iron deficiency anemia (high RDW). Also, it can be used to distinguish chronic disease anemia (normal RDW) from early iron deficiency anemia (elevated RDW). RDW increases in iron deficiency anemia, vita-min B12 or folate deficiency (pernicious anemia), abnormal Hb (S, S-C, or H), S-β thalassemia, immune hemolytic anemia, marked reticulocytosis, and posthemorrhagic anemia.
The RDW may be an alternate marker for systemic inflammation and/or oxidative stress; however, the predictive value of RDW is independent of other inflammatory markers. This suggests that this biomarker also follows other nonempirical processes [8, 17]. The determina-tion of the physiological and biological mechanisms that associate RDW to adverse clinical results is important in using these prognostic biomarkers to therapeutic decisions [18].
4.5. Stained peripheral blood smear
Peripheral blood smears can provide important additional information about RBC morphology in anemia and are easily prepared manually using glass slides. The hematology laboratory usu-ally examines a peripheral blood smear if the patient’s indices are abnormal (unless there has been no major change from previous CBCs). If an underlying blood disorder is suspected, a film should be requested. Automated instruments ensure accurate RBC counts and indices and WBC counts and differentials in both healthy and diseased individuals [8, 19].
Figure 4. Red blood cell distribution width. Automated counters provide measurements of the width of the red blood cell distribution curve. RDW-CV is calculated from the width of the histogram at 1 SD from the mean divided by MCV [6].
The peripheral blood smear complements the automated countermeasurements of MCV and MCH. Visible changes in cell diameter, shape, and hemoglobin content can be used to distinguish both microcytic and macrocytic cells from normocytic/normochromic RBCs (Table 2) [6].
In clinical cases, the variation such as staining, color, shape, and inclusion bodies in the blood smear of RBCs is not only an indication of RBC abnormalities but also a diagnosis of diseases.
4.6. Reticulocyte count
Reticulocyte count is an essential component of CBC and has a substantial role in initially clas-sifying any anemia. Reticulocytes are newly formed red blood cells with residual strands of nuclear material called “reticulin” that remain following extrusion of the nucleus from bone mar-row normoblasts [20]. The reticulocyte is a young red blood cell containing residual ribosomal RNA that can be stained with a supravital dye such as acridine orange or new methylene blue [4]. The reticulocyte count can be used in differentiation of the patients with a functionally nor-mal marrow response to anemia/hypoxia and those with a failed marrow response. Whenever the reticulocyte production index (RPI) increases to levels greater than three times normal in response to an anemia (hematocrit <30%), it can be assumed that the patient has normal renal function with an appropriate erythropoietin response and a normal erythroid marrow with an adequate supply of key nutrients (iron, folic acid, and vitamin B12) [6, 15].
The patterns of some
abnormal RBCs Comment
Macrocyte Larger than normal (>8.5 μm diameter) Microcyte Smaller than normal (<7 μm diameter)
Hypochromic Less hemoglobin in the cell. Enlarged area of central pallor
Spherocyte Loss of central pallor, stains more densely, often microcytic. Hereditary spherocytosis and certain acquired hemolytic anemias
Target cell Hypochromic with central “target” of hemoglobin. Liver disease, thalassemia, Hb D, and postsplenectomy
Leptocyte Hypochromic cell with a normal diameter and decreased MCV. Thalassemia
Elliptocyte Oval to cigar shaped. Hereditary elliptocytosis, certain anemias (particularly vitamin B12 and folate deficiency)
Stomatocyte Slit-like area of central pallor in erythrocyte. Liver disease, acute alcoholism, malignancies, hereditary stomatocytosis, and artifact
Acanthocyte Five to ten spicules of various lengths and at irregular intervals on surface of RBCs Echinocyte Evenly distributed spicules on surface of RBCs, usually 10–30. Uremia, peptic ulcer,
gastric carcinoma, pyruvate kinase deficiency, and preparative artifact Sickle cell Elongated cell with pointed ends. Hb S and certain types of Hb C
Reticulocytosis, increased RBC production, occurs when the bone marrow is replaced, is lost, or has prematurely destroyed cells. Identifying reticulocytosis is important for the recogni-tion of other clinic condirecogni-tions such as hidden chronic hemorrhage or unrecognized hemoly-sis (e.g., thalassemia, sickle cell anemia). Reticulocyte levels increase in hemolytic anemia, immune hemolytic anemia, primary RBC membrane problems, hemoglobinopathy, RBC enzyme deficits, and malaria.
Increased reticulocyte count after hemorrhage (3–4 days) or after treatment of anemias can
be used as an index for an effective treatment. In iron deficiency anemia, reticulocytes may increase to more than 20% after sufficient doses of iron. A proportional increase in reticulocytes can also be seen when pernicious anemia is treated by transfusion or vitamin B12 therapy. If there is not enough erythrocyte production in the bone marrow, the reticulocyte count decreases in untreated iron deficiency anemia and aplastic anemia, untreated pernicious anemia, anemia of chronic disease, radiation therapy, endocrine problems, tumor in the marrow (bone marrow failure), myelodysplastic syndromes, and alcoholism.
Interfering factors: Reticulocytes are normally increased in infants and during pregnancy.
Recently transfused patients have a lower count because of the dilution effect. The presence of Howell-Jolly bodies falsely elevates reticulocyte count when automated methods are used. Some other laboratory tests are useful to define the physiologic defects responsible for ane-mia. Indirect serum bilirubin and lactic dehydrogenase (LDH) levels increase in patients with increased hemolysis and in ineffective erythropoiesis. Indirect bilirubin levels correlate with RBC turnover rate. Serum LDH is exceedingly responsive to increased rates of RBC destruction (because of the excess levels of LDH 1 in RBCs) [8, 21].
Reticulocyte hemoglobin content (CHr or Ret-He) measurement demonstrates Hb synthe-sis in marrow precursors. Ret-He also reflects the early stages of iron deficiency. Ret-He is defined as an auxiliary parameter in the differential diagnosis of anemias.
5. Additional new red blood cell and reticulocyte indices
Current high-end automated cell counters measure unique properties of mature red blood cells and reticulocytes on a cell-by-cell basis, not just as population averages. This results a plethora of new indices that are in many cases specific to an instrument manufacturer, pre-senting diagnostic opportunities but also a confusing nomenclature and a potential lack of comparability. Some examples of parameters that have been studied include hypochromic erythrocytes (HypoHe%), percentage microcytic red blood cells (MicroR%), reticulocyte hemoglobin equivalent (Ret-He), reticulocyte hemoglobin content (CHr), red blood cell size factor (RSf), low hemoglobin density (LHD%), and fragmented red blood cells (FRCs) [22–24]. Ret-He demonstrates the real-time information on the synthesis of young RBCs in the bone marrow. Other available parameters are the percentage of RBCs with Hb content equivalent ≤17 pg (HypoHe%) and the percentage of RBCs with a volume of <60 fL (MicroR%), which reflects the subpopulation of mature RBCs exhibiting evidence of insufficient iron content [6, 8].
Estimates of reticulocyte-specific hemoglobin content (which are comparable) by light-scatter measurements of reticulocytes are closely related to adequacy of iron availability to erythroid precursors during the preceding 24–48 hours and have been described as diagnostically useful in detecting functional iron deficiency [8, 22].
The CHr may be a better predictor of depleted marrow iron stores than traditional serum iron parameters in nonmacrocytic patients and is a more sensitive predictor of iron deficiency than hemoglobin for screening infants and adolescents for iron deficiency [25, 26].
Schistocytes or FRC is also used as new red blood cell indices. Nevertheless only a few
studies have been published on this parameter, but concerns have been expressed for false positivity in the presence of hypochromic samples. Schistocytes are elevated in thrombotic microangiopathies [1].
5.1. Marrow examination
Bone marrow examination has a special place in the cause of anemia since it is the organ of blood production [20]. The marrow examination is of greatest value in patients who fail to show an appropriate increase in the reticulocyte production index in response to anemia. A sample of the marrow can easily be obtained by needle aspirate or biopsy to evaluate overall cellularity, the ratio of erythroid to granulocytic precursors (E/G ratio), and cellular morphol-ogy. In these patients defects in erythroid precursor proliferation or maturation play a major role. Examination of any marrow aspirate should include a careful assessment for evidence of a red blood cell maturation abnormality, especially changes in cell size, nuclear morphology, and hemoglobin production. A number of anemias are characterized by distinct abnormalities in the maturation sequence and the morphology at each stage of maturation [6]. The assess-ment of the bone marrow is the gold standard in iron deficiency. The presence of the mineral in reticuloendothelial cells is the key to the diagnosis [20].
5.2. Tests of iron
Iron supply tests (serum iron level, transferrin iron-binding capacity, and serum ferritin level) play an important role in the initial differential diagnosis of an anemia. They are essential components to the marrow iron stain whenever a marrow aspirate is performed [8, 22, 25].
1. Serum iron levels. This is serum iron (SI) measurement which reflects an amount of iron
bound to transferrin. The reference range of SI level is 50–150 μg/dL for an individual. The proliferative capacity of the erythroid marrow and its ability to synthesize hemoglobin are assessed by serum iron level [6].
2. Total iron-binding capacity (TIBC). The amount of iron which is bound to transferrin is
called TIBC. Actually, it is equivalent to measuring the level of transferrin. The reference value of TIBC is 300–360 μg/dL. TIBC increases in excess of 360 μg/dL in patients with severe iron deficiency.
3. Serum ferritin level. Ferritin is a spherical protein and is used clinically to evaluate total body
storage iron (body iron stores). A normal adult male has a serum ferritin level of between 50 and 150 μg/L, reflecting iron stores of 600–1000 mg. Serum ferritin levels decrease when the
iron stores are depleted. Levels below 10–15 μg/L indicate iron deficiency due to exhaustion of iron store [6].
5.3. Other measurements
For the diagnosis of specific hematopoietic disorders, there are some other laboratory tests.
Table 3 demonstrates some of the special assays for such disorders [1, 4].
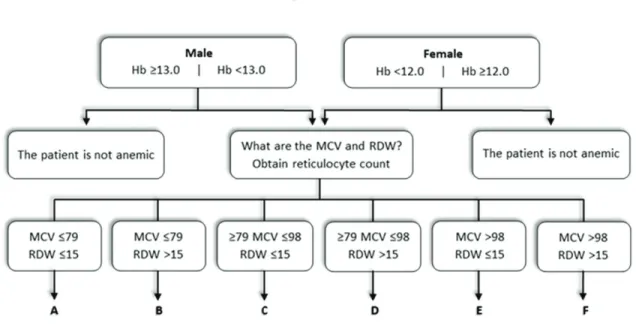
The flowchart that follows is intended as a first approach for the diagnosis of anemia and is a supplement to this chapter to demonstrate how the steps might be placed in a logical order (Figure 3).
5.4. Evaluation and investigation of the patient with anemia according to laboratory parameters
A CBC and differential and reticulocyte counts together with stained peripheral blood smear examination should be the starting point of investigations. These confirm the clinical suspi-cion of anemia and direct further investigation [5].
The points to be followed in Figure 5 (A–F) may help to begin anemia investigation:
A. Check RBC status of the patient.
The RBC performs some functions such as transportation of O2 and CO2. An increase in RBC is referred as polycythemia. Patient may have α- or β-thalassemia. Confirm abnormal hemo-globins with electrophoresis, Hb A2 value in β-thalassemia will be >3.5%, check if there are target cells, etc. A decrease in RBC accounts for less hemoglobin. If RBC count is low, patient iron status should be checked (iron, TIBC, Sat%, ferritin, etc.).
B. If red blood cell morphology demonstrates schistocytes.
1. Red blood cell fragmentation can be investigated. Fragmented red blood cells (FRCs)
and hemolysis occur when RBCs get stressed through partial vascular occlusions or over
Hypoproliferative anemias Maturation disorders Hemolytic anemias
*Cytometric assay of CD59/CD55 levels (paroxymal nocturnal hemoglobinuria)
*Chromosomal analysis (leukemias) *Marrow aspirate/biopsy special stains
• Trichrom stain, silver stain for reticulin (myelofibrosis)
*Serum vitamin B12 level (vitamin B12 deficiency)
*Serum RBC folate level (folic acid deficiency)
*Hb electrophoresis (abnormal hemoglobins)
*Hb A2 level-HPLC (β-thal) *Hb F level-HPLC (β-thal) RBC protoporphyrin level (iron deficiency) Brillant aresyl blue stain
*Hb electrophoresis and HPLC (hemoglobinopathies)
*Coombs test (autoimmune hemolytic anemia)
*Cold aglutinin titer
(autoimmune hemolytic anemia) *Haptoglobin level (hemolysis) *G6PD screen (G6PD deficiency)
abnormal vascular surfaces. “Split” RBCs, or schistocytes, are considered on peripheral blood smears under these conditions; significant quantities of lactate dehydrogenase are released into the blood from injured RBCs [4].
2. The ethnicity of the patient is important for this situation.
Check the patient for sickle cell disease (SCD). If the patient is normal for SCD, investigate iron deficiency anemia.
C. Screen for uncorrected reticulocyte count.
Reticulocyte count and indices: Reticulocytes are stained by supravital staining. Typical normal range is 0.5–1.5%. The count depends on total RBC count [12]. For both the pathophysiological classification of anemia and to monitor marrow response after therapeutic interventions, reticu-locyte count is clinically important [11, 19].
Reticulocyte count was used in the clinical and laboratory practice for a long time due to three main factors: technical limitations in the detection of cell, the imprecision of manual microscopic method, and high coefficient of variations in counts [28, 29]. The index is the corrected value in relation to total red blood cell mass and Hb%. Increased count indi-cates increased red blood cell turnover. Reticulocyte count can be used as a measure of red blood cell production by correcting red blood cell count for both changes in hematocrit. The result of correction reflects the effect of erythropoietin on reticulocyte release from the marrow [6].
Obtain single correction reticulocyte count (reticulocyte index) (S):
S = Reticulocyte count × (Patient Hct / 0.45) (1)
Double-corrected reticulocyte count or reticulocyte production index (RPI) is calculated by dividing the single correction reticulocyte count by the maturation index.
In situations where the reticulocyte count is elevated, other possibilities should be inves-tigated, for example, serum haptoglobin and hemopexin, which are degraded hemo-globin-bound complexes, are impaired and can’t be monitored in acute intravascular hemolysis. Unconjugated bilirubin in serum and urobilinogen in urine should be also mea-sured. Unconjugated hyperbilirubinemia in the absence of urobilirubinogen in urine is a marker of hemolysis [12].
If reticulocyte production index (RPI) is ≥3, peripheral blood smear should be examined for abnormal morphology, and the values of bilirubin, LDH, serum-free Hb, urine Hb, urine hemosiderin, and haptoglobin should be evaluated.
If Haptoglobin is >40 mg/dL, the patient probably has/had an acute hemorrhage or is respond-ing to hematinic. Patient should be evaluated for external or internal bleedrespond-ing.
If Haptoglobin is <30 mg/dL, probably the patient has hemolytic anemia. Bilirubin is usually between 1.0 and 5.0 mg/dL. Mostly indirect bilirubin is present.
Screen for uncorrected reticulocyte count if the patient has any morphological abnormalities screen for uncorrected reticulocyte count.
Often, the etiology of a patient’s anemia can be determined if the shape or size of RBCs is altered or if they include inclusion bodies (Table 2). Plasmodium falciparum malaria is sug-gested by the presence of more than one ring form in an RBC, and the infection produces pan-hemolysis of RBCs of all ages [30].
D. If normocytic, heterogeneous anemia is present.
The levels of ferritin and RBC folate/vitamin B12 should be examined to confirm/exclude the possible early diagnosis of iron deficiency anemia, sideroblastic or megaloblastic anemia, mixed deficiency, and myeloproliferative disorder. Serum transferrin receptor, homocysteine, and methylmalonic acid levels can be also considered.
E. Check pyruvate kinase and glucose-6-phosphate dehydrogenase (G6PD) enzyme.
In severe hemolytic anemia, spherocytosis and RBC fragmentation may be seen in the stained film. Although drug-induced hemolysis may indicate “bite cells” in the blood of patients with G6PD deficiency, this may not always be associated with G6PD deficiency because such cells are generally not found in patients with acute hemolytic conditions of chronic G6PD vari-ants or patients with chronic hemolytic G6PD deficiency [4]. Repeat the history and physical examination for splenomegaly.
F. If macrocytic, heterogeneous anemia is present.
The pattern of folate or vitamin B12 of the patient should be checked. The homocysteine, meth-ylmalonic acid, LDH, and indirect bilirubin values can be investigated. It is necessary to eval-uate the intrinsic factor and parietal cell antibody to confirm or exclude pernicious anemia.
Figure 5. Flowchart as a first approach to diagnose anemia. In anemic patients, approaches should follow according to
The proper use and interpretation of laboratory tests are important in the diagnosis and treat-ment of anemia. Whether the patient is anemic can be determined by using Hb, Hct, or RBC count and the reference intervals for age and sex or the patient’s previous values [31]. Routine examination of the blood includes CBC and examination of a stained peripheral blood smear. The values could be normal in mild anemia with RBC count in normal range [32].
6. Conclusion
There is no single optimal marker or test combination in the differential diagnosis of ane-mias [33]. The knowledge and experience of the physician who demands appropriate hema-tological and biochemical tests related to preliminary diagnosis have the important role in the diagnosis of anemias. It is recommended to use algorithms as a tool in determination of anemias in order to reduce the laboratory tests and accurately diagnose the underlying cause(s) in patients.
For the past decade, remarkable progress has been made in the procedures and algorithms in the differential diagnosis of anemias. CBC is the main procedure for investigating anemia. The percentage of microcytic RBCs is considered in the first step. In the second step, MCV, RDW, and RBC count should be examined. It is advocated that innovative algorithms, including parameters reflecting hemoglobinization of RBCs and reticulocytes, are integrated to improve the differentiation between anemias. Subsequently, new algorithms, including conventional as well as innovative hematological parameters, were assessed for subgroups with microcytic erythropoiesis. Nowadays automated reticulocyte counts provide new parameters to evalu-ate marrow activity [29]. It is therefore important to establish accurevalu-ate and reliable criteria for both identifying the specific causes of anemia and evaluating the impact of intervention strate-gies. These should be followed by laboratory tests that are mandatory and simple to perform.
7. Key points of this chapter
CBC is the most sensitive measure in the routine use to obtain the information about the pres-ence and severity of anemia.
For the evaluation of anemia, there are some essential basic laboratory tests such as CBC, reticulocyte count, blood smear morphology changes, iron balance studies, and bone marrow morphology reports.
Severity of the hematocrit/hemoglobin changes in MCV, RDW, and blood smear morphology are the first parameters to evaluate anemia. These help to define the anemia as normocytic, microcytic, or macrocytic.
Reticulocyte index defines the adequacy of the erythropoietin and red blood cell production response.
Bone marrow examination can also provide information about proliferative response and whether there is any defect in precursor maturation.
Iron studies should also be included in the investigation of anemia.
In conclusion, identification of the cause of anemia by the clinician with the support of laboratory data is an important step to diagnose, treat, and monitor the underlying pathological process.
Author details
Ebru Dündar Yenilmez* and Abdullah Tuli
*Address all correspondence to: [email protected]
Department of Medical Biochemistry, Faculty of Medicine, Çukurova University, Adana, Turkey
References
[1] Brugnara C, Mohandas N. Red cell indices in classification and treatment of anemias: From M.M. Wintrobes’s original 1934 classification to the third millennium. Current Opinion of Hematology. 2013;20(3):222-230
[2] WHO Scientific Group. Nutritional anemias. In: WHO Meeting; 13-17 March 1967; Geneva. Switzerland: WHO; 1968. pp. 1-28
[3] Bridges KP, Howard A. Principles of anemia evaluation. In: Bridges KP, Howard A, edi-tors. Anemias and Other Cell Disorders. 1st ed. USA: The McGraw-Hill; 2008. pp. 4-18. DOI: 10.1036/0071419403
[4] Narla M. The erythrocyte. In: Kenneth K, Marshall A, Lichtman JT, Marcel L, Oliver W, Caligiuri MA, editors. Williams Hematology. 9th ed. USA: McGraw-Hill Education; 2016. pp. 461-915. DOI: 978-0-07-183301-1
[5] Alli N, Vaughan J, Patel M. Anaemia: Approach to diagnosis. South African Medical Journal. 2016;107(1):23-27. DOI: 10.7196/SAMJ.2017.v107i1.12148
[6] Hillman R, Ault K, Leporrier M. Red blood cell disorders. In: Hillman R, editor. Hematology in Clinical Practice. 5th ed. USA: McGraw-Hill Education; 2010. pp. 10-26. DOI: 978001766531 [7] Provan D, Singer CRJ, Baglin T, Inderjeet D. Oxford Handbook of Clinical Haematology.
UK: Oxford University Press; 2009. DOI: 019922739X
[8] Fischbach FT, Dunning MB. A Manual of Laboratory and Diagnostic Tests. 8th ed. China: Wolters KluwerHealth/Lippincott W&W; 2009. 1064 p. DOI: 978-0-7817-7194-8
[9] Urrechaga E. Discriminant value of microcytic/hypochromic ratio in the differential diagno-sis of microcytic anemia. Clinical Chemistry and Laboratory Medicine. 2008;46(12):1752-1758 [10] Urrechaga E. Red blood cell microcytosis and hypochromia in the differential diagnosis of
iron deficiency and β-thalassaemia trait. International Journal of Laboratory Hematology. 2009;31(5):528-534
[11] Urrechaga E, Borque L, Escanero JF. Erythrocyte and reticulocyte parameters in iron defi-ciency and thalassemia. Journal of Clinical Laboratory Analysis. 2011;25(3):223-228. DOI: 10.1002/jcla.20462
[12] Mukherjee N. A Clinical Approach. In: Anemia. India: CME; 2004. pp. 358-363
[13] Wintrobe M. Anemia: Classification and treatment on the basis of differences in the aver-age volume and hemoglobin content of red corpuscles. Archives of Internal Medicine. 1934;54(2):256-280
[14] Ryan DH. Clinical evaluation of the patient. In: Kaushansky K, editor. Williams Hematology. 9th ed. USA: McGraw-Hill Education; 2016. pp. 11-26. DOI: 978-0-07-183301-1 [15] Coyer SM. Anemia: Diagnosis and management. Journal of Pediatric Health Care. 2005;19(6):
380-385
[16] Jolobe OM. Mean corpuscular haemoglobin, referenced and resurrected. Journal of Clinical Pathology. 2011;64(9):833-834
[17] Wang F, Pan W, Pan S, Ge J, Wang S, Chen M. Red cell distribution width as a novel pre-dictor of mortality in ICU patients. Annals of Medicine. 2011;43(1):40-46
[18] Patel A, Brett SJ. Identifying future risk from routine tests? Cricical Care Medicine. 2014;42(4):999-1000
[19] Buttarello M. Laboratory diagnosis of anemia: Are the old and new red cell param-eters useful in classification and treatment, how? International Journal of Laboratory Hematology. 2016;38(S1):123-132
[20] Bridges KP, Howard A. Principles of anemia evaluation. In: Bridges KP, Howard A, editors. Anemias and Other Red Cell Disorders. 1st ed. United States of America: The McGraw-Hill Companies, Inc.; 2008. p. 374. DOI: 10.1036/0071419403
[21] Buttarello M, Plebani M. Automated blood cell counts: State of art. American Journal of Clinical Pathology. 2008;130(1):104-116
[22] Prchal JT. Clinical manifestations and classification of erythrocyte disorders. In: Kaushansky K, editor. Wiliams Hematology. 9th ed. United States: McGraw-Hill Education; 2016. pp. 503-511. DOI: 978-0-07-183301-1
[23] Torino ABB, Gilberti MFP, de Costa E, de Lima GAF, Grotto HZW. Evaluation of red cell and reticulocyte parameters as indicative of iron deficiency in patients with anemia of chronic disease. Revista Brasileira de Hematologia e Hemoterapia. 2014;36(6):424-429
[24] Chabot-Richards D, Zhang Q-Y, George TI. Automated hematology. In: Rifai N, Horvath AR, Wittwer CT, editors. Tietz Textbook of Clinical Chemistry and Molecular Diagnostics. 6th ed. St. Louis, Missouri, USA: Elsevier; 2017. p. e1734. DOI: 978032335921
[25] Mast AE, Blinder MA, Lu Q, Flax S, Dietzen DJ. Clinical utility of the reticulocyte hemo-globin content in the diagnosis of iron deficiency. Blood. 2002;99(4):1489-1491
[26] Ullrich C, Wu A, Armsby C, Rieber S, Wingerter S, Brugnara C, et al. Screening healthy infants for iron deficiency using reticulocyte hemoglobin content. Jama. 2005;294(8):924-930 [27] DeMott WR, Skikne BS. Hematology. In: Jacobs DS, Oxley DK, editors. Laboratory Test
Handbook. 5th ed. USA: Lexi Comp Inc.; 2001. pp. 391-399
[28] Grotto HZW. Platelet and reticulocyte new parameters: Why and how to use them?. Revista Brasileira de Hematologia e Hemoterapia. 2016;38(4):283-284
[29] Cortellazzi LC, Teixeira SM, Borba R, Gervásio S, Cintra CS, Grotto HZ. Reticulocyte parameters in hemoglobinopathies and iron deficiency anemia. Revista Brasileira de Hematologia e Hemoterapia. 2003;25(2):97-102
[30] Medscape. Anemia Workup [Internet]. 2016 [Updated: September 24, 2016]. Available from: http://emedicine.medscape.com/article/198475-workup#showall [Accessed: April 15, 2017]
[31] McPherson RA, Pincus MR, Henry JB. Henry’s Clinical Diagnosis and Management by Laboratory Methods. 22nd ed. China: Elsevier; 2011. 1513 p
[32] Baker RD, Greer FR. Diagnosis and prevention of iron deficiency and iron-deficiency anemia in infants and young children (0-3 years of age). Pediatrics. 2010;126(5):1040-1050 [33] Schoorl M, Linssen J, Villanueva MM, NoGuera JA, Martinez PH, et al. Efficacy of
advanced discriminating algorithms for screening on iron-deficiency anemia and beta-thalassemia trait: A multicenter evaluation. American Journal of Clinical Pathology. 2012;138(2):300-304
![Figure 3. Flowchart to follow in the diagnosis of anemia according to MCV [4].](https://thumb-eu.123doks.com/thumbv2/9libnet/4145541.63405/8.918.111.808.720.1032/figure-flowchart-follow-diagnosis-anemia-according-mcv.webp)
![Table 2. Various forms and interpretations of RBCs observed in the peripheral blood smear examination [31].](https://thumb-eu.123doks.com/thumbv2/9libnet/4145541.63405/11.918.118.801.290.366/table-various-forms-interpretations-rbcs-observed-peripheral-examination.webp)
![Table 3 demonstrates some of the special assays for such disorders [1, 4].](https://thumb-eu.123doks.com/thumbv2/9libnet/4145541.63405/14.918.113.804.544.783/table-demonstrates-special-assays-disorders.webp)