HistochemicaI Journal
28, 375-383 (1996)The effects of mercaptoethanol-formaldehyde
tissue fixation and protein retention
B. D U R G U N - Y O C E L 1, D. H O P W O O D 2 a n d A . H . Y U C E L 1
1Department of Anatomy, Faculty of Medicine, ~ukurova University, 01330 Batcah, Adana, Turkey
2Department of Pathology, Ninewells Hospital and Medical School, Dundee, UK
Received 4 October 1994 and in final revised f o r m 15 N o v e m b e r 1995
o n
Summary
The study compared the effects of mercaptoethanol-formaldehyde and formaldehyde alone, on tissue fixation and protein retention in human and mouse tissues. Shrinkage of tissues and the penetration rate of the fixatives were assessed. The cross-linking ability of the fixatives was determined by viscometry, sodium dodecyl sulphate-polyacrylamide gel electropho- resis, and spectrophotometry, using bovine serum albumin and human haemoglobin. Tissues fixed in buffered 0.0025% mercaptoethanol-4% formaldehyde showed good nuclear and cytoplasmic detail, better than those fixed in buffered 4% formaldehyde. There was no significant difference in shrinkage. A mixture of 0.0025% mercaptoethanol-4% formaldehyde penetrated faster into adult liver than 4% formaldehyde. The mean penetration rate (_+SE) or coefficient of diffusibility of 0.0025% mercaptoethanol-4% formaldehyde into adult liver was 1.32 _+ 0.01 and that of 4% formaldehyde was 1.12 _+ 0.06 (p<0.04). Both fixatives diffused more rapidly into mouse liver than into human liver. The cross-linking ability of mercaptoethanol-formalde- hyde depends on the concentration of the fixative and the time of fixation. Bovine serum albumin (15%) and 0.1% mercapto- ethanol alone formed a gel, whilst electrophoresis showed monomers in the supernatant. Mercaptoethanol (0.1%) also rapidly decreased the absorption at 420 nm, suggesting denaturation. It seems that mercaptoethanol increases the number of thiol groups available to form cross-links with formaldehyde. This study demonstrated that mercaptoethanol-formaldehyde fixed and cross-linked tissues better than formaldehyde at 3 h and 4 h, but not at 1 h and 2 h. The most effective concentration of mercaptoethanol for tissue fixation in 4% formaldehyde is 0.0025%.
I n t r o d u c t i o n
There are problems in obtaining satisfactory examples of tissues for the teaching of a n a t o m y and p a t h o l o g y . One solution to this difficulty is to use tissues a n d organs that have b e e n p r e s e r v e d b y plastination (von Hagens, 1979). In this process, the tissues are fixed, d e h y d r a t e d and infiltrated with special types of acrylic or nitro-cellulose curable p o l y m e r s u n d e r v a c u u m . When w h o l e organs are used, diffusion of fixatives a n d their reaction with tissues b e c o m e s m o r e i m p o r t a n t than in small conventional blocks of tissue. Earlier w o r k suggested that fixation in a m i x t u r e of m e r c a p t o e t h a n o l and f o r m a l d e h y d e m a y allow better plastination than fixation in f o r m a l d e h y d e alone (Durgun-Yticel
et al.,
1992). Fixation with buffered f o r m a l d e h y d e is m o s t w i d e l y used and some of the m e c h a n i s m s i n v o l v e d are known. F o r m a l d e h y d e fixation has b e e n f o u n d to take a long time to complete and this is associated w i t h h a r d e n i n g and shrinkage, d e p a r t i n g from the ideal life- like condition of the tissue (Baker & McCrae, 1966; H o p w o o d , 1982, 1985).The m o s t reactive sites of p r o t e i n that are subject to cross-linking are p r i m a r y amines, s u l p h y d r y l groups, p r i m a r y amides, g u a n i d y l and aromatic rings (French & Edsall, 1945; Barka & A n d e r s o n , 1963; H o p w o o d , 1970, 1982; Pearse, 1980; Fox
et al.,
1985; Boonet al.,
1988). The reaction of s u l p h y d r y l (SH) g r o u p s d e p e n d s o n the presence of cysteine or cystine in the p r o t e i n chain. In the case of cystine, SH g r o u p s are p r o d u c e d b y r e d u c t i o n of the d i s u l p h i d e (S-S) g r o u p s (Barka & An- derson, 1963; Meister, 1965). T h e r e is e v i d e n c e that the reaction of f o r m a l d e h y d e w i t h thiols:R. SH +CH2OH~R. SCH2OH
takes place m u c h m o r e r a p i d l y t h a n the e q u i v a l e n t reaction w i t h amines, since thiols are better nucleo- philes (Pearse, 1980; Schyns
et al.,
1990). H o w e v e r , SH g r o u p s are susceptible to oxidation d u r i n g fixation, e m b e d d i n g and histochemical processing (Barka & An- derson, 1963; Walker, 1984). M e r c a p t o e t h a n o l is u s e d as a r e d u c i n g a g e n t in the f l u o r e s c e n c e r e a c t i o n of o - p h t h a l d i a l d e h y d e with a m i n o acids ( K e u t m a n n & 0018-2214 9 1996 C h a p m a n & Hall376
Potts, 1969; Roth, 1971; C h e n et al., 1979). The action of m e r c a p t o e t h a n o l is to reduce the d i s u l p h i d e cross-link to s u l p h y d r y l (Walker, 1984). Cavallini et al. (1962) s h o w e d that m e r c a p t o e t h a n o l inhibits the cysteine de- s u l p h y d r a s e reaction, p r e s u m a b l y b y p r e v e n t i n g the f o r m a t i o n of cystine. Thus, it s e e m s that m e r c a p t o - ethanol also p r e v e n t s the oxidation of the SH groups.
O n the basis of these theoretical possibilities, w e h a v e p r e v i o u s l y u s e d m e r c a p t o e t h a n o l in f o r m a l d e h y d e to accelerate the fixation process for plastination of gross s p e c i m e n s , a n d w e f o u n d that 0.0025% m e r c a p t o - ethanol in neutral b u f f e r e d 4% f o r m a l d e h y d e (pH 7.14)
gave the best results (Durgun-Y/icel et al., 1992). H o w -
ever, it w a s unclear to w h a t extent the tissue proteins are affected b y this mixture. The present s t u d y w a s d e s i g n e d to investigate the fixative properties of mer- c a p t o e t h a n o l - f o r m a l d e h y d e m o r e systematically. Vis- cometry, S D S - p o l y a c r y l a m i d e gel electrophoresis a n d s p e c t r o p h o t o m e t r y were u s e d to m e a s u r e the crosslink- ing ability of the fixatives.
M a t e r i a l s a n d m e t h o d s
The tissues used were fresh human biopsy specimens (stom- ach and oesophagus) and fresh postmortem liver, and muscle,
heart, liver and stomach from mouse (Mus musculus). Bovine
serum albumin and human haemoglobin were used as model substances.
Mercaptoethanol was obtained from Sigma (St Louis, MO, USA). All the formaldehyde solutions were freshly prepared from paraformaldehyde (BDH Ltd, Poole, Dorset, UK). Para- formaldehyde was dissolved in distilled water by heating to 80~ Mercaptoethanol was added to the formaldehyde after the solution was ready. The volume of mercaptoethanol was calculated as 0.625 gl per g paraformaldehyde. Thus, 0.0000625%, 0.000125%, 0.00032%, 0.000625%, 0.00125%, 0.0025%, 0.0032% and 0.00625% mercaptoethanol were used in 0.1%, 0.2%, 0.5%, 1%, 2%, 4%, 5% and 10% formaldehyde, respectively (Table 1). However, in viscosity experiments, two- or four-fold greater concentrations of mercaptoethanol were used in 4%, 2% and 1% formaldehyde to investigate how the higher con- centrations of mercaptoethanol in a given concentration of formaldehyde affect cross-linking. The effects of mercap- toethanol alone (0.1%, 0.2% and 0.4%) were also studied. All fixative solutions were buffered with 0.2 M phosphate buffer at pH 7.2. All experiments were repeated twice.
Light microscopy
Fresh human biopsies (stomach and oesophagus) were ob- tained directly from the Endoscopy Suite, Ninewells Hospital, with informed consent. Muscle, heart, liver and stomach were also obtained from freshly killed mice. In total, 14 samples were trimmed to sizes between 2 and 4 cm 3 (2 x 2 x 1 or 2 x 1 x I cm). Tissue blocks were immersed in fixative solutions F6 or MF6 (Table 1) at room temperature for 3 h. After fixation, tissue blocks were cut to approximately 10 x 5 x 5 mm and transferred to an enclosed tissue-processor (The Tissue-Tek
DURGUN-YIJCEL et aI.
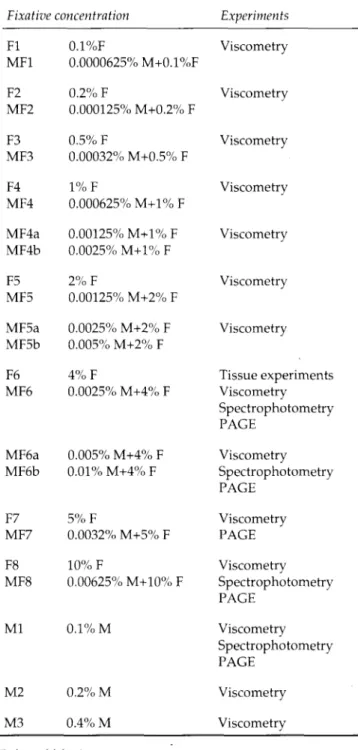
Table 1. Concentrations of the fixatives used
Fixative concentration Experiments
F1 0.1%F Viscometry MF1 0.0000625% M+0.1%F F2 0.2% F Viscometry MF2 0.000125% M+0.2% F F3 0.5% F Viscometry MF3 0.00032% M+0.5% F F4 1% F Viscometry MF4 0.000625% M+1% F MF4a 0.00125% M+1% F Viscometry MF4b 0.0025% M+1% F F5 2% F Viscometry MF5 0.00125% M+2% F MF5a 0.0025% M+2% F Viscometry MF5b 0.005% M+2% F F6 4% F Tissue experiments MF6 0.0025% M+4% F Viscometry Spectrophotometry PAGE MF6a 0.005% M+4% F Viscometry MF6b 0 . 0 1 % M+4% F Spectrophotometry PAGE F7 5% F Viscometry MF7 0.0032% M+5% F PAGE F8 10% F Viscometry MF8 0.00625% M+10% F Spectrophotometry PAGE M1 0.1% M Viscometry Spectrophotometry PAGE M2 0.2% M Viscometry M3 0.4% M Viscometry F=formaldehyde M=mercaptoethanol
PAGE=polyacrylamide gel electrophoresis
VIP 2000, Miles, Stoke Poges, Bucks, UK) and processed through an overnight cycle including dehydration in graded alcohols, clearing in xylene and infiltration with paraffin. Sections (4-5 Bm) were stained with Alum Haematoxylin and Eosin (Bancroft & Stevens, 1982).
Penetration rate
Human adult and child liver blocks from fresh postmortems and fresh mouse liver were trimmed to about i x i x 1 cm and
F i x a t i o n w i t h m e r c a p t o e t h a n o l - f o r m a l d e h y d e 377
immersed in F6 or MF6 at r o o m t e m p e r a t u r e for 4 h. The distance in millimetres that the fixatives diffused into the tissue was determined by colour change, a n d was m e a s u r e d at hourly intervals using a ruler (with 1 m m intervals) and a lens. Coefficients of diffusibility (K) at 1 h, 2 h, 3 h, and 4 h were calculated from M e d a w a r ' s formula (d = K~fi) (Medawar, 1941). To d e t e r m i n e the effects of time and tissue type on penetration rate, 2 (fixative) by 4 (time p e r i o d s of I h each) by 3 (tissue type; adult, child a n d m o u s e liver) A N O V A (analysis of variance) ( b e t w e e n - w i t h i n design) was per- formed using the Complete Statistical System (CSS) program.
Shrinkage of tissue
Shrinkage of tissue was assessed by counting n u m b e r s of nuclei per unit area (Fox
et al.,
1985), using a 100 p o i n t graticule in a x l 0 eyepiece, and a x l 0 objective lens. Mouse liver, h u m a n stomach and h u m a n o e s o p h a g u s were used as the test materials. Nuclei per unit area were counted twice b y two i n d e p e n d e n t observers. The histological section being counted was m o v e d step-wise from one field of vision to the adjacent one. The o u t e r m o s t 40-50 unit areas of the sections were defined as the peripheral zone, a n d the central zone was 50-60 unit areas in from the edge. Four histological slides a n d three fields, i.e. 300 unit areas, were counted on each histo- logical slide to ensure that the counting was established with a sample error equal to 5% of the mean. O n e - w a y A N O V A , using the CSS p r o g r a m , was used to c o m p a r e the results.Viscometry
Bovine serum a l b u m i n (BSA) was obtained from Sigma (A- 7284). It was an a p p r o x i m a t e l y 30% solution in 0.85% NaC1 and 0.1% NaN 3 (pH 7.2). All viscometric m e a s u r e m e n t s were performed with a cone and plate viscometer (Wells-Brook- field, Stoughton, MA., USA) connected to a water bath at 20-23~ Measurements were m a d e at a shear rate of 115 s -1 (30rpm, 1.5 cone).
The reaction mixtures were set u p using equal volumes of 30% BSA and following solutions: f o r m a l d e h y d e (F1, F2, F3, F4, F5, F6, F7, F8); m e r c a p t o e t h a n o l - f o r m a l d e h y d e (MF1, MF2, MF3, MF4, MF4a, MF4b, MF5, MF5a, MF5b, MF6, MF6a, MF6b, MF7, MF8) and mercaptoethanol (0.1%, 0.2%, 0.4%). The control was unreacted BSA, diluted with 0.2 M p h o s p h a t e buffer to 15%. W h e n the reaction mixture containing a final concentration of 15% BSA was ready, it was swirled to mix it completely and timing was started. One millilitre of reaction mixture was transferred to the viscometer cup w i t h o u t bub- bles, using a Pasteur pipette. The cup was fitted to the vis- cometer head, rotation started and the critical cone-plate separation established. Transfer of reaction mixture to the viscometer, setting, and the first valid m e a s u r e m e n t took about 2 min. The reaction mixture was left in the viscometer for 1 h and measurements were m a d e at 10 min intervals.
Test tube experiments
In other experiments, the reactions were allowed to go to completion at r o o m t e m p e r a t u r e overnight. The course of the reaction was observed after I h and 16 h. The mixtures were classified as 0 (liquid), - (slightly viscous), _+ ( m a r k e d l y vis- cous) and + (gel). Final viscosities were then measured.
All experiments to m e a s u r e viscosity were repeated twice b y two i n d e p e n d e n t observers. The differences b e t w e e n the viscosities of 15% BSA treated w i t h f o r m a l d e h y d e and mer- c a p t o e t h a n o l - f o r m a l d e h y d e were tested using 2 (fixative) b y 8 (concentration) A N O V A design (complete factorial be- t w e e n - g r o u p s design) in the CSS p r o g r a m . To test at which concentration and time the difference b e t w e e n two fixatives reaches statistical significance, p a i r e d c o m p a r i s o n was per- f o r m e d (Lindeman
et aL,
1980). It also useda posteriori
orpost
hoc
c o m p a r i s o n (Scheff6 Test) to d e t e r m i n e which pairs of concentrations are significantly different (Hays, 1988). Since the results of viscometry s h o w e d that there was no significant difference at the lower concentrations of fixatives, the higher concentrations of fixatives w e r e chosen for p o l y a c r y l a m i d e gel electrophoresis and s p e c t r o p h o t o m e t r y .Polyacrylamide gel electrophoresis
The reaction mixtures were m a d e using equal volumes of BSA and f o r m a l d e h y d e (F6, F7, F8); BSA and mercaptoethanol- f o r m a l d e h y d e (MF6, MF6a, MF6b, MF7, MF8); and BSA and 0.1% mercaptoethanol. The control was unreacted BSA. The mixtures were a l l o w e d to react at r o o m t e m p e r a t u r e for 2 h and overnight. The s u p e r n a t a n t (2 p.1) was d i l u t e d with dis- tilled water. S o d i u m d o d e c y l s u l p h a t e - p o l y a c r y l a m i d e gel electrophoresis was carried out on 5-10% gels. Samples (60 ~l) were a d d e d to an equal v o l u m e of s a m p l e buffer (0.1 M Tris-HC1 p H 8.0; 8 M urea; 2% SDS) a n d boiled for 2 min. The samples were a p p l i e d to 10% p o l y a c r y l a m i d e gel columns (Hoefer Scientific A p p a r a t u s ; Laemmli, 1970). Gels were run at a constant current of 60 m A until the B r o m o p h e n o l Blue d y e h a d reached the b o t t o m of the gel. The gels were then stained with Coomassie Brilliant Blue.
Spectrophotometry
The changes in UV spectrum associated with the reaction b e t w e e n h u m a n h a e m o g l o b i n a n d fixative solutions were followed with a Unicam SP 1759 UV recording spectro- photometer. H u m a n h a e m o g l o b i n was obtained from the H a e m a t o l o g y Department, Ninewells Hospital and diluted to 2 ~1 m1-1. The reaction mixtures consisted of equal volumes of h a e m o g l o b i n and fixative solutions. The following concentra- tion were used for spectrophotometry: f o r m a l d e h y d e (F6, F8); m e r c a p t o e t h a n o l - f o r m a l d e h y d e (MF6, MF6a, MF6b, MF8) and 0.1% mercaptoethanol. The blank was an equal v o l u m e of protein and distilled water. Spectra were taken b e t w e e n 200 n m and 700 n m at 4 n m s -1 after the reaction h a d p r o c e d e d for 4 h, a n d overnight. R e s u l t s
Light microscopy
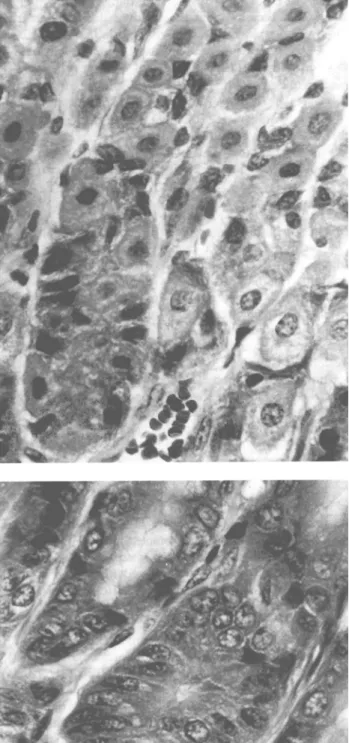
T i s s u e s i m m e r s e d in M F 6 a t p H 7.2 w e r e p r e s e r v e d b e t t e r t h a n t h e i r f o r m a l d e h y d e - f i x e d c o u n t e r p a r t s . T h e cell b o u n d a r i e s w e r e c l e a r l y m a r k e d a n d n u c l e a r c h r o - m a t i n w a s s e e n w i t h g o o d c o n t r a s t . F o r m a l i n p i g m e n t w a s a b s e n t (Fig. 1). S t o m a c h a n d o e s o p h a g u s s h o w e d w e l l d e f i n e d e p i t h e l i a l cell b o u n d a r i e s , w e l l p r e s e r v e d n u c l e i , l y m p h o i d t i s s u e , c a p i l l a r i e s a n d m e s e n c h y m a l378 D U R G U N - Y U C E L et al.
Fig. 1. Human stomach (top left) and mouse stomach (top right) fixed by immersion in 4% formaldehyde (pH 7.2) at room temperature for 3 h. Human stomach (bottom left) and deeper mucosal layers of mouse stomach (bottom right) fixed by immersion in 0.0025% mercaptoethanol-4% formaldehyde (pH 7.2) at room temperature for 3 h. Haematoxylin and Eosin- stained paraffin sections. The general tissue architecture and nuclear and cytoplasmic details are better in mercaptoethanol- formaldehyde-fixed than in formaldehyde-fixed tissues. (x 400)
Fixation with m e r c a p t o e t h a n o l - f o r m a l d e h y d e 379 5O 45 9 5 5 C) c 50 ~- ~'1 25 aJ 9 05
1I
/
/
i 0 1 5 2 0 2.5 3.0 3 5 4.0 I 4 5Table 2. Analysis of variance between and within all effects for penetration rate of F6 and MF6
Effect
Degrees of Mean square Probability
freedom
error
Fixative 1 0.108 0.03
Time 3 0.007 0.00
Tissue 2 0.032 0.0003
Fixative and time
interaction 3 0.007 0.0001
Fixative and tissue
interaction 2 0.032 0.0006
Time and tissue
interaction 6 0.013 0.0001
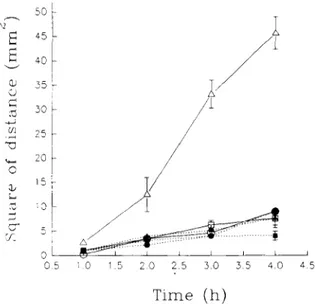
Fig. 2. Penetration of various fixatives into mouse and human liver. F6 (child): e; F6 (adult): II; F6 (mouse): A; MF6 (child): O;MF6 (adult) F-l; MF6 (mouse): ~.
elements. The striations and nuclei were barely visible in both the skeletal a n d cardiac muscle tissues. The tissue architecture of liver w a s p r e s e r v e d well.
Penetration rate
Blocks of h u m a n adult liver i m m e r s e d in MF6 c h a n g e d colour rapidly to brown. There w a s no sharp division between the outer a n d m i d d l e zones after 4 h a n d only a p p r o x i m a t e m e a s u r e m e n t s could be made. Testing the difference b e t w e e n the penetration rate of t w o fixatives separately at 1 h, 2 h, 3 h a n d 4 h b y p e r f o r m i n g paired c o m p a r i s o n s h o w e d that the difference b e t w e e n the t w o means is not statistically significant at I h. H o w e v e r , the effect of time on penetration rate of the fixatives is significant (p<0.0001). Paired c o m p a r i s o n also revealed that changes in the penetration rate of MF6 from 1 h to 2 h and from 2 h to 3 h are m a i n l y responsible for this.
The m e a n penetration rate, or coefficient of diffusibil-
ity
(d/x/t),
of F6 into adult liver w a s 1.12 _+ 0.06 SE a n dthat of MF6 w a s 1.32 _+ 0.01 SE. There is a statistically
Fixative and time and
tissue interaction 6 0.013 0.0009
significant difference b e t w e e n the t w o m e a n s (p<0.04). Both F6 a n d MF6 p e n e t r a t e d into infant liver at a similar rate (1.18 + 0.06 SE a n d 1.14 + 0.1 SE, respectively). The m e a n p e n e t r a t i o n rate of MF6 in m o u s e liver w a s 2.7 _+ 0.71 SE a n d that of F6 w a s 1.27 _+ 0.16 SE, a significant difference (p<0.01). Tissue t y p e is a n o t h e r factor that influences the p e n e t r a t i o n rate (p<0.0007). The m e a n p e n e t r a t i o n rate of MF6 w a s also significantly different w h e n the m o u s e tissue a n d h u m a n p o s t m o r t e m tissues were c o m p a r e d (p<0.008). The results of these experi- m e n t s are s u m m a r i z e d in Fig. 2 a n d Table 2.
Shrinkage of tissue
N o statistically significant differences in the n u m b e r of nuclei w e r e f o u n d b e t w e e n the peripheral a n d the cen- tral zones of tissues (p>0.05).
Test tube experiments
Various concentrations of f o r m a l d e h y d e a n d m e r c a p t o - e t h a n o l - f o r m a l d e h y d e , w h i c h w e r e reacted w i t h 15% BSA in the test tubes for 1 h, p r o d u c e d no gel. In the
Table 3. Gel formation 1 h or 18 h after reacting 15% BSA with different concentrations of formaldehyde (F1, F2, F3, F4, F5, F6, F7, FS) or mercaptoethanol-formaldehyde (MF1, MF2, MF3, MF4, MF5, MF6, MF7, MF8)
Formaldehyde concentration (%)
Fixative
Time (h)
0.1 0.2 0.5 1 2 4 5 10 Formaldehyde 1 0 0 0 0 0 0 - - 18 0 0 0 0 0 0 + + Mercaptoethanot-formaldehyde 1 18 0 0 0 0 0 0 -+ -+ 0 0 0 0 0 -+ + +380 DURGUN-YOCEL
et al.
7 0 60 5O O >-~ 4 0 o 0 r~ .~ 30 > 20 ...- s 9 10 t L I I I (~ "2 ,~ R 1G 1 9Fig. 3. Mean final viscosities (centipoises) of 15% BSA mixed with various concentrations of formaldehyde and mercap- toethanol-formaldehyde for I h. All values are final concentra- tions in the mixtures. Formaldehyde: dashed line, o; mercaptoethanol-formaldehyde: solid line, O.
o v e r n i g h t reaction, F7, F8, MF7 and MF8 caused the m i x t u r e s to gel (Table 3); n o t e that w i t h m e r c a p t o - e t h a n o l - f o r m a l d e h y d e the p r o t e i n solution b e c a m e m a r k e d l y viscous at 4% w h e r e a s similar changes b e g a n with f o r m a l d e h y d e at 5%.
Viscometry
After 1 h, viscosity of the p r o t e i n solution increased g r a d u a l l y as the concentrations of fixatives increased (Fig. 3). An A N O V A test s h o w s that the fixative concen- tration is the m a i n factor causing viscosity changes (Table 4). For the o v e r n i g h t reaction, the difference b e t w e e n the two fixatives is highly significant (Table 5). Paired c o m p a r i s o n , w h i c h was p e r f o r m e d separately for each concentration, also s h o w e d that there is a sta- Table 4. Analysis of variance of viscosity measurements for reaction between 15% BSA and different concentrations of formaldehyde (F1, F2, F3, F4, F5, F6, F7, F8) and mercap- toethanol-formaldehyde (MF1, MF2, MF3, MF4, MF5, MF6, MF7, MF8) for 1 h
Effect
Degrees of
Mean square Probability
freedom
error
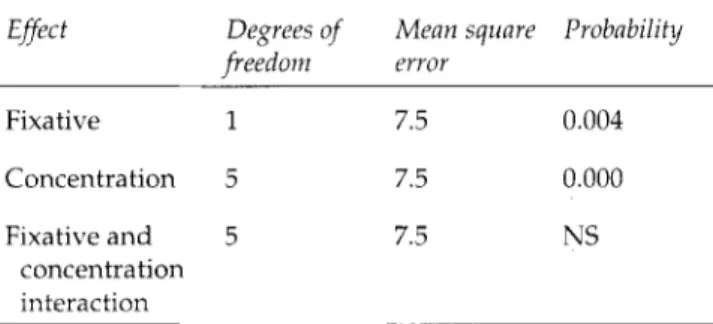
Fixative 1 31.6 NS Concentration 7 31.6 0.002 Fixative and 7 31.6 NS concentration interaction NS = not significant.Table 5. Analysis of variance of viscosity measurements for reaction overnight between 15% BSA and different concentra- tions of formaldehyde (F1, F2, F3, F4, F5, F6, F7, F8) and mercaptoethanol-formaldehyde (MF1, MF2, MF3, MF4, MF5, MF6, MF7, MF8)
Effect
Degrees of
Mean square Probability
freedom
error
Fixative 1 7.5 0.004 Concentration 5 7.5 0.000 Fixative and 5 7.5 NS concentration interaction NS=not significant.NB. High concentrations of both fixatives (5% and 10%) have been omitted, as the coixture forms a gel at these concentrations. tistically significant difference b e t w e e n f o r m a l d e h y d e a n d m e r c a p t o e t h a n o l - f o r m a l d e h y d e at 2% (p<0.05) and at 4% (p<0.02). At h i g h e r concentrations of both fixa- tives (5%, 10%), the p r o t e i n m i x t u r e gels, so that vis- c o m e t r y is impossible. There is a gradual increase in viscosity with increasing concentrations of fixative up to 2%, w i t h an inflexion occurring b e t w e e n 2% and 4% (Fig. 4). The Scheff6 test revealed that the difference b e t w e e n low concentrations of the fixatives (0.1%, 0.2% a n d 0.4%) is significant (p<0.02). As s h o w n b y ANOVA, there are three significant effects: concentration, time, a n d an interaction b e t w e e n time and concentration, that is, the greater the concentrations of b o t h fixatives the greater are the changes in viscosity with time.
M e r c a p t o e t h a n o l at 0.1% or 0.2% reacted with 15% BSA o v e r n i g h t to p r o d u c e a gel (Fig. 5). Mercapto- ethanol at 0.4% also p r o d u c e d a gel. Gel formation occurs m o r e r a p i d l y w h e n the 0.1%, 0.2% and 0.4% m e r c a p t o e t h a n o l alone w e r e u s e d with 30% BSA. Add- ing 4% f o r m a l d e h y d e to the reaction m i x t u r e of 0.1% m e r c a p t o e t h a n o l a n d 30% BSA p r o d u c e d a rapid de- crease in viscosity. Solutions of 1%, 2% and 4% formal- dehyde containing two- or four-fold greater concentrations of m e r c a p t o e t h a n o l (MF4a, MF4b, MF5a, MF5b, MF6a, MF6b) w h i c h w e r e reacted with 15% BSA b r o u g h t about a slightly greater increase" in viscosity that MF4, MF5, a n d MF6. H o w e v e r , the difference is not statistically significant.
Polyacrylamide gel electrophoresis
The b e h a v i o u r of 15% BSA r e a c t e d w i t h m e r c a p t o - e t h a n o l - f o r m a l d e h y d e for 2 h is similar to that of BSA reacted with the same concentrations of f o r m a l d e h y d e alone, b u t the m o s t rapidly migrating band ran furthest f r o m the origin and there is less m o n o m e r . BSA treated with MF6a a n d MF6b gives a similar pattern. Fifteen per cent BSA reacted with 0.1% m e r c a p t o e t h a n o l alone for 2 h gave an electrophoretic p a t t e r n similar to that of
Fixation with mercaptoethanol-formaldehyde 120 35 381 1 0 0 ~ . j / / v 9 80 ' ~ O0 60 o 9 0 I I I ~ @ 1 2 4 5 F i x a t i v e c o n c e n t r a t i o n (%) Fig. 4. Mean final viscosities of 15% BSA containing various concentrations of formaldehyde and mercaptoethanol-for- maldehyde. Overnight reaction. Formaldehyde: dashed line, e; mercaptoethanol-formaldehyde: solid line, O.
control untreated BSA. There is no evidence of polymer formation. When the reactions were allowed to go to completion at room temperature overnight, the pat- terns of gel formation were the same as those found by viscometry. Mercaptoethanol-formaldehyde-BSA mix- tures produced more gel than formaldehyde-BSA mix- tures (Table 1). When the supernatants were examined, it was found that the electrophoretic patterns were simi- lar to those of the mixtures after reaction for 2 h. Over- night reaction of 15% BSA with 0.1% mercaptoethanol alone produced more gel and less supernatant. Its elec- trophoretic pattern was also similar to that of control untreated BSA.
Spectroscopy
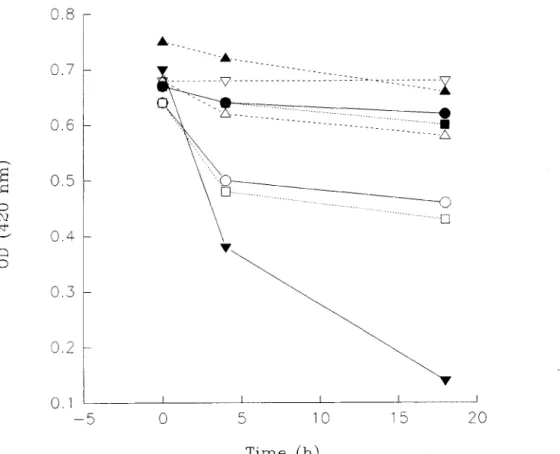
F8, MF8, and 0.1% mercaptoethanol alone, caused a marked decrease in absorption at 420 nm when they reacted with haemoglobin at room temperature for 4 h or overnight, but F6, MF6, MF6a and MF6b p r o d u c e d no significant change in absorbance either after 4 h or overnight (Fig. 6).
D i s c u s s i o n
The demonstration of organ and tissue specimens is an important exercise in the teaching of anatomy and pa- thology, but the storage and handling of them is diffi- cult. Plastination is a process which allows wider use of human tissue for both basic and clinical instruction (von Hagens, 1981). Conventional formaldehyde fixation usually seems sufficient. However, hardening and shrinkage of tissue which occur as a result of prolonged formaldehyde fixation are undesirable effects for plastin-
O >~ O s > 30 25 20 O 1 5 i i t i _ _ ~
o o o.~ 0.2 o.s 04 o.s
M e r c a p t o e t h a n o l c o n c e n t r a t i o n ( % F i g . 5. M e a n f i n a l v i s c o s i t i e s o f 15% BSA r e a c t e d w i t h v a r i o u s c o n c e n t r a t i o n s o f m e r c a p t o e t h a n o l a l o n e f o r 1 h.
ation. The results of our earlier study indicated that rodent tissues up to 70mm 3 were fixed well by immer- sion in neutral buffered 0.0025% mercaptoethanol-4% formaldehyde (pH 7.14) at room temperature for 3-3.5 h, compared with formaldehyde for 12-24 h.
Mouse and h u m a n tissues fixed in buffered MF6 were preserved well in line with our earlier results (Durgun- Yiicel
et al.,
1992). Histology was similar after fixation by MF6 or by formaldehyde. Although the two fixatives had diffused into adult liver at similar rates at I h, MF6 penetrated further into tissue than F6 over longer peri- ods. This is an important feature for plastination. The penetration rate of MF6 into infant liver did not differ from that of F6. Both fixatives penetrated much more quickly into mouse than into h u m a n liver. This may be related to autolytic changes in the postmortem speci- mens. Fixation depends not only on the penetration rate, but also on the rate at which fixative reacts with the tissue components, and the reversibility of this re- action. The beneficial effect of mercaptoethanol can be attributed to the acceleration of the reaction of formal- dehyde with the tissue.It has been shown that the cross-links between proteins formed by the fixative agents lead to polymerization. As the process proceeds, the protein becomes viscous and eventually gels (Hopwood, 1982, 1989; Luft, 1992). Our results showed that all concentrations of mercapto- ethanol we used (0.0000625%-0.01% in formaldehyde and 0.1%-0.4% alone) p r o d u c e d an increase in viscosity with time. This increase was seen only at concentrations of formaldehyde greater than 2%.
From our results, we can deduce that the fixative concentration is a critical factor in cross-linking. In this context, three observations are important. First, viscosity increases gradually w h e n low concentrations of formal-
382 DURGUN-YOCEL et al.
0.8
o c~ 0 0.7 0.6 0.5 0 . 4 0.3 0.2 0.1 -:~ . . . V . . . :: ... :::::Z~I~O , ,
... ~~~-~-~-!
... []
I I L I I0
5
10
15
20
T i m e (h)Fig. 6. Absorbance (OD) at 420 nm of the reaction between human haemoglobin and different concentrations of fixatives as a function of time. The same results were obtained in repeat experiments. Control Hb, V; F8, O; F6, o; MF8, I~; MF6, I; MF6a, • MF6b, A; mercaptoethanol, V.
dehyde and mercaptoethanol-formaldehyde (0.1-2%) are used for overnight reaction. The significant change occurs in viscosity when concentrations of both fixa- tives approach 4%. As suggested by Luft (1992), using glutaraldehyde, it is thought that this may be a critical point where the growing polymer molecules begin to become entangled with each other.
Second, viscosity decreases with time at low concen- trations of formaldehyde (0.1%-2%), indicating that a reversible reaction takes place. This may in part be a dilution effect. It is well known that formaldehyde re- acts rapidly with tissue components, but the reaction is largely reversible (Burnett, 1982; Fox et al., 1985). The finding that the same concentrations of mercapto- ethanol-formaldehyde caused an increase in viscosity with time shows that mercaptoethanol prevents the reversibility to some extent.
Third, high concentrations of mercaptoethanol (0.005%, 0.01%, 0.1%), both with formaldehyde or by itself, were found to polymerize BSA much more than formaldehyde alone. Evidence for this was found with PAGE and viscometric studies. The finding that the electrophoretic patterns of formaldehyde and mercapto- ethanol-formaldehyde after the overnight reaction
were not different from those after reaction for 2 h is due to the use of the supernatants. The results are supported by the spectrophotometric studies. The absorption at 420 nm is markedly decreased with 0.1% mercapto- ethanol. This is an indication of tissue denaturation (Hopwood, 1989). The number of SH groups that are chemically detectable may increase during denatura- tion (Barka & Anderson, 1963). Mercaptoethanol may increase the number of available SH groups during the denaturation, by cleaving disulphide cross-links. Obvi- ously, the proteins must be retained during the fixation process (Barka & Anderson, 1963; Hopwood, 1982; Pearse, 1980). At the lower concentrations, mercapto- ethanol produces more SH groups which are capable of forming cross-links with formaldehyde much more rapidly without causing denaturation. The finding that 0.1%, 0.2% and 0.4% mercaptoethanol produced more gel with 30% BSA is due to the concentrated solution of BSA, which probably represents the cellular concentra- tion more closely (Luft, 1992). At certain concentrations of mercaptoethanol, the addition of formaldehyde pro- duces a decrease in viscosity. This may be a simple dilution effect.
F i x a t i o n w i t h m e r c a p t o e t h a n o l - f o r m a l d e h y d e 383 In t h i s s t u d y w e f o u n d t h a t t h e m o s t e f f e c t i v e c o n c e n - t r a t i o n of t h e f i x a t i v e m i x t u r e is 0 . 0 0 2 5 % m e r c a p t o - e t h a n o l in b u f f e r e d 4% f o r m a l d e h y d e . H i g h e r c o n c e n t r a t i o n s o f m e r c a p t o e t h a n o l i n f o r m a l d e h y d e r e s u l t e d in a g r e a t e r d e g r e e o f p o l y m e r i z a t i o n , b u t tis- s u e m o r p h o l o g y w a s d i s t o r t e d . T i s s u e s i m m e r s e d in 0.1% m e r c a p t o e t h a n o l - 4 % f o r m a l d e h y d e ( p H 7.14) at r o o m t e m p e r a t u r e for 3-3.5 h w e r e p o o r l y p r e s e r v e d , a s s h o w n b y a n o t h e r s t u d y ( D u r g u n - Y L i c e l , u n p u b l i s h e d results). T h e effects of m e r c a p t o e t h a n o l - f o r m a l d e h y d e o n t i s s u e f i x a t i o n a n d c r o s s - l i n k i n g i n c r e a s e s s i g n i f i - c a n t l y w i t h t i m e . I n t h i s r e g a r d , t h e c h a n g e s o f t h e effects of m e r c a p t o e t h a n o l - f o r m a l d e h y d e at 2 h, 3 h a n d 4 h a n d all e x p e r i m e n t s s h o u l d b e t a k e n i n t o a c c o u n t . It s e e m s t h a t m e r c a p t o e t h a n o l - f o r m a l d e h y d e b e g i n s to a c c e l e r a t e t h e r e a c t i o n at 2 h a n d , a s t h e r e a c t i o n p r o - c e e d s , m e r c a p t o e t h a n o l - f o r m a l d e h y d e d i f f e r s f r o m f o r m a l d e h y d e s i g n i f i c a n t l y . T h i s m a y b e e x p l a i n e d b e s t b y t h e f o r m a t i o n of m o r e S H g r o u p s , a l l o w i n g f o r m a l - d e h y d e to r e a c t w i t h t h e s e . I n c o n c l u s i o n , f i x a t i o n w i t h 0.0025% m e r c a p t o e t h a n o l - 4 % f o r m a l d e h y d e at p H 7.2 a c c e l e r a t e s t h e d i f f u s i o n of t h e f i x a t i v e a n d t h e f i x a t i o n p r o c e s s . T h e s e a r e i m p o r t a n t f a c t o r s in i m p r o v i n g p l a s t i n a t i o n , w h e r e w h o l e o r g a n s a r e u s e d . References
BAKER, J. R. & McCRAE, J. M. (1966) The fine structure resulting from fixation by formaldehyde: the effects of concentra- tion, duration and temperature. J. Royal Microsc. Soc. 85, 391--4.
BARKA, T & ANDERSON, F. J. (1963) Histochemistry: Theory, Practice and Bibliography. New York: Hoeber Medical Division, H a r p e r and Row.
BANCROFT, J. D. & STEVENS, A. (1982) Theory and Practice of Histo- logical Techniques. Edinburgh: Churchill Livingstone. BOON, M. E., GERRITS, P, O., MOORLAG, H. E., NIEUWENHUIS, P. & KOK,
L. P. (1988) F o r m a l d e h y d e fixation and m i c r o w a v e irra- diation. Histochem. J. 20, 313-22.
BURNETT, M. G. (1982) The m e c h a n i s m of the f o r m a l d e h y d e
clock reaction. Methylene glycol dehydration. J. Chem.
Ed. 59, 160-2.
CAVALLINI, D., MONDOVI, B., DeMARCO, C. & SCIOSCIA-SANTORO, A. (1962) The mechanism of d e s u l p h h y d r a t i o n of cysteine.
Enzymologia 24, 253-66.
CHEN, R. F., SCOTT, C. & TREPMAN, E. (1979) Fluorescence p r o p e r - ties of o - p h t h a l d i a l d e h y d e derivatives of a m i n o acids.
Biochim. Biophys. Acta 576, 440-55.
DURGUN-YI~CEL, B., DERE, F., YLICEL, A. H. & OGUZ, O. (1992) Rapid fixation of whole organ specimens and a t t e n d e d prob-
lems. Acta Medica Okayama 46, 75-81.
FRENCH, D. & EDSALL, J.T. (1945) The reaction of f o r m a l d e h y d e with amino acids a n d proteins. Adz,. Protein Chem. 2, 277-335.
FOX, C. H., JOHNSON, F. B., WHITING, J. & ROLLER, P. P. (1985) Formal- d e h y d e fixation. J. Histochem. Cytochem. 33, 845-53. HAYS, W. L. (1988) Statistics 4th edn. N e w York: CBS College
Publishing.
HOPWOOD, D. (1970) The reactions b e t w e e n f o r m a l d e h y d e , g l u t a r a l d e h y d e , a n d o s m i u m tetroxide, and their fixation effects on bovine s e r u m a l b u m i n and on tissue block.
Histochemie 24, 50-60.
HOPWOOD, D. (1982) Fixation and fixatives. In Theory and Prac-
tice of Histological Techniques (edited b y J. D. Bankroft & A. Stevens) Edinburgh: Churchill Livingstone.
HOPWOOD, D. (1985) Cell and tissue fixation, 1972-1982. Histo-
chem. J. 17, 389-442.
HOPWOOD, D. (1989) Tissue fixation w i t h p h e n o l - f o r m a l d e h y d e
for routine histopathology. Histochem. J. 21 228-34.
KEUTMANN, H. T. & POTTS, J. T. Jr. (1969) I m p r o v e d recovery of methionine after acid h y d r o l y s i s using mercaptoethanol.
Anal. Biochem 29, 175-85.
LAEMMLI, U. K. (1970) Cleavage of structural proteins d u r i n g the assembly of the h e a d of b a c t e r i o p h a g e T4. Nature 227, 680-5.
LINDEMAN, H. R., MERENDA, P. F. & GOLD, R. (1980) hltroduction to Bivariate and Multivariate Analysis. N e w York: Scott, Foresman and Co.
LUFT, J. H. (1992) Fixation for biological ultrastructure. I. A. viscometric analysis of the interaction b e t w e e n glutaral- d e h y d e and bovine s e r u m albumin. J. Microsc. Oxford,
167, 247-58.
MEDAWAR, P. B. (1941) The rate of p e n e t r a t i o n of fixatives. J.
Royal Microsc. Soc. 61, 46-57.
MEISTER, A. (1965) Biochemistry of the Amino Acids. Vol 1, 2nd edn. N e w York: Academic Press.
PEARSE,A. G. E. (1980) Histochemistry: Theoretical and Applied. Vol 1, 2nd edn. Edinburgh: Churchill-Livingstone.
ROTH, M (1971) Fluorescence reaction for amino acids. Anal.
Chem. 47, 880-2.
SCHYNS, M. W. R. J., HUIZINGA, A., VRENSEN, G. F. M. J., DE MUL, F. M. & GREVE, J. (1990) P a r a f o r m a l d e h y d e fixation and some characteristics of lens proteins as m e a s u r e d b y Raman
microspectroscopy. Exp. Eye Res. 50, 331-3.
VON HAGENS, G. (1979) I m p r e g n a t i o n of soft biological speci-
mens with thermosetting resins and elastomers. Anat.
Rec. 194, 247-56.
VON HAGENS, G. (1981) A n i m p r o v e d m e t h o d for the preserva-
tion of teaching specimens. Arch. PathoI. Lab. Med. 105
674-6.
WALKER, J. M. (1984) Methods in Molecular Biology. Proteins