İSTANBUL BİLGİ UNIVERSITY INSTITUTE OF SOCIAL SCIENCES
FINANCIAL ECONOMICS MASTER'S DEGREE PROGRAM
PERFORMANCE ANALYSIS OF BANKS IN TURKEY USING CAMELS, STRESS TESTING AND INTERNAL CREDIT RATING APPROACHES
CASE STUDY: SIX TURKISH BANKS DURING 2005 TO 2016
Masoud GHAZAVIKHOURASGANI 115620013
SUPERVISOR: ASST. PROF. DR. Sema BAYRAKTAR TÜR
İSTANBUL 2017
iii
ABSTRACT
This thesis verifies the performance and financial credibility of six Turkish banks for period 2005-2016. I have chosen two State-owned deposit banks, three Private-owned deposit banks and one foreign bank.
First, as one of the most popular methods for measuring banking performance, CAMELS, was chosen which stands for Capital adequacy, Asset quality, Management, Earnings, Liquidity, Sensitivity respectively.
Second, Stress Testing method which is a risk management tool has been used to assess the vulnerability of counterparties to exceptional events. It identifies the impact of extreme expected and unexpected shocks to a counterparty’s capital, provides an assessment of its financial strength to withstand shocks and to spot emerging risk(s) and uncover weak spots in the financials. It enables counterparties in identifying their vulnerabilities at an early stage.
Last, some financial ratios have been selected to compare each bank with banking industry and it has been given a rank to each bank which is based on two parts, one quantitative assessment and the other qualitative assessment. According to these assessments we have calculated Internal Credit Rating (ICR) for banks.
Based on my CAMELS model Ziraat Bank and Şekerbank have the highest rate with rate of 29%. Halkbank stands at the last row of this ranking model with rate of 22%. However, based on the calculated ICR for every individual bank all of them remain in the acceptable rang. According to ICR’s findings Ziraat Bank yet again stands first with a rate of 3.24 and Garanti Bank is the second in row with a rate of 3.51 while Şekerbank is the last one in the ranking. Yet again the whole range assigned to the banks is within the acceptable domain. At the end of this study, in order to evaluate the credibility of the model, the result, attained in the study, of ICR and CAMELS Ratings for 2016 for
iv
each bank, and the respective rates assigned by International Credit Rating Agencies are compared. This comparison shows no considerable bias.
Keywords: Banking, Performance Analysis, International Rating Agencies, 2001
Turkey’s Crisis, 2007-8 Global Crisis, CAMELS Approach, Internal Credit Rating (ICR), Stress Testing (ST), Sensitivity Analysis, Scenario Analysis
iii
ÖZET
Bu tez, 2005-2016 döneminde altı Türk bankasının performansını ve finansal güvenilirliğini analiz etmektedir. Çalışmada iki devlet bankası, üç özel mevduat bankası ve bir de yabancı sermayeli banka örneklem olarak seçilmiştir. İki devlete ait mevduat bankası, üç özel sektöre ait mevduat bankası ve bir yabancı banka seçtim. İlk olarak, bankacılık performansını ölçmek için kullanılan en popüler yöntemlerden biri olarak, CAMELS yöntemi bu amaçla seçildi. CAMELS’in baş harfleri Sermaye yeterliliği, Varlık kalitesi, Yönetim, Kazançlar, Likidite ve Duyarlılık’a karşılık gelmektedir.
İkinci olarak, bir risk yönetim aracı olan Stres Test yöntemi, karşı tarafların sıradışı olaylara karşı hassasiyetini değerlendirmek için kullanılmıştır. Stres Test Yöntemi, beklenen ve beklenmedik aşırı şokların karşı tarafın sermayesine etkisini belirler, şoklara dayanacak finansal gücünü değerlendirir ve ortaya çıkan riskleri tespit eder ve finansal durumdaki zayıf noktaları ortaya çıkarır. Karşı tarafların güvenlik açıklarını erken bir aşamada tespit etmelerini sağlar.
Son olarak, her bankayı bankacılık sektörüyle karşılaştırmak için bazı finansal oranlar seçilmiş ve her bir bankaya, iki bölümden, bir niceliksel değerlendirme ve diğer nitel değerlendirme temelli bir dereceverilmiştir. Bu değerlendirmelere göre bankalar için İç Kredi Derecelendirme (ICR) hesaplamış bulunuyoruz.
CAMELS modelime göre, % 29 ile TC Ziraat Bankası ve Şeker Bankası en yüksek orana sahiptir. Halk Bankası, bu sıralama modelinin son satırında % 22'lik bir oranla durmaktadır. Bununla birlikte, her bir bankanın hesaplanan ICR'sine dayanarak hepsi kabul edilebilir aralıkta kalır.
ICR'nin bulgularına göre, TC Ziraat Bankası yine 3.24 ile birinci sırayı almaktadır. Garanti Bankası sıralaması 3.51’lik derece ile ikincidir. Şeker Bankası sıralamada son sırada yer almaktadır. Yine, bankalara verilen tüm dereceler kabul edilebilir
iv
değerlerdir. Bu çalışmanın sonunda, sonuçların güvenilirliğini test etmek için her bankanın 2016 yılındaki ICR ve CAMELS Rating değerleri ile Uluslararası Kredi Dereceleri arasında bir karşılaştırma yapılmıştır. Bu karşılaştırmaya göre karşılaştırılan değerler arasında önemli bir fark görülmemiştir.
Anahtar Kelimeler: Bankacılık, Performans Analizi, Uluslararası Derecelendirme
Kuruluşları, 2001 Türkiye Krizi, 2007-8 Küresel Kriz, CAMELS Yaklaşımı, İç Kredi Notu (ICR), Stres Testi (ST), Duyarlılık Analizi, Senaryo Analizi.
v
ACKNOWLEDGMENT
At the outset, I would like to extend my sincere appreciation to Asst. Prof. Dr. Sema Bayraktar Tür who bore the main burden and took trouble and paid considerable attention while reviewing my thesis as the supervisor. Whenever, I ran into a trouble or had a question about some aspects of my research, the door of her office was always open to me with kind face and vibrant guidelines. She always answered my phone-calls and my questions promptly, comprehensively and generously with great patience.
My thanks also go to the other respectful Jury members who were kind enough to spend time and raise delicate points which clarified the way for subsequent essays to extend and improve the accuracy of the evaluation of the counterparties. Precisely I am very grateful to Asst. Prof. Dr. Mehmet Fuat Beyazıt who is a lecturer at İstanbul Bilgi University and teaches various courses on Financial Mathematics degree program and Asst. Prof. Dr. Faik Çelik who is a lecturer at Kocaeli University and teaches various topics in Economics and banking. As referee they contributed a lot in improving the quality of the work.
I would also like to acknowledge the ushering of Ms. Dr. Nazanin Shirzadi, Senior expert of ECO Trade and Development Bank who gave me useful and constructive advices and also provided me moral incentives to push forward my efforts and don’t feel tiredness. I am gratefully indebted to her for her very valuable comments on this thesis.
Finally, I have to deeply gratify heartwarming support received from my parents and my fiancé. This accomplishment would not have been possible without them.
vi
TABLE OF CONTENTS
ABSTRACT ... iii
ÖZET... iii
ACKNOWLEDGMENT ... v
LIST OF TABLES ... xii
LIST OF APPENDICES ... xv
FOREWORD ... xxvi
CHAPTER 1 ... 29
INTRODUCTION ... 29
1.1 BACKGROUND OF THE STUDY: THEORY AND PRACTICE ... 29
1.2 REVIEW OF TURKISH BANKING SYSTEM, HISTORY AND ACTUAL PICTURE ... 31
1.3 OBJECTIVE OF THE STUDY ... 33
1.4 SUMMARY ... 35
CHAPTER 2 ... 38
LITERATURE ... 38
CHAPTER 3 ... 41
BASEL PROVISIONS AND INTERNATIONAL CREDIT RATING AGENCIES 41 3.1. INTRODUCTION ... 41
3.2. BANK PRUDENTIAL REGULATIONS BEFORE 1988 ... 42
3.3. THE 1988 BIS ACCORD ... 43
3.4. BIS 98 ... 44
3.5. BASEL II ... 44
3.6. BASEL III ... 45
vii
3.9. CR AGENCIES IN THE UNITED STATES ... 48
3.10. CR AGENCIES IN THE UNITED KINGDOM ... 48
3.11. CR AGENCIES IN COLOMBIA ... 48
3.12. CR AGENCIES IN CHINA ... 48
3.13. CR AGENCIES IN TURKEY ... 49
3.14. THE BIG THREE CR AGENCIES ... 49
3.14.1. STANDARDS AND POOR (S&P) ... 50
3.14.2. Moody’s ... 51
3.14.3. Fitch ... 51
3.15. A COMPARISON AMONG SYMBOLS ASSIGNED BY THE BIG THREE CREDIT RATING AGENCIES ... 52
CHAPTER 4 ... 56
A REVIEW ON RECENT INTERNATIONAL CRISIS ... 56
4.1. INTRODUCTION ... 56
4.2. THE U.S. CRISIS OF 2007 ... 56
4.3. BRIEF RECENT ECONOMIC HISTORY OF TURKEY ... 57
4.4. TURKISH BANKING SECTOR WEAKNESSES BEFORE THE CRISIS ... 58
4.5. TURKEY’S CRISIS IN 2000-01 ... 59
4.6. RESTRUCTURING OF TURKISH BANKING SYSTEM ... 60
4.7. TURKISH BANKING SYSTEM IN RESPONSE TO GLOBAL CRISIS OF 2007 ... 62
4.8. RECENT DEVELOPMENT OF TURKISH ECONOMY ... 67
CHAPTER 5 ... 71
METHODOLOGY ... 71
5.1 RESEARCH DATA ... 71
5.2 CAMELS RATING ... 71
viii
5.2.2. Asset Quality ... 74
5.2.3. Management Quality ... 76
5.2.4. Earing Quality ... 77
5.2.5. Liquidity Quality ... 79
5.2.6. Sensitivity to Market Risk ... 80
5.3 STRESS TESTING (ST) ... 82
5.4. FREQUENCY OF STRESS TESTING AND LEVEL OF SHOCKS: ... 87
5.5. STRESS TEST (ST) ASSUMPTIONS FOR BANKS UNDER SENSITIVITY ANALYSIS ... 87
Assumption No. 1 ... 87
Rise in NPLs while other variables are held constant ... 87
Assumption No. 2 ... 88
Rise in Lending rate while other variables are held constant... 88
Assumption No. 3 ... 88
Decline in Lending rate while other variables are held constant ... 88
Assumption No. 4 ... 89
Rise in borrowing rate while other variables are held constant ... 89
Assumption No. 5 ... 89
Decline in Net Trading Income while other variables are held constant ... 89
5.6. STRESS TEST (ST) ASSUMPTIONS FOR BANKS UNDER SCENARIO ANALYSIS ... 89
5.6.2 Moderate Shock ... 90
5.6.3 Major Shock ... 90
CHAPTER 6 ... 94
EMPRICAL RESULTS FOR CAMELS RATING ... 94
6.1 INTRODUCTION ... 94
6.2 ZIRAAT BANK ... 94
ix
6.2.2 Trend Analysis of Main Ratios under CAMELS Model for Ziraat Bank
during 12 Years ... 95
6.2.3 CAMELS rating for Ziraat Bank... 111
6.3. HALKBANK ... 115
6.3.1. Brief History ... 115
6.3.2. Trend Analysis of main Ratios under CAMELS model for Halkbank during 12 years ... 116
6.3.3. CAMELS rating for Halkbank ... 132
6.4. İŞBANK ... 135
6.4.1. Brief History ... 135
6.4.2. Trend Analysis of Main Ratios under CAMELS Model for İşbank during 12 years ... 136
6.4.3. CAMELS rating for İşbank ... 152
6.5 AKBANK ... 155
6.5.1. Brief History ... 155
6.5.2. Trend Analysis of Main Ratios under CAMELS Model for Akbank during 12 Years ... 156
6.5.3. CAMELS rating for Akbank ... 172
6.6 GARANTI BANK ... 175
6.6.1. Brief History ... 175
6.6.2. Trend Analysis of Main Ratios under CAMELS Model for Garanti Bank during 12 Years ... 175
6.6.3. CAMELS rating for Garanti Bank ... 191
6.7. ŞEKERBANK ... 194
6.7.1. Brief History ... 194
6.7.2. Trend Analysis of Main Ratios under CAMELS Model for Şekerbank during 12 Years ... 194
x
6.8. SUMMARY FOR RATIOS RELATED TO BANKS UNDER STUDY (2016)
... 214
CHAPTER 7 ... 218
EMPRICAL RESULTS FOR STRESS TESTING (ST) ... 218
7.1. INTRODUCTION: ... 218
7.2. BASEL II AND ST ... 218
7.3. INTERNAL CREDIT RATING (ICR) AND STRESS TEST (ST) COMPONENTS ... 219
7.4. INTERNAL CREDIT RATE RISK FOR ZIRAAT BANK – DECEMBER 2016 ... 219
7.4.1. Sensitivity Analysis for Ziraat Bank: ... 223
7.5. INTERNAL CREDIT RATE RISK FOR HALKBANK – DECEMBER 2016 ... 229
7.5.1 Sensitivity Analysis and Scenario Analysis for Halkbank: ... 231
7.6. INTERNAL CREDIT RATE RISK FOR İŞBANK – DECEMBER 2016 ... 238
7.6.1. Sensitivity Analysis and Scenario Analysis for İşbank: ... 240
7.7. INTERNAL CREDIT RATE RISK FOR AKBANK – DECEMBER 2016 . 247 7.7.1. Sensitivity Analysis and Scenario Analysis for Akbank: ... 250
7.8. INTERNAL CREDIT RATE RISK FOR GARANTI BANK – DECEMBER 2016 ... 257
7.8.1. Sensitivity Analysis and Scenario Analysis for Garanti Bank: ... 260
7.9.1. Sensitivity Analysis and Scenario Analysis for Şekerbank: ... 269
7.10.1. Sensitivity Analysis ... 277
7.10.2. Comprehensive Scenario Analysis ... 287
7.10.3. Evaluation of efficiency for a credit rating system ... 291
CHAPTER 8 ... 293
xi
8.1. CAMELS RESULTS ... 298
8.2. SENSITIVITY ANALYSIS AND ICR ... 299
8.2.2. Sensitivity Analysis: Lending Rate Rise: Minor (1%), Moderate (2%) and Major (3%) ... 301
8.2.3. Sensitivity Analysis Lending Rate Decline: Minor (1%), Moderate (2%) and Major (3%) ... 301
8.2.4. Sensitivity Analysis: Borrowing Rate Rise: Minor (1%), Moderate (2%) and Major (3%) ... 302
8.2.5. Sensitivity Analysis: Net Trading Income Decline: Minor (1%), Moderate (2%) and Major (3%) ... 303
8.3. Comprehensive Scenario Analysis ... 305
8.4. EVALUATION OF EFFICIENCY FOR A CREDIT RATING SYSTEM ... 307
8.5. FURTHER RESEARCH ... 310
REFERENCES ... 312
xii
LIST OF TABLES
Table 1. Credit Rating Agencies in Turkey ... 49
Table 2. A comparison among symbols assigned by the big three credit rating agencies ... 53
Table 3. Selected Balance-Sheet Items (TL million) ... 66
Table 4. Capital Adequacy Category Ratios ... 73
Table 5. Asset Quality Category Ratios ... 75
Table 6. Management Quality Category Ratio ... 76
Table 7. Earning Quality Category Ratios ... 78
Table 8. Liquidity Quality Category Ratios ... 79
Table 9. Earning Quality Category Ratios ... 81
Table 10. Internal Credit Risk Methodology ... 91
Table 11. CAMELS Rating for Ziraat Bank 2016 (Numbers are rounded) ... 114
Table 12. CAMELS Rating for Halkbank 2016 (Numbers are rounded) ... 134
Table 13. CAMELS Rating for İşbank 2016 (Numbers are rounded) ... 154
Table 14. CAMELS Rating for Akbank 2016 (Numbers are rounded) ... 174
Table 15. CAMELS Rating for Garanti Bank 2016 (Numbers are rounded) ... 193
Table 16. CAMELS Rating for Şekerbank 2016 (Numbers are rounded) ... 213
Table 17. Comparative Ratios Related to Banks Under Study (2016) ... 217
Table 18. Portfolio Diversification of Ziraat Bank in Year 2016 ... 220
Table 19. Internal Credit Rate Risk Before Simulation for Ziraat Bank – December 2016 ... 222
Table 20. Sensitivity Analysis Minor Shock for Ziraat Bank ... 226
xiii
Table 22. Sensitivity Analysis Major Shock for Ziraat Bank ... 226
Table 23. Scenario Analysis Minor, Moderate and Major Shock for Ziraat Bank228 Table 24. Portfolio Diversification of Halkbank in Year 2016 ... 229
Table 25. Internal Credit Rate Risk Before Simulation for Halkbank – December 2016 ... 230
Table 26. Sensitivity Analysis Minor Shock for Halkbank ... 235
Table 27. Sensitivity Analysis Moderate Shock for Halkbank ... 235
Table 28. Sensitivity Analysis Major Shock for Halkbank... 235
Table 29. Scenario Analysis Minor, Moderate and Major Shock for Halkbank.. 237
Table 30. Portfolio Diversification of İşbank in Year 2016... 238
Table 31.Internal Credit Rate Risk Before Simulation for İşbank – December 2016 ... 239
Table 32. Sensitivity Analysis Mınor Shock for Işbank ... 244
Table 33. Sensitivity Analysis Moderate Shock for Işbank ... 244
Table 34. Sensitivity Analysis Major Shock for Işbank ... 244
Table 35. Scenario Analysis Minor, Moderate and Major Shock for Işbank ... 246
Table 36. Portfolio Diversification of Akbank in Year 2016... 247
Table 37. Internal Credit Rate Risk Before Simulation for Akbank – December 2016 ... 249
Table 38. Sensitivity Analysis Minor Shock for Akbank ... 254
Table 39. Sensitivity Analysis Moderate Shock for Akbank ... 254
Table 40. Sensitivity Analysis Major Shock for Akbank ... 254
Table 41. Scenario Analysis Minor, Moderate and Major Shock for Akbank .... 256
Table 42. Portfolio Diversification of Garanti Bank in Year 2016 ... 257
Table 43. Internal Credit Rate Risk Before Simulation for Garanti Bank – December 2016 ... 259
Table 44. Sensitivity Analysis Minor Shock for Garanti Bank ... 264
Table 45. Sensitivity Analysis Moderate Shock for Garanti Bank ... 264
xiv
Table 47. Scenario Analysis Minor, Moderate and Major Shock for Garanti Bank266
Table 48. Portfolio Diversification of Şekerbank in Year 2016 ... 267
Table 49. Internal Credit Rate Risk Before Simulation for Şekerbank – December 2016 ... 268
Table 50. Sensitivity Analysis Minor Shock for Şekerbank ... 273
Table 51. Sensitivity Analysis Moderate Shock for Şekerbank ... 273
Table 52. Sensitivity Analysis Major Shock for Şekerbank ... 273
Table 53. Scenario Analysis Minor, Moderate and Major Shock for Şekerbank 275 Table 54. Internal Credit Rating After NPLs Rise ... 278
Table 55. Internal Credit Rating After Rise in Lending Rate ... 280
Table 56. Internal Credit Rating After Decline in Lending Rate ... 282
Table 57. Internal Credit Rating After Rise in Borrowing Rate ... 284
Table 58. Internal Credit Rating After Decline in Net Trading Income ... 286
Table 59. Internal Credit Rating After Scenario Analysis Simulation ... 288
Table 60. Evaluation of Efficiency for a Credit Rating System ... 292
Table 61. Most Significant Determinant Affecting the ICR ... 305
Table 62. ICR after Simulation for Scenario Analysis (All Six Banks) ... 306
xv
LIST OF APPENDICES
Annex 1. Ziraat Bank Income Statement from 2005 to 2016 ... 317
Annex 2. Ziraat Bank Balance sheet (Assets) from 2005 to 2016 ... 318
Annex 3. Ziraat Bank Balance sheet (Liabilities and Equity) from 2005 to 2016319 Annex 4. Halkbank Income Statement from 2005 to 2016 ... 320
Annex 5. Halkbank Balance sheet (Assets) from 2005 to 2016 ... 321
Annex 6. Halkbank Balance sheet (Liabilities and Equity) from 2005 to 2016 .. 322
Annex 7. İşbank Income Statement from 2005 to 2016... 323
Annex 8. İşbank Balance sheet (Assets) from 2005 to 2016 ... 324
Annex 9. İşbank Balance sheet (Liabilities and Equity) from 2005 to 2016 ... 325
Annex 10. Akbank Income Statement from 2005 to 2016 ... 326
Annex 11. Akbank Balance sheet (Assets) from 2005 to 2016 ... 327
Annex 12. Akbank Balance sheet (Liabilities and Equity) from 2005 to 2016 ... 328
Annex 13. Garanti Bank Income Statement from 2005 to 2016 ... 329
Annex 14. Garanti Bank Balance sheet (Assets) from 2005 to 2016 ... 330
Annex 15. Garanti Bank Balance sheet (Liabilities and Equity) from 2005 to 2016331 Annex 16. Şekerbank Income Statement from 2005 to 2016 ... 332
Annex 17. Şekerbank Balance sheet (Assets) from 2005 to 2016 ... 333 Annex 18. Şekerbank Balance sheet (Liabilities and Equity) from 2005 to 2016334
xvi
LIST OF FIGURES
Figure 1.Distribution of Total Assets by Group (%) ... 33
Figure 2. CAMELS Categories ... 34
Figure 3.Turkey GDP annual growth rate ... 62
Figure 4.Turkey Unemployment Rate... 62
Figure 5.Turkey Current Account to GDP ... 63
Figure 6.Turkey Government Debt to GDP ... 63
Figure 7.Turkey Inflation Rate ... 64
Figure 8.Average CAR for Six Banks ... 67
Figure 9. Capital rate of Ziraat Bank during 2005-2016 ... 95
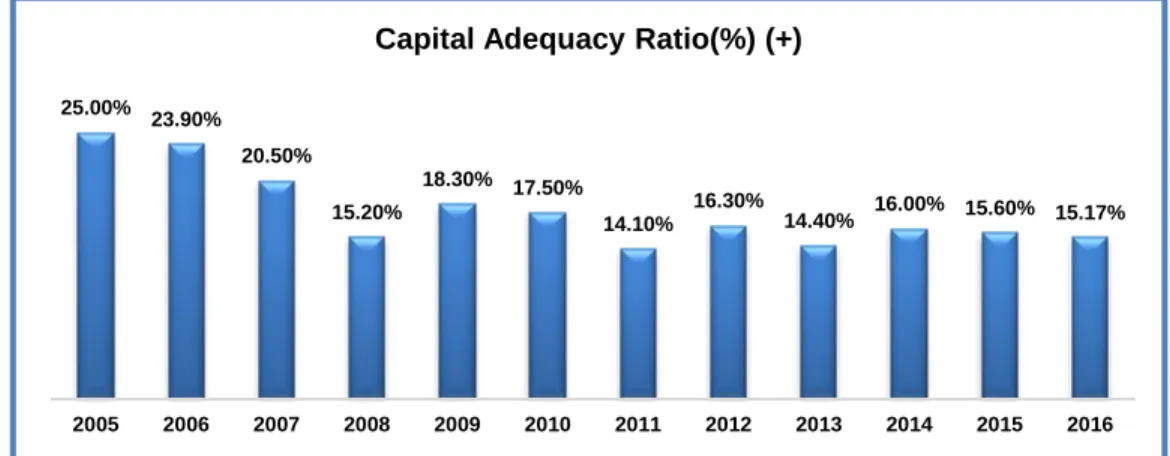
Figure 10.Capital Adequacy Ratio of Ziraat Bank during 2005-2016 ... 96
Figure 11. Equity to Total Liabilities of Ziraat Bank during 2005-2016 ... 96
Figure 12. Equity to Net Loans of Ziraat Bank during 2005-2016 ... 97
Figure 13. Equity to Total Assets of Ziraat Bank during 2005-2016... 97
Figure 14. Asset Quality rate of Ziraat Bank during 2005-2016 ... 98
Figure 15. Loans to total Assets of Ziraat Bank during 2005-2016 ... 98
Figure 16. Fixed Assets to Total Assets of Ziraat Bank during 2005-2016 ... 99
Figure 17. NPL to Gross Loans of Ziraat Bank during 2005-2016 ... 99
Figure 18. Specific Provision Reserve to NPL of Ziraat Bank during 2005-2016100 Figure 19. Bearing Assets to Total Assets of Ziraat Bank during 2005-2016 ... 100
Figure 20. Management Rate of Ziraat Bank during 2005-2016 ... 101
Figure 21. Current plus Saving Deposits to Total Deposits of Ziraat Bank during 2005-2016 ... 101
Figure 22. Net Income per Branch (Growth Rate) of Ziraat Bank during 2005-2016 ... 102
Figure 23. Net Income per Employee (Growth Rate) of Ziraat Bank during 2005-2016 ... 102
xvii
Figure 24. Non-Interest Exp. Plus Impairment Exp. to Total Assets of Ziraat Bank
during 2005-2016 ... 103
Figure 25. Net Interest Income to Net Income of Ziraat Bank during 2005-2016103 Figure 26. Net Interest Income to Non-Interest Expenses of Ziraat Bank during 2005-2016 ... 104
Figure 27. Earning Rate of Ziraat Bank during 2005-2016 ... 104
Figure 28. Net Income to Total Assets of Ziraat Bank during 2005-2016 ... 105
Figure 29. Net Income to Equity of Ziraat Bank during 2005-2016 ... 105
Figure 30. Net Interest Margin of Ziraat Bank during 2005-2016 ... 106
Figure 31. Non-Interest Exp. to Net Interest Inc. plus Non-Interest Inc. of Ziraat Bank during 2005-2016 ... 106
Figure 32. Non-Interest Inc. to Net-Interest Inc. plus Non-Interest Inc. of Ziraat Bank during 2005-2016 ... 107
Figure 33. Liquidity Rate of Ziraat Bank during 2005-2016 ... 107
Figure 34. Liquid Assets to Total Assets of Ziraat Bank during 2005-2016 ... 108
Figure 35. Liquid Assets to Total Foreign Assets of Ziraat Bank during 2005-2016 ... 108
Figure 36. Gross Loans to Deposit of Ziraat Bank during 2005-2016... 109
Figure 37. Customer Deposits to Total Funding of Ziraat Bank during 2005-2016109 Figure 38. Sensitivity Rate of Ziraat Bank during 2005-2016 ... 110
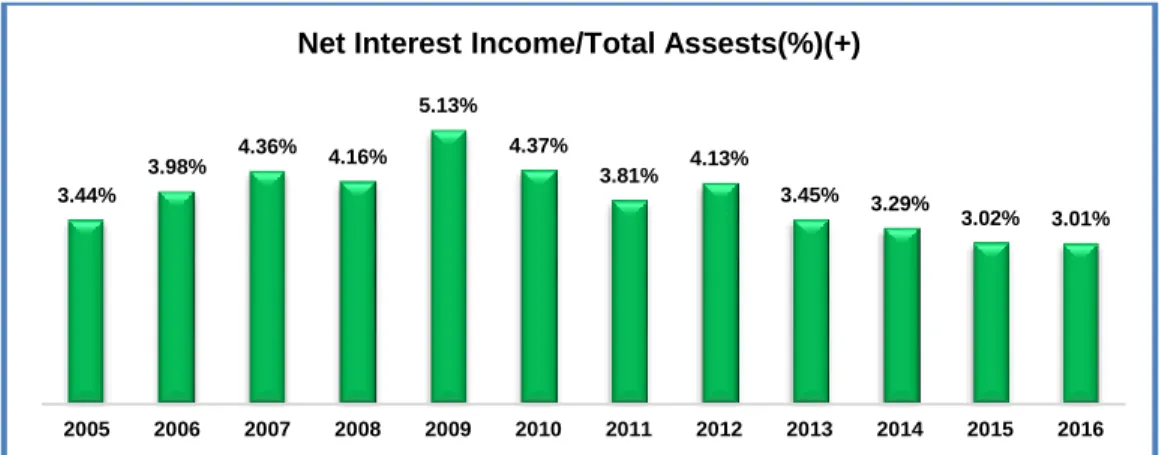
Figure 39. Securities Portfolio to Total Assets of Ziraat Bank during 2005-2016110 Figure 40. Bearing Assets to Costly Liabilities of Ziraat Bank during 2005-2016111 Figure 41. Net Interest Income to Total Assets of Ziraat Bank during 2005-2016111 Figure 42. CAMELS Overall Rates for Ziraat Bank during 2005-2016 ... 112
Figure 43. CAMELS Performance Index for Ziraat Bank during 2005-2016 ... 112
Figure 44. Capital for Halkbank during 2005-2016 ... 116
Figure 45. Capital Adequacy Ratio for Halkbank during 2005-2016 ... 116
Figure 46. Equity to Total Liabilities for Halkbank during 2005-2016 ... 117
xviii
Figure 48. Equity to Total Assets for Halkbank during 2005-2016 ... 118
Figure 49. Asset rate for Halkbank during 2005-2016 ... 118
Figure 50. Loans to Total Assets for Halkbank during 2005-2016... 119
Figure 51. Fixed Assets to Total Assets for Halkbank during 2005-2016 ... 119
Figure 52. NPL to Gross Loans for Halbank during 2005-2016... 120
Figure 53. Specific provision reserve to NPL for Halbank during 2005-2016 .... 120
Figure 54. Bearing Assets to Total Assets for Halbank during 2005-2016 ... 121
Figure 55. Management rate for Halbank during 2005-2016 ... 121
Figure 56. Current plus Savings Deposits for Halbank during 2005-2016 ... 122
Figure 57. Net Income per Branch for Halbank during 2005-2016 ... 122
Figure 58. Net Income per Employee for Halbank during 2005-2016 ... 123
Figure 59. Non Interest Expenses plus Impairment Expenses to Total Assets for Halbank during 2005-2016 ... 123
Figure 60. Net Interest Income to Net Income for Halbank during 2005-2016 ... 124
Figure 61. Net Interest Income to Non Interest Expenses for Halbank during 2005-2016 ... 124
Figure 62. Earning rate for Halbank during 2005-2016 ... 125
Figure 63. Net Income to Total Assets for Halbank during 2005-2016... 125
Figure 64. Net Income to Equity for Halkbank during 2005-2016 ... 126
Figure 65. Net Interest Margin for Halkbank during 2005-2016 ... 126
Figure 66. Non-Interest Exp. to Net Interest Inc. plus Non-Interest Inc. for Halkbank during 2005-2016 ... 127
Figure 67. Non-Interest Inc. to Net-Interest Inc. plus Non-Interest Inc. for Halkbank during 2005-2016 ... 127
Figure 68. Liquidity Rate for for Halkbank during 2005-2016 ... 128
Figure 69. Liquid Assets to Total Assets for Halkbank during 2005-2016 ... 128
Figure 70. Liquid Assets to Total Foreign Liabilities for Halkbank during 2005-2016 ... 129
xix
Figure 72. Customer Deposits to Total Funding for Halkbank during 2005-2016130
Figure 73. Sensitivity Rate for Halkbank during 2005-2016 ... 130
Figure 74. Securities Portfolio to Total Assets for Halkbank during 2005-2016 131 Figure 75. Bearing Assets to Costly Liabilities for Halkbank during 2005-2016 131 Figure 76. Net Interest Income to Total Assets for Halkbank during 2005-2016 132 Figure 77. CAMELS Overall Rates for Halkbank during 2005-2016 ... 132
Figure 78. CAMELS Performance Index for Halkbank during 2005-2016... 133
Figure 79. Capital rate of İşbank during 2005-2016 ... 136
Figure 80. Capital Adequacy Ratio of İşbank during 2005-2016 ... 136
Figure 81. Equity to Total Liabilities of İşbank during 2005-2016 ... 137
Figure 82. Equity to Net Loans of İşbank during 2005-2016 ... 137
Figure 83. Equity to Total Assets of İşbank during 2005-2016 ... 138
Figure 84. Asset Quality rate of İşbank during 2005-2016 ... 138
Figure 85. Loans to total Assets of İşbank during 2005-2016 ... 139
Figure 86. Fixed Assets to Total Assets of İşbank during 2005-2016 ... 139
Figure 87. NPL to Gross Loans of İşbank during 2005-2016 ... 140
Figure 88. Specific Provision Reserve to NPL of İşbank during 2005-2016... 140
Figure 89. Bearing Assets to Total Assets of İşbank during 2005-2016 ... 141
Figure 90. Management Rate of İşbank during 2005-2016 ... 141
Figure 91. Current plus Saving Deposits to Total Deposits of İşbank during 2005-2016 ... 142
Figure 92. Net Income per Branch (Growth Rate) of İşbank during 2005-2016 . 142 Figure 93. Net Income per Employee (Growth Rate) of İşbank during 2005-2016143 Figure 94. Non-Interest Exp. Plus Impairment Exp. to Total Assets of İşbank during 2005-2016 ... 143
Figure 95. Net Interest Income to Net Income of İşbank during 2005-2016 ... 144
Figure 96. Net Interest Income to Non-Interest Expenses of İşbank during 2005-2016 ... 144
xx
Figure 98. Net Income to Total Assets of İşbank during 2005-2016 ... 145
Figure 99. Net Income to Equity of İşbank during 2005-2016 ... 146
Figure 100. Net Interest Margin of İşbank during 2005-2016 ... 146
Figure 101. Non-Interest Inc. to Net-Interest Inc. plus Non-Interest Inc. of İşbank during 2005-2016 ... 147
Figure 102. Liquidity Rate of İşbank during 2005-2016 ... 147
Figure 103. Liquidity Rate of İşbank during 2005-2016 ... 148
Figure 104. Liquid Assets to Total Assets of İşbank during 2005-2016 ... 148
Figure 105. Liquid Assets to Total Foreign Assets of İşbank during 2005-2016 149 Figure 106. Gross Loans to Deposit of İşbank during 2005-2016 ... 149
Figure 107. Customer Deposits to Total Funding of İşbank during 2005-2016 .. 150
Figure 108. Sensitivity Rate of İşbank during 2005-2016 ... 150
Figure 109. Securities Portfolio to Total Assets of İşbank during 2005-2016... 151
Figure 110. Bearing Assets to Costly Liabilities of İşbank during 2005-2016 .... 151
Figure 111. Net Interest Income to Total Assets of İşbank during 2005-2016 .... 152
Figure 112. CAMELS Overall Rates for İşbank during 2005-2016 ... 152
Figure 113. CAMELS Performance Index for İşbank during 2005-2016 ... 153
Figure 114. Capital rate of Akbank during 2005-2016 ... 156
Figure 115. Capital Adequacy Ratio of Akbank during 2005-2016 ... 157
Figure 116. Equity to Total Liabilities of Akbank during 2005-2016 ... 157
Figure 117. Equity to Net Loans of Akbank during 2005-2016 ... 158
Figure 118. Equity to Total Assets of Akbank during 2005-2016 ... 158
Figure 119. Asset Quality rate of Akbank during 2005-2016 ... 159
Figure 120. Loans to total Assets of Akbank during 2005-2016 ... 159
Figure 121. Fixed Assets to Total Assets of Akbank during 2005-2016 ... 160
Figure 122. NPL to Gross Loans of Akbank during 2005-2016 ... 160
Figure 123. Specific Provision Reserve to NPL of Akbank during 2005-2016 .. 161
Figure 124. Bearing Assets to Total Assets of Akbank during 2005-2016 ... 161
xxi
Figure 126. Current plus Saving Deposits to Total Deposits of Akbank during 2005-2016 ... 162 Figure 127. Net Income per Branch (Growth Rate) of Akbank during 2005-2016163 Figure 128. Net Income per Employee (Growth Rate) of Akbank during 2005-2016 ... 163 Figure 129. Non-Interest Exp. Plus Impairment Exp. to Total Assets of Akbank during 2005-2016 ... 164 Figure 130. Net Interest Income to Net Income of Akbank during 2005-2016 ... 164 Figure 131. Net Interest Income to Non-Interest Expenses of Akbank during 2005-2016 ... 165 Figure 132. Earning Rate of Akbank during 2005-2016... 165 Figure 133. Net Income to Total Assets of Akbank during 2005-2016 ... 166 Figure 134. Net Income to Equity of Akbank during 2005-2016 ... 166 Figure 135. Net Interest Margin of Akbank during 2005-2016 ... 167 Figure 136. Non-Interest Exp. to Net Interest Inc. plus Non-Interest Inc. of Akbank during 2005-2016 ... 167 Figure 137. Non-Interest Inc. to Net-Interest Inc. plus Non-Interest Inc. of Akbank during 2005-2016 ... 168 Figure 138. Liquidity Rate of Akbank during 2005-2016 ... 168 Figure 139. Liquid Assets to Total Assets of Akbank during 2005-2016 ... 169 Figure 140. Liquid Assets to Total Foreign Assets of Akbank during 2005-2016169 Figure 141. Gross Loans to Deposit of Akbank during 2005-2016 ... 170 Figure 142. Customer Deposits to Total Funding of Akbank during 2005-2016 170 Figure 143. Sensitivity Rate of Akbank During 2005-2016 ... 171 Figure 144. Securities Portfolio to Total Assets of Akbank during 2005-2016... 171 Figure 145. Bearing Assets to Costly Liabilities of Akbank during 2005-2016 .. 172 Figure 146. Net Interest Income to Total Assets of Akbank during 2005-2016 .. 172 Figure 147. CAMELS Overall Rates for Akbank during 2005-2016 ... 173 Figure 148. CAMELS Performance Index for Akbank during 2005-2016 ... 173
xxii
Figure 149. Capital rate of Garanti Bank during 2005-2016 ... 175 Figure 150. Capital Adequacy Ratio of Garanti Bank during 2005-2016 ... 176 Figure 151. Equity to Total Liabilities of Garanti Bank during 2005-2016 ... 176 Figure 152. Equity to Net Loans of Garanti Bank during 2005-2016 ... 177 Figure 153. Equity to Total Assets of Garanti Bank during 2005-2016 ... 177 Figure 154. Asset Quality rate of Garanti Bank during 2005-2016 ... 178 Figure 155. Loans to total Assets of Garanti Bank during 2005-2016 ... 178 Figure 156. Fixed Assets to Total Assets of Garanti Bank during 2005-2016 .... 179 Figure 157. NPL to Gross Loans of Garanti Bank during 2005-2016 ... 179 Figure 158. Specific Provision Reserve to NPL of Garanti Bank during 2005-2016 ... 180 Figure 159. Bearing Assets to Total Assets of Garanti Bank during 2005-2016 . 180 Figure 160. Management Rate of Garanti Bank during 2005-2016... 181 Figure 161. Current plus Saving Deposits to Total Deposits of Garanti Bank during 2005-2016 ... 181 Figure 162. Net Income per Branch (Growth Rate) of Garanti Bank during 2005-2016 ... 182 Figure 163. Net Income per Employee (Growth Rate) of Garanti Bank during 2005-2016 ... 182 Figure 164. Non-Interest Exp. Plus Impairment Exp. to Total Assets of Garanti Bank during 2005-2016 ... 183 Figure 165. Net Interest Income to Net Income of Garanti Bank during 2005-2016183 Figure 166. Net Interest Income to Non-Interest Expenses of Garanti Bank during 2005-2016 ... 184 Figure 167. Earning Rate of Garanti Bank during 2005-2016 ... 184 Figure 168. Net Income to Total Assets of Garanti Bank during 2005-2016 ... 185 Figure 169. Net Income to Equity of Garanti Bank during 2005-2016 ... 185 Figure 170. Net Interest Margin of Garanti Bank during 2005-2016 ... 186
xxiii
Figure 171. Non-Interest Exp. to Net Interest Inc. plus Non-Interest Inc. of Garanti Bank during 2005-2016 ... 186 Figure 172. Non-Interest Inc. to Net-Interest Inc. plus Non-Interest Inc. of Garanti Bank during 2005-2016 ... 187 Figure 173. Liquidity Rate of Garanti Bank during 2005-2016... 187 Figure 174. Liquid Assets to Total Assets of Garanti Bank during 2005-2016 ... 188 Figure 175. Liquid Assets to Total Foreign Assets of Garanti Bank during 2005-2016 ... 188 Figure 176. Gross Loans to Deposit of Garanti Bank during 2005-2016 ... 189 Figure 177. Customer Deposits to Total Funding of Garanti Bank during 2005-2016 ... 189 Figure 178. Sensitivity Rate of Garanti Bank during 2005-2016 ... 190 Figure 179. Securities Portfolio to Total Assets of Garanti Bank during 2005-2016 ... 190 Figure 180. Bearing Assets to Costly Liabilities of Garanti Bank during 2005-2016 ... 191 Figure 181. Net Interest Income to Total Assets of Garanti Bank during 2005-2016 ... 191 Figure 182. CAMELS Overall Rates for Garanti Bank during 2005-2016 ... 192 Figure 183. CAMELS Performance Index for Garanti Bank during 2005-2016 192 Figure 184. Capital rate of Şekerbank during 2005-2016 ... 195 Figure 185. Capital Adequacy Ratio of Şekerbank during 2005-2016 ... 195 Figure 186. Equity to Total Liabilities of Şekerbank during 2005-2016 ... 196 Figure 187.Equity to Net Loans of Şekerbank during 2005-2016 ... 196 Figure 188. Equity to Total Assets of Şekerbank during 2005-2016 ... 197 Figure 189. Asset Quality rate of Şekerbank during 2005-2016 ... 197 Figure 190. Loans to total Assets of Şekerbank during 2005-2016 ... 198 Figure 191. Fixed Assets to Total Assets of Şekerbank during 2005-2016 ... 198 Figure 192. NPL to Gross Loans of Şekerbank during 2005-2016... 199
xxiv
Figure 193. Specific Provision Reserve to NPL of Şekerbank during 2005-2016199 Figure 194. Bearing Assets to Total Assets of Şekerbank during 2005-2016 ... 200 Figure 195. Management Rate of Şekerbank during 2005-2016 ... 200 Figure 196. Current plus Saving Deposits to Total Deposits of Şekerbank during 2005-2016 ... 201 Figure 197. Net Income per Branch (Growth Rate) of Şekerbank during 2005-2016 ... 201 Figure 198. Net Income per Employee (Growth Rate) of Şekerbank during 2005-2016 ... 202 Figure 199. Non-Interest Exp. Plus Impairment Exp. to Total Assets of Şekerbank during 2005-2016 ... 202 Figure 200. Net Interest Income to Net Income of Şekerbank during 2005-2016203 Figure 201. Net Interest Income to Non-Interest Expenses of Şekerbank during 2005-2016 ... 203 Figure 202. Earning Rate of Şekerbank during 2005-2016 ... 204 Figure 203. Net Income to Total Assets of Şekerbank during 2005-2016... 204 Figure 204. Net Income to Equity of Şekerbank during 2005-2016 ... 205 Figure 205. Net Interest Margin of Şekerbank during 2005-2016 ... 205 Figure 206. Non-Interest Exp. to Net Interest Inc. plus Non-Interest Inc. of Şekerbank during 2005-2016 ... 206 Figure 207. Non-Interest Inc. to Net-Interest Inc. plus Non-Interest Inc. of Şekerbank during 2005-2016 ... 206 Figure 208. Liquidity Rate of Şekerbank during 2005-2016 ... 207 Figure 209. Liquid Assets to Total Assets of Şekerbank during 2005-2016 ... 207 Figure 210. Liquid Assets to Total Foreign Assets of Şekerbank during 2005-2016 ... 208 Figure 211. Gross Loans to Deposit of Şekerbank during 2005-2016 ... 208 Figure 212. Customer Deposits to Total Funding of Şekerbank during 2005-2016209 Figure 213. Sensitivity Rate of Şekerbank during 2005-2016 ... 209
xxv
Figure 214. Securities Portfolio to Total Assets of Şekerbank during 2005-2016210 Figure 215. Bearing Assets to Costly Liabilities of Şekerbank during 2005-2016210 Figure 216. Net Interest Income to Total Assets of Şekerbank during 2005-2016211 Figure 217. CAMELS Overall Rates for Şekerbank during 2005-2016 ... 211 Figure 218. CAMELS Performance Index for Şekerbank during 2005-2016 ... 212 Figure 219. Internal Credit Rating After Rise in NPLs ... 278 Figure 220. Internal Credit Rating After Rise in Lending Rate ... 280 Figure 221. Internal Credit Rating After Decline in Lending Rate... 282 Figure 222. Internal Credit Rating After Rise in Borrowing Rate ... 284 Figure 223. Internal Credit Rating After Decline in Net Trading Income ... 286 Figure 224. Internal Credit Rating Scenario Analysis Simulation ... 288 Figure 225. Scenario Analysis After All level Shocks ... 290
xxvi
FOREWORD
Banks in today’s world play a very important role in maintaining the stability and financing different sectors of the economy in every nation. Apart from the main function of just being an institution to safeguard people’s deposit, it acts as an intermediary to purvey loans to the economy and provide different services for businesses. Therefore, the health and soundness of banks is very crucial to ensure smooth and robust economic development of any country.
If banks do not perform properly; therefore, it may result in systematic risk for the whole economy by which a general crisis may happen to the economy and as a result economy will suffer from hyperinflation, FOREX fluctuations, high rate of unemployment, social unrest and so many other examples of instability. Its effects may hit the financial markets and from there to even real sector. Therefore, we should be able to evaluate the soundness of the banks. According to Basel rules, credit rating of the banks came forward as a normal and general practice which has essential importance. Nowadays; there are several rating agencies throughout the world which rate the banks in terms of their short term and long term debt instrument that they continuously issue. Besides, banks themselves are also supposed to make some internal evaluation of their own soundness on a regular periodic basis. Banks usually interact with their peers as well. Before any serious interaction particularly in the form of treasury and credit mutual cooperation, they need to have a clear evaluation about their counterparties and their respective creditworthiness and the extent of their soundness and credibility in order to be able to better manage their risks. For this purpose; using CAMELS ratios can be very helpful. Furthermore, some deteriorations in different variables may have negative effects on the balance sheet of a typical bank. We need to be able to predict the extent of the effects of those events. For this purpose, Sensitivity and Scenario analysis can be very useful.
xxvii
Having said that about the necessity and main objective of the essay, it is worth mentioning that this thesis is divided into 8 consecutive chapters.
The first chapter is assigned to introduction in which we delineate the road map ahead. The second chapter is allocated to the literature review. Chapter three discusses necessity for establishment of prudential rules such as Basel rules and the reasons behind emergence of International Rating Agencies as well as a brief introduction to some of the most important agencies of this type. Chapter four shed a light on the recent global financial crisis and its effects on the Turkish economy as well as brief focus on particular financial crisis experienced by Turkey during the last decade of the 20th century. The fifth chapter explains the methodology for calculating CAMELS ratios, stress testing and obtaining ICR. Chapter six and seven brings the empirical results for CAMELS rating and Stress testing respectively. Finally, Last chapter is designed to provide a comprehensive conclusion.
29
CHAPTER 1 INTRODUCTION
1.1 BACKGROUND OF THE STUDY: THEORY AND PRACTICE
Nowadays, banks play a considerable role in creating, maintaining and enhancing financial stability in the economy of every nation. Apart from the traditional function of just being used for deposit taking and giving loans, they act as intermediary to finance large businesses and facilitate different types of transactions and provide a diverse range of services to cover many sorts of risks. That is why, the health, robustness and soundness of banks is of the very essence to ensure smooth and strong trend for economic development of any country. “A strong financial system with
competitive environment promotes investment by financing productive business opportunities, mobilizing savings, efficiently allocating resources and makes easy the trade of goods and services.” (Isanzu, 2016)
Turkey as the country focus of this study, has experienced different economic stages. Before 1980s, a planned economy was on the scene, after these years it moved toward an economy inspired by the liberalization actions. However, due to structural weaknesses, efforts of these years did not succeed as they were intended. Inflation, public sector expenditures and public sector borrowings were high in 1990s. In this span of time, actually banks were not doing their own particular and specialized business which is precisely financial intermediation. Instead, as a pocket for government, they financed the government at high interest rates. What made the situation worse was the currency crisis which emerged in 1994. In 1999, an IMF supported exchange rate anchor program was implemented. However, heavy depreciation of currency resulted in 2001 crisis in Turkey. This crisis more importantly
30
brought up considerable spill over adverse effects to the Turkish banking sector. The main reason for this incident on banks was because banks had serious open positions on FOREX. Of course; other weaknesses of the banking sector also contributed considerably in the 2001 crisis. That is why for restructuring of the Turkish economy, efforts had been concentrated on the banking reforms. The Banking Regulation and Supervision Agency (BRSA) came to existence and all the related functions were separated from central bank and delegated to this new supervisory and regulatory body. (Akın, Aysan, & Yıldıran, 2008)
In the light of these types of reforms the grounds were so prepared that Consequently, Turkish Banking Sector became so sound and resilient that it was not affected by the 2008 global crisis as much as its counterparts in other countries. (Öztorul, 2011) The banking sector is very important for the Turkish economy. Banks do not make intermediation only to individuals; they also intermediate to the firms in different sectors. So the performance and soundness of the banking sector is very important for almost all sectors, consequently for the Turkish economy.
World financial organizations such as Bank for International Settlement (BIS), have codified supervisory regulations in different areas. Three sets of these collections are known as Basel I, Basel II and Basel III guidelines. Basel I was announced in 1988, in which it has been emphasized on capital adequacy ratio and classification of their assets. These rules were implemented at the early 1990s in main banks. Since they showed some deficiencies in the course of time, therefore, Basel II was launched, including methods of hedging different risks, according to which internal supervision of banks was more emphasized. According to the recommendations of Basel II, rating agencies also came to the fore and took a considerable role to play in the financial industry. Subsequently, emergence of 2008 global crisis proved that the prudential rules devised by Basel committee needs to be revised and reinforced. Based on the revision, more emphasis has been given to the specific risks related to individual banks and also the weights assigned to different categories of the assets went under serious amendments. According to Basel II, banks can select reliable and independent
31
international rating institutions for external rating such as Standard & Poor’s (S&P), Fitch and Moody’s which are three well-known institutions who do this function across the globe. Bank also have to rely on Internal Rating through establishing a system for validating clients and counterparties. According to Basel suggested guideline, in Internal Rating-Based approach banks estimate the probability of non-repayment of their loans’ principle and interest and the probability of their exposure to risk through their credit rating system (Zekavat, 2008).
1.2 REVIEW OF TURKISH BANKING SYSTEM, HISTORY AND ACTUAL PICTURE
In Turkey, similar to many other countries, most of the State banks have been established on a sector oriented basis. such as Ziraat Bank in agriculture area. However, private banks are generally interrelated with large industrial groups and holdings. Money-changers in early 1800s played the role of elementary banking and The Galata bankers also as ethnic-minorities in Istanbul were performing similar functions. After the Crimean war, financial situation of the Ottoman Empires deteriorated considerably. At this time several foreign banks established their branches in Istanbul and started to lend at high interest rates. In these circumstances, the Ottoman Bank (Osmanli Bankası) was established in 1856. Its head office was in London. It functioned not only as a commercial bank but also it was performing the role of Central Bank. Of course, in the early 1930s, the Central Bank was founded. It born the regular responsibilities such as issuing banknotes, performing monetary policies, and regulating and supervising the banking system. The Central Bank also plays the role of the government banker by financing the government’s budget deficits and it also plays the role of lender of last resort for other public and private banks.
32
Before 1980 there were only 4 foreign banks in Turkey, but later on some policy reforms were taken into place according to which interest and foreign exchange rates were liberalized and foreign banks were also encouraged to operate in Turkey.
All banks in Turkey have to fully comply with the Banks Act and to the related provisions stipulated in other laws. The new Law created Banking Regulation and Supervision Agency (BRSA, or Turkish BDDK) to protect the rights of depositors. The Banks Association of Turkey (BAT, or Turkish TBB) was also legally established and plays a role as the representative body of the banking industry. It is supposed to self regulate the industry and protect the professional interests of its members. (Sansal,2016)
As of December 2016, there are a total of 47 banks operating in the Turkish banking sector with 34 deposit banks and 13 development and Investment banks. While in 11.05.2017 The Royal Bank of Scotland plc (RBS), has determined to end its operation in Turkey. RBS Turkey branch has entered into liquidation in accordance with Article 20 of the Banking Law No. 5411 related to voluntary liquidation. As of December 2016 total assets of Turkish banking sector was USD 737 billion.
Hence, as of September 2017, there are 46 banks that are working under Bank Regulation and Supervisory Agency of Turkey (BRSA-BDDK) with 10,659 branches in Turkey and 77 branches abroad. There are 33 deposit banks and 13 development and Investment banks. Deposit banks consist of 3 State-owned deposit banks ,9 Privately-owned deposit banks ,1 bank under the deposit insurance fund and 20 foreign banks. Development and investment banks comprise of 3 State-owned, 6 Privately and 4 foreign development and investment banks. (www.tbb.org.tr)
Percentage distribution of total assets among each group as of September 2017 has been illustrated in Figure1 Privately owned commercial banks have a portion of 37% of total assets banking system in Turkey. Following it State-owned commercial banks, Foreign banks, Development and investment banks have portions of 31%,26% and 6% respectively.
33
Figure 1.Distribution of Total Assets by Group (%)
Source: Bank Association of Turkey
1.3 OBJECTIVE OF THE STUDY
As a matter of fact, rating is a function which comprise of two main domains namely “Credit Scoring” and “Credit Rating”. An agency in charge of Credit Scoring normally relies on a data bank which includes a vast range of information related to Real and Legal Persons. The information for electricity, water, Telephone bills as well as the information related to quality of honoring cheque issued by the related person and also the information related to quality of honoring the installments of loans and so many other information is systematically gathered in a data bank. Credit Scoring agency tries to utilize and analysis the above-mentioned data to predict the extend of credibility of a person based on his past fiduciary actions. The second domain is related to Credit
State-owned Commercial Banks 31% Privately-owned Commercial Banks 37% Banks Under Dep.Insur.Fund 0% Foreign Banks 26% Development and Investment Banks 6%
34
Rating. A Credit Rating agency tries to look carefully in to financial statements and other financial information of a company and attempts to calculate different financial ratios and finally predict the probability of future default for company.
To keep performance of the banking sector high, knowing dynamics of it, is very important. This paper aims to analyze the performance of the banking sector in different perspectives.
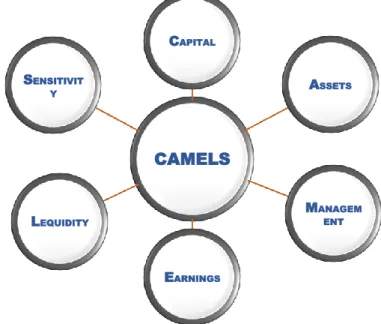
There are three approaches that have been implemented in this study. First, I have presented a rating system with a numeric range starting from 0 and ending to 100 by using all components of CAMELS ratios. The evaluation factors are as follows: Capital, Assets, Management, Earnings, Liquidity, and Sensitivity.
Figure 2. CAMELS Categories
One of the most important purpose of the rating is to evaluate the risk of debtor that may default in paying back debt. Credit risk is one of the main risks in banking and the way a bank manages credit risk is critical to its performance. “The internal
ratings approach relies on banks’ internal risk assessments, while the external ratings CAMELS CAPITAL ASSETS MANAGEM ENT EARNINGS LEQUIDITY SENSITIVIT Y
35
approach relies on externally provided risk assessments, such as credit ratings.”
(Cantor,2001)
Although the standards and criteria set by the Basel Committee are adopted by many countries, there may be differences in inter-country surveillance and control practices as they do not introduce a legal obligation in practice and are of a recommendation nature. Despite the differences between countries in the supervision and control of the banking sector, there are two main systems being implemented. These are 'On-site' and 'Off-site' systems (Çinko & Avcı, 2008).
After CAMELS rating, second approach is stress testing. Stress test helps us to locate and analyze the risks which might be latent under soft circumstances and in normal situations but, if a trigger happens, these risks can exert immense implications which may take the existence of a financial institution under serious question. Stress testing assess the effect of expected as well as unexpected shocks on a banks’ capital. Stress testing is assumed as part of the governance and risk management culture of a bank and its Results should be incorporated in the banks’ business strategies.
Last approach is ICR which gives a rank to each bank which is based on quantitative and qualitative assessment. According to these assessments we have calculated Internal credit rating (ICR) for banks. Quantitative assessment is based on some weighted selected ratios and “Qualitative Assessment” is based on some qualitative measurements such as Competitive Position, Audit Report and Ownership while CAMELS rating consists of six categories which are Capital, Asset, Management, Earing, Liquidity, Sensitivity. Each category contains of some “selected” ratios which has its own weight.
1.4 SUMMARY
Banks in today’s world play a very important role in maintaining the stability and financing different sectors of the economy in every nation. Apart from the main function of just being an institution to safeguard people’s deposit, it acts as an
36
intermediary to purvey loans to the economy and provide divers services for businesses. Therefore, the health and soundness of banks is very crucial to ensure smooth and robust economic development of any country.
World financial organizations such as Bank for International Settlement (BIS), have tried to codify some supervisory regulations. Three sets of these collections are known as Basel I, Basel II and Basel III guidelines. Basel I was announced in 1988, in which two key issues were emphasized. The first one was related to capital adequacy ratio for the banks and the other was related to classification of their assets. These rules were implemented at the early 1990s in main banks. Since in the course of time it appeared that Basel I had some deficiencies, therefore Basel II was launched which includes methods of hedging different risks. According to Basel II internal supervision of banks was more emphasized. According to the recommendations of Basel II, rating agencies also came to the fore and took a considerable role to play in the financial industry. According to Basel II, banks can select external rating and Internal Rating for assessment of their performance. Subsequently, emergence of 2008 global crisis proved that the prudential rules devised by Basel committee needs to be revised and reinforced. Based on the revision, more emphasis has been given to the specific risks related to individual banks and also the weights assigned to different categories of the assets went under serious amendments.
As of September 2017, there are 46 banks that are working under Bank Regulation and Supervisory Agency of Turkey (BRSA-BDDK) with 10,659 branches in Turkey and 77 branches abroad.
Rating is a function which comprise of two main domains namely “Credit Scoring” and “Credit Rating”. My focus is on Credit Rating, not Credit Scoring.
For this purpose, First, I have devised a rating system with a numeric range starting from 0 and ending to 100 by using all components of CAMELS ratios while the evaluation factors are as: Capital, Assets, Management, Earnings, Liquidity, and
37
Sensitivity. Second approach is stress testing. Stress testing is evaluating the impact of large, expected as well as unexpected shocks on a bank’s capital.
38
CHAPTER 2 LITERATURE
Atici and Gursoy, 2011, shed a light on the history of the activities of the banks in Turkey. Then they review a series of crises which have happened in the Turkish economy. Crisis of 1994 is one of them which was mainly related to the banking system. According to their research, the other two shocks to Turkish economy, comprise of the Russian crisis which happened in 1998, and then the earthquakes of Marmara in Turkey in 1999.
Rebel Cole and Jeffery Gunther (1995) use CAMEL ratings to assess the performance of the banks and compare it with an off- site monitoring system based on publicly available financial data. According to their findings, if a bank is not verified for more than two seasons, therefore, off-site monitoring normally result in a more credible assessment.
The banks association of Turkey has also published an article (2009) which explain the financial system and banking sector in Turkey. It also sheds a light on 2000-01 crisis in Turkey and explain the restructuring of the banking sector in Turkey.
Ali Ş en and Süleyman Solak (2011) also evaluate Turkish commercial banking sector using CAMELS ratios. They intend to verify if the CAMELS model is able to to predict banking crisis. They cover some public, private and foreign commercial banks for the period of 1995-2008.
The Turkish 2000-01 banking crisis is a research done by Koen Brinke (2013). He describes the main characteristics of the said crisis and tries to explain why this crisis happened. Then he concludes that the crisis paved the way for the authorities to reinforce the banking supervision and regulations.
39
Another study by Nabilah Rozzani and and Rashidah Abdul Rahman (2013) tries to compare the performance of Islamic banks with Conventional ones. They chose 19 conventional banks and 16 Islamic banks for 2008 to 2011. They conclude that among the main categories of CAMELS rating, Management Quality (1.00) received the best rating. Asset Quality (1.91) stood second in order, Shariah Compliance got 2.05, Capital Adequacy had a rating of 2.10, Earnings Quality and Liquidity were in the rest of the row respectively.
There are so many researches about CAMELS analysis in all around the world. For instance, in a study done by Saeid Jalili (2014) he made a comparison between the performance of banking system in Turkey and Brazil based on CAMEL rating for 2007 to 2011. 13 banks have been chosen in each country. He concludes that banks in both countries are facing cost managing problems.
Another study by M.Altan et al(2014) compares the performance of banks in Turkey using CAMEL approach between some state-owned and private banks 2005-12. It covers 15 banks. He concludes that in terms of capital adequacy component, Ada bank stands the highest. In terms of asset quality, Ziraat Bank stood on the top. As for management quality, Ak bank was the highest. Halk bank stood at the top in terms of earning quality and finally in terms of liquidity, Ziraat bank stood at top. Analyzing through CAMEL method results that Ziraat bank was totally first among other banks, then Ak bank, Vakif Bank, İş Bank and Garanti bank are the other efficient banks. Aydin Karapinar and Ismail Cagri Dogan (2015) demonstrated performance of the participation banks in Turkey. To do this, the CAMELS approach was employed for the comparison of the performance and determination of the differences between the two types of banking practices.
Ishaq AB et al (2016) also by choosing ten commercial banks in Pakistan for 2007-2013 have tried to verify the banks performance based on CAMELS rating.
40
Specific aspects of my research which distinguish mine from the others are as follows:
- Time period which covers the span of 2005-2016
- The particular composition of Turkish banks set comprising of Ziraat Bank and HalkBank which are state owned, AK Bank, İşbank and Şekerbank which are private one and Garanti Bank which is a foreign one.
- Having three parallel methods namely: CAMELS, ST and ICR - Presenting comparative analysis for all the designated banks.
- Testing the credibility of provided rating results in this research with the findings of worldwide well known rating agencies.
41
CHAPTER 3
BASEL PROVISIONS AND INTERNATIONAL CREDIT RATING AGENCIES
3.1. INTRODUCTION
During the history in different parts of the world, many banks bankrupted although wouldn’t expect to get stuck this way. Actually, it is not possible to remove the probability of failure for a typical bank regardless of its size or its geographic location. Initiative of deposit insurance taken into place by government may have positive impact on financial stability and boosting public confidence on financial institution, but the governments have to create a situation to prevent banks from encountering moral hazard by lending without proper care. That is why beside deposit insurance, there should be efficient rules and regulations to be followed by the financial institutions very scrupulously and there should be an efficient supervision in place to avoid systematic risk. “Systematic risk “is the risk that a failure by large bank will lead to failures by other large banks and a collapse of the financial system.
Basel Accord as an agreement created in in 1988, indicate the onset of international standards for bank regulations. Of course, Since 1988, bank regulation has undergone an evolutionary process. Basel Accords paved the way for rating agencies to take a considerable role and this way the industry of credit rating has also evolved considerably.
The main role of rating agency is to determine the probability of default for a company or an instrument issuable by a company. In fact, these rates are the risk managements heads and rating agencies tools also play an important role in this regard.
42
The credit rating industry has grown considerably because of expansion in financial markets. Besides, due to the impact of these institutions' declarations on the decisions made by decision makers, law enforcers, therefore, monitoring of the activities of these institutions is of great importance.
3.2. BANK PRUDENTIAL REGULATIONS BEFORE 1988
Before 1988, in every country there was sort of prudential rule to regulate the required minimum size of capital compare to the total asset size. However, definition of capital and the manner of calculating capital adequacy ratio in terms of defining different categories of the assets and weight associated to every category would differ from one country to another. In some countries prudential rules were being applied very strictly while in others the situation was different. This was despite the fact that in the course of time global interaction of the banks was increasing. Banks were competing with each other in the global scene in a more sensible way. According to this new trend of globalizations banks needed to evaluate each other on the basis of some common criteria and specific financial ratios. But in the absence of unique standards and uniform regulations, in some countries where regulation and supervision have been more slack, the banks had competitive advantage over their competitors in the countries where stricter rules and supervisions were in place. In addition, the huge exposures created by loans from the major international banks to less developed countries such as Mexico, Brazil, and Argentina, as well as the accounting games sometimes used for those exposures were starting to raise questions about the adequacy of capital levels. Another problem was that banks in order to tackle with new emerging needs of the customers and the markets gradually tried to introduce new products such as interest rate swaps, currency swaps, and foreign exchange options. These contracts increase the credit risks being taken by bank.
That’s why the Basel Committee was established in 1974 comprising of representatives from Belgium, Canada, France, Germany, Italy, Japan, Luxembourg, The Netherlands,
43
Sweden, Switzerland, under the patronage of the Bank for International Settlements. The first major outcome of their efforts was materialized in the form of a document which has been entitled as “International Convergence of Capital Measurement and Capital Standards.” This was referred to as “The 1988 BIS Accord” or just “The Accord”. Later it became known as Basel I. (Risk Management and Financial Institutions, Hull, Fourth Edition, Chapter 15)
3.3. THE 1988 BIS ACCORD
The 1988 BIS Accord was the first attempt to set international uniform standards for capital adequacy. The criticism soon emerged that these uniform standards for defining capital adequacy ratio had been too simple and somewhat arbitrary. The key innovation in 1988 Accord was Cooke ratio. It is related to the calculation of credit risk exposures which are born by the banks on-balance-sheet as well as off-balance-sheet. In other words, it was related to the manner of calculating the bank’s total risk weighted assets. Credit risk exposures would be divided into three categories:
1. Credit risk exposures related to on-balance sheet assets (excluding derivatives)
2. Credit risk exposures related to off-balance sheet items (excluding derivatives)
3. Credit risk exposures related to over-the-counter derivatives
The Accord required banks to observe a minimum capital adequacy ratio of 8% of the risk-weighted assets and the nominator, more precisely, the capital was comprised of two segments: Tier 1 Capital which includes items such as equity and non-cumulative preferred stock. (Goodwill is subtracted from equity.) Tier 2 Capital or supplementary
44
Capital which includes instruments such as cumulative perpetual preferred stock. (Risk Management and Financial Institutions, Hull, Fourth Edition, Chapter 15)
3.4. BIS 98
In 1995, the Basel Committee issued a consultative proposal known as the “1996 Amendment.” It was implemented in 1998. It requires to keep capital for the market risks associated with trading activities. Marking to Market or fair value accounting is the practice of revaluating assets and liabilities on a daily basis. Banks are required to use fair value accounting for all assets and liabilities that are held for trading proposes which includes most derivatives, marketable securities, foreign currencies, and commodities. Banks are not required to use fair value accounting for assets that are expected to be held for the whole of their life for investment purposes such as loans and some debt securities (Risk Management and Financial Institutions, Hull, Forth Edition, Chapter 15)
3.5. BASEL II
It was perhaps unfortunate for Basel II that its implementation date coincided, at least approximately, with the start of the worst crisis that financial markets had experienced since the 1930s. Basel II as the second international banking regulatory accord amended the rules for minimum capital requirements. The main difference between Basel II and Basel I is that for determination of regulatory capital ratio, the Basel II incorporates credit risk of assets held by financial institutions. The Basel II has three pillars namely minimum capital requirements, regulatory supervision and market discipline.
45
3.6. BASEL III
Basel III concentrated on reinforcing the stability of the financial system by increasing the quantity and quality of regulatory capital and liquidity. In the context of increasing bank supervision in the financial markets, the Basel Committee has taken significant steps around the world and has provided several guidelines along with effective ways to improve banking system. First version of Basel III has been published by Basel Committee in 2009. Mainly it is a reaction to credit crisis. Basel III made the prudential regulations related to capital adequacy ratio more stringent. Banks were required to keep higher CAR proportionate to their own specific risks and the weights which have been assigned to different categories of assets have been revised. (Schneider, Schröck, Koch, & Schneider, 2017)
3.7. NOTION OF CREDIT RATING
Credit Rating is an opinion normally expressed by a rating agency which indicates that to what extent the issuer of a debt instrument is willing or able to honor its debt service obligations as and when they arise. Rating is usually presented by alphabetical or alphanumeric symbols. Symbols are easily understood and help the beneficiary audience to differentiate between debt instruments based on the creditworthiness of the issuer. Credit rating establish a relation between risk and return. It also helps the issuers of debt instruments price their issues (whether it is CDs or bonds or whatever else) correctly and communicate with counterparties. Regulators such as central banks also use credit rating to evaluate the eligibility of a Financial Institution (FI) and permit it to issue a particular instrument. It just evaluates the probability of default and does not make any recommendation about buying or selling any instrument. The user of CR is free to accept or reject the results. Ultimately CR is a window which helps to decide more accurately however there is a possibility that may prove wrong some times. CR’s importance has grown in the course of time due to the following factors:
46
- Increasing level and incidences of defaults in the course of time - Growth of IT
- Globalization of financial markets
- Increasing role of capital and money markets - Privatization
- Securitization of debt
The rating symbols assigned to an issuer indicate the followings: - Nature and the term of a particular issue
- Ability and willingness to honor obligations - Probability of a default
- Degree of protection available to investors
The general factors determining what level of rating should be assigned are as follows: - Ability and willingness of the issuer to honor its obligations
- Volume and composition of its outstanding debt - Stability of the future cash flows of the company
- Interest coverage ratio in terms of how many number of times the issuer is able to meet its fixed interest obligations
- Ratio of current assets to current liabilities - Market position of the company
- Its track record in terms of directors and expertise staff
External CRs are normally done at the request of the issuers and only those ratings which are accepted by the issuers can be published for the first time. Thus once a rating is accepted, it is published and subsequent changes by the rating agency will be published even without the consent of the issuer. If the issuer is not satisfied with the results, it can request a review and it can provide additional information to the rating agency. However, the external rating agency is independent to assess. The important criterion upon which the external rating agencies are being normally assessed is the public opinion towards them in terms of quality and independence. Rating is normally done for a particular issue not for the issuer. Rating process may not only involve