International Journal of
Agriculture, Environment and Food Sciences
Assessment of quality characteristics of fried zucchini slices,
pre-dried with osmotic dehydration
Sehriban Gul Ozcelik1,2 Erkan Karacabey2,*
1Beykent University, School of Health Sciences, Nutrition and Dietetics, 34100, İstanbul, Turkey 2SuleymanDemirel University, Engineering Faculty, Food Engineering Department, 32200, Isparta, Turkey
*Corresponding Author: [email protected]
In this study, it was aimed to investigate the quality characteristics of fried zucchini slices pre-dried using osmotic dehydration (OD) method at varying conditions (salt concentration, vacuum or ultrasound application, time). Textural properties (hardness, elasticity, cohesiveness, chewiness, firmness), surface color values (L*, a*, b*), moisture and oil content of the final product were determined. Textural properties did not change with OD applications (p>0.05). Vac-uum and solution concentration applied during OD method had significant effects on surface color values (p≤0.05). OD did not cause any significant change in final moisture and oil content of the fried product. In case of ultrasound assisted osmotic dehydration (US-OD), it was seen that the effect of time on moisture content was important the solution concentration of 5% (p≤0.05). On the other hand, changes at salt concentration have created significant differences in both the application process (p≤0.001). When solution concentration was 0%, effect of time was neg-ligible to oil content (p>0.05). Notwithstanding, the solution concentration for both processing time was found to be significant (p≤0.05).
Keywords: Osmotic dehydration, Ultrasound, Frying, Textural properties, Surface color values, Moisture content Research Article
JAEFS www.jaefs.com
Int J Agric Environ Food Sci 3(4):220-225 (2019)
Abstract
e-ISSN : 2618-5946 DOI: 10.31015/jaefs.2019.4.4
Introduction
Frying is a treatment applied to enhance the taste and reli-ability of food (Blumenthal, 1991). In this process, the prod-ucts are generally immersed into a hot oil, heated by a heat source to around 150 to 190 ° C and frying material is kept in oil until its color, flavor, and texture meet to the consumer’s de-mand (Choe & Min, 2007; Dobarganes, Márquez-Ruiz, & Ve-lasco, 2000). But, at this method, too much oil penetrates into the fried product and the foods having high oil content are as-sociated with many diseases (Bingol, Zhang, Pan, & McHugh, 2012). This is the challenge according to new consumer trends. Different frying processes have been developed and tested to reduce oil absorption (Da Silva & Moreira, 2008; Naz, Sid-diqi, Sheikh, & Sayeed, 2005). One of the processes used is the pre-drying process. As a pre-treatment different methods could be used. One of them is the osmotic dehydration (OD). Mass transfer rate of OD process is generally low, when it is ap-plied alone. Therefore, in order to accelerate the mass transfer
taking place, OD may be conducted with processes like vacu-um, microwave, ultrasound, and/or centrifugal force applica-tion (Corzo vd. , 2007; Rastogi vd. , 2002). It has been proven that ultrasound-assisted OD technology allows to work at low temperatures, with high water loss (Fernandes vd. , 2008; Gar-cia-Noguera vd. , 2010).
In this context, pre-drying of zucchini slices by OD applied alone or with ultrasound or under vacuum was the aim of the study. Its effects on moisture and oil content of fried zucchinis as well as on their quality characteristics were evaluated.
Materials and Methods Materials
Zucchini (Cucurbita pepo L. cv) was purchased from a lo-cal market in Isparta, Turkey, and stored in a polyethylene bags in a refrigerator at 4°C before use.
Preparation of Zucchini Slices
About 100g zucchini, removed from the refrigerator, was
Cite this article as:
Ozcelik, S.G., Karacabey, E. (2019). Assessment of quality characteristics of fried zucchini slices, pre-dried with osmotic dehydration. Int. J. Agric. Environ. Food Sci., 3(4), 220-225
DOI: https://dx.doi.org/10.31015/jaefs.2019.4.4
Received: 08 July 2019 Accepted: 09 November 2019 Published: 24 December 2019 Year: 2019 Volume: 3 Issue: 4 (December) Pages: 220-225
Available online at : http://www.jaefs.com - http://dergipark.gov.tr/jaefs
Copyright © 2019 International Journal of Agriculture, Environment and Food Sciences (Int. J. Agric. Environ. Food Sci.) This is an open access article distributed under the terms of the Creative Commons Attribution 4.0 International (CC-by 4.0) Licens
washed, peeled and sliced (3×10⁻³ m thick) using an industrial
type slicer (Arisco, HBS-200; Çiğili, ˙ Izmir, Turkey). After-wards, zucchini slices were subjected to blanching for 90s in a hot water at 85°C for enzyme inactivation and excess surface water was removed using absorbent paper.
Osmotic Dehydration Method
Zucchini slices being at 3 mm slice thickness (1:4 (kg sam-ple / L solution) ratio) was depth for 80 min in different NaCl solutions (10% and 15%) at constant temperature (40°C) water bath (J.P SELECTA S.A, Precisdig 6001238, SPAIN).
Vacuum-Assisted Osmotic Dehydration Method
Zucchini slices being at 3 mm slice thickness (1:4 (kg sam-ple / L solution) ratio) were depth in different NaCl solutions (10% and 15%) at 40°C and then the atmospheric pressure in an application chamber was reduced to 31 kPa by vacuum pump (ROCKER, Rocker 300, CHINA) and held in these conditions for 10 min. Afterwards, the vacuum pressure was released up to atmospheric pressure and samples were continued to be kept for additional 70 min in the same solution.
Ultrasound Assisted Osmotic Dehydration Method
Zucchini slices in a 3 mm slice thickness (1:4 (kg sample / L solution) ratio) was depth for 10 or 20 min in different NaCl solutions (5%, 10% and 15%) which were kept at the constant temperature level of 40°C. During osmotic application, ultra-sonic treatment was also conducted at constant power level of 50% by ultrasonic probe (Ultrasonic-Homogenizer, CY-500, Spain). Instead of osmotic solution, distilled water was used a control.
Deep-Fat-Frying
End of OD applications, partially dried zucchini slices was fried in 3L of sunflower oil (Marsa Oil Industry Co. Ltd., Is-tanbul, Turkey) at 180° C for 1 min. Temperature (180°C) and time (1 min) were the corresponding values of deep-fat-frying process which was determined according to our previous study (Özçelik, 2015). In that study, sensory analysis was conducted to determine the frying conditions to achieve the fried zucchini slices (3mm thickness) taking the highest score from general acceptance. An industrial type fryer (Remta Co. Ltd., Istanbul, Turkey) was used for deep-fat-frying. After frying, the fried zucchini slices were removed from the oil and kept for 300s over a wire screen to drain the most of the surface oil and then excess surface oil, still remaining, was removed by tissue pa-per. Oil content, moisture content, breaking force, and L*, a*, b* values were measured in these fried slices.
Analysis of Samples Moisture Content
The method of AOAC (1995) was used. Zucchini slices were ground after frying. Five grams of ground zucchini was used for moisture content. Ground sample was dried in an oven (FN300; Nüve, Akyurt, Ankara, Turkey) at 105±0.5°C, until no weight change was attained. The test was performed in du-plicate.
Oil Content
The oil determination method reported by James (1995) was used with modification. Briefly, oil extraction was per-formed in a Soxhlet extractor (Büchi Universal Extraction System B-811; Postfach, Flawil, Switzerland) using hexane as
a solvent to determine the oil content of fried zucchini slices. Before extraction, fried zucchini (5g) was dried in a vacuum oven at 60°C and then ground. Oil content (g.kg-1) was
calcu-lated as wet bases. The test was performed in duplicate.
Surface Color
Color measurements of examples were determined using Minolta Color Meter (CR-10, Konica Minolta, Osaka, Japan) and expressed by CIE (L *, a *, b *) color system (Robertson, 1977). Five zucchini slices were used for each measurement and at five different locations for each slice. Results were given as a mean of five slices.
Breaking Force
Breaking force for fried zucchini slices was determined according to Bourne (1978). A texture analyzer (TA.XTPlus; Stable Micro Systems Co. Ltd, Godalming, UK) was used for measurement of the breaking force of the samples. In order to measure the force requirement to break fried sample, a Perspex blade (A/LKB) was used. Probe movement speed was 1×10⁻³
ms-1 and initial distance from the platform was set as 25×10-3
m. The breaking force was expressed in gram force. All texture tests were immediately performed after frying process. Each result was given as a mean of five measurements.
Statistical Analysis
Results are the mean of two replicates. The influences of process conditions were evaluated by Tukey–ANOVA test comparing treatments. Differences between treatments were judged at the 5% significance level (p≤0.05) using Minitab (Minitab 14.12.0) (Minitab Inc., State College, PA).
Results and Discussion
The influences of pretreatment for partial drying of zuc-chini slices were investigated in terms of textural properties, surface color, moisture and oil content. Both methods were conducted at different conditions, so the effects of process pa-rameters were also evaluated.
Osmotic Dehydration
Effect of osmotic dehydration (OD) and simultaneous vac-uum application on textural properties, moisture, oil content, surface color values of the final product were examined. All measured values and corresponding statistical analysis were given in Table 1a and Table 1b. Each application was coded with capital letter and these codes were also defined in Table 1a and Table 1b.
Textural Properties
Textural properties of any processed food are important due to their direct effects on consumer’s perceptions. Thus, they should be determined and carefully evaluated to clearly figure out the influence of any intended process on final productqual-ity in terms of textural characteristics. Fried food materials are also considered in this regard and their textural properties are required to be represented. In current study, OD was used for partial drying of zucchini slices before frying and its param-eters NaCl concentration of osmotic solution and application of vacuum were investigated. In order to evaluate the effects of parameters on hardness, elasticity, cohesiveness, chewiness and firmness of zucchini slices, they were statistically analyzed and the results were given in Table 2. The results indicated that
neither the concentration of NaCl in the hypertonic solution nor the vacuum application creates any significant effect on elasticity, cohesiveness, chewiness and firmness of the fried zucchini slices (p>0.05) (Table 2). Additionally, OD, itself, also did not change the elasticity, cohesiveness, chewiness and firmness of fried slices compared to the control samples (K-21) (p>0.05) (Table 1a).
According to Table 1, hardness value of N-coded applica-tion (at 40°C, at 80 min, OD 15% NaCl) was different from hardness value of control group (K-21). However, other tex-tural values of N-coded application and all textex-tural values of all other OD applications (N, O, L, M) were not different from control group (K-21). The effects of time and concentration changes on the hardness values were shown at Figure 1.
As can be seen from Figure 1 that, an increase in NaCl con-centration significantly increased the sample’s hardness value (p≤0.05), whereas vacuum did not create any change (p>0.05).
Surface Color Values
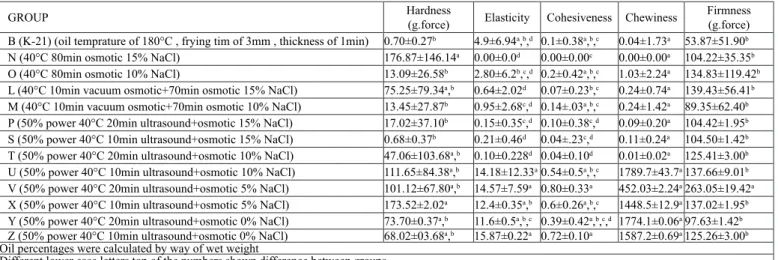
Another quality attribute is the surface color of food prod-ucts, since it gives idea about the quality of product. Thus, it is used as a strong marketing tool. In this regard, surface col-or of fried products also gains high impcol-ortance. In this study, surface color of fried zucchini slices was measured after fry-ing process. The results were given in Table 1b. Surface col-or was described with three colcol-or parameters, L*, a*, and b*. From Table 1b it can be concluded that, surface color values of all OD applications (N, O, L, M) were different from control group (K-21) (p≤0.05). Firmness (g.force) 53.87±51.90b 104.22±35.35b 134.83±119.42b 139.43±56.41b 89.35±62.40b 104.42±1.95b 104.50±1.42b 125.41±3.00b 137.66±9.01b 263.05±19.42a 137.02±1.95b 97.63±1.42b 125.26±3.00b
Oil percentages were calculated by way of wet weight
Different lower case letters top of the numbers shown difference between groups
Chewiness 0.04±1.73a 0.00±0.00a 1.03±2.24a 0.24±0.74a 0.24±1.42a 0.09±0.20a 0.11±0.24a 0.01±0.02a 1789.7±43.7a 452.03±2.24a 1448.5±12.9a 1774.1±0.06a 1587.2±0.69a Cohesiveness 0.1±0.38a,b,c 0.00±0.00c 0.2±0.42a,b,c 0.07±0.23b,c 0.14±.03a,b,c 0.10±0.38c,d 0.04±.23c,d 0.04±0.10d 0.54±0.5a,b,c 0.80±0.33a 0.6±0.26a,b,c 0.39±0.42a,b,c,d 0.72±0.10a Elasticity 4.9±6.94a,b,d 0.00±0.0d 2.80±6.2b,c,d 0.64±2.02d 0.95±2.68c,d 0.15±0.35c,d 0.21±0.46d 0.10±0.228d 14.18±12.33a 14.57±7.59a 12.4±0.35a,b 11.6±0.5a,b,c 15.87±0.22a Hardness (g.force) 0.70±0.27b 176.87±146.14a 13.09±26.58b 75.25±79.34a,b 13.45±27.87b 17.02±37.10b 0.68±0.37b 47.06±103.68a,b 111.65±84.38a,b 101.12±67.80a,b 173.52±2.02a 73.70±0.37a,b 68.02±03.68a,b GROUP
B (K-21) (oil temprature of 180°C , frying tim of 3mm , thickness of 1min) N (40°C 80min osmotic 15% NaCl)
O (40°C 80min osmotic 10% NaCl)
L (40°C 10min vacuum osmotic+70min osmotic 15% NaCl) M (40°C 10min vacuum osmotic+70min osmotic 10% NaCl) P (50% power 40°C 20min ultrasound+osmotic 15% NaCl) S (50% power 40°C 10min ultrasound+osmotic 15% NaCl) T (50% power 40°C 20min ultrasound+osmotic 10% NaCl) U (50% power 40°C 10min ultrasound+osmotic 10% NaCl) V (50% power 40°C 20min ultrasound+osmotic 5% NaCl) X (50% power 40°C 10min ultrasound+osmotic 5% NaCl) Y (50% power 40°C 20min ultrasound+osmotic 0% NaCl) Z (50% power 40°C 10min ultrasound+osmotic 0% NaCl)
Oil (%) 73.09±1.33a 41.27±0.15c,d,e 47.93±1.66c,d 43.53±3.32c,d 43.68±4.30c,d 46.64±0.51c,d 48.76±0.37c,d 45.59±0.25c,d 37.41±1.65d,e 33.58±2.83e 46.17±2.30b 56.65±10.02b 42.94±0.16c,d
Oil percentages were calculated by way of wet weight
Different lower case letters top of the numbers shown difference between groups
Moisture (%) 19.65±1.92e 34.63±0.65d 36.22±4.65d 32.66±1.00d 34.20±4.65d 19.57±0.92e 24.31±0.65e 34.54±0.28d 44.94±3.70c 66.83±0.41b 49.52±1.08c 70.77±0.13b 79.22±0.16a b* 25.03±2.86h 39.72±1.43b,c,d 41.42±2.68a,b 34.32±3.35g 42.59±1.74a 35.63±2.51f,g 39.29±2.37c,d 38.61±3.02c,d,e 37.97±3.38d,e 40.11±7.54b,c 37.29±2.72e 35.80±2.33f,g 38.37±2.00c,d,e a* 2.00±3.91g 7.21±1.99a,b,c 5.15±1.66d,e 3.33±2.05f 6.13±1.60b,c,d 7.37±2.72a,b 6.44±1.99b,c 8.21±2.07a 4.00±1.32e,f 7.99±2.21a 5.04±1.66d,e 4.99±1.22d,e 6.04±1.13c,d L* 62.24±7.10d 74.57±2.50b,c 74.94±1.69b 78.38±2.30b 73.35±1.94b,c 74.40±3.29a,b 72.56±2.85b 70.52±6.60d 74.77±1.69b 70.50±2.84d 74.46±1.73b,c 74.73±1.55b 74.12±1.31b,c GROUP
B (K-21) (oil temprature of 180°C , frying tim of 3mm , thickness of 1min) N (40°C 80min osmotic 15% NaCl)
O (40°C 80min osmotic 10% NaCl)
L (40°C 10min vacuum osmotic+70min osmotic 15% NaCl) M (40°C 10min vacuum osmotic+70min osmotic 10% NaCl) P (50% power 40°C 20min ultrasound+osmotic 15% NaCl) S (50% power 40°C 10min ultrasound+osmotic 15% NaCl) T (50% power 40°C 20min ultrasound+osmotic 10% NaCl) U (50% power 40°C 10min ultrasound+osmotic 10% NaCl) V (50% power 40°C 20min ultrasound+osmotic 5% NaCl) X (50% power 40°C 10min ultrasound+osmotic 5% NaCl) Y (50% power 40°C 20min ultrasound+osmotic 0% NaCl) Z (50% power 40°C 10min ultrasound+osmotic 0% NaCl)
Table 1a. Textural properties, surface color values, moisture (%) and oil content (%) of osmotic pre dried combined fried zucchini slices
Table 1b. Textural properties, surface color values, moisture (%) and oil content (%) of osmotic pre dried combined fried zucchini slices
Table 2. Significance of effect of corresponding parameter on textural properties
Parameter Elasticity Cohesiveness Chewiness Firmness
Solution Concentration (SC) 0.286ns 0.250ns 0.361ns 0.747ns
Vacuum (Vc) 0.676ns 0.941ns 0.627ns 0.865ns
SC*Vc 0.392ns 0.588ns 0.369ns 0.188ns
-200,00 ,00 200,00 400,00 L M N O Hardness B,a A,a A,a B,a
Figure 1. Effect of the vacuum and the solution concentra-tion on the hardness.
L : 40°C 10min vacuum osmotic+70min osmotic 15% NaCl; M : 40°C 10min vacuum osmotic+70min osmotic 10% NaCl; N : 40°C 80min osmotic 15% NaCl; O : 40°C 80min osmotic 10% NaCl
Different lower case letters top of the bars indicate the sig-nificant effect of vacuum.
Different upper case letters top of the bars indicate the sig-nificant effect of solution concentration.
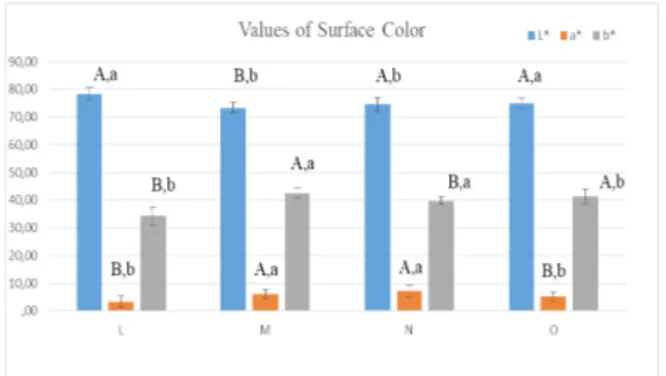
Figure 2 shows the change in each color parameter with the effects of NaCl concentration and vacuum application. The brightness, L* was found to be changed with NaCl concen-tration increased from 10% to 15%, when OD was conducted under vacuum (p≤0.05), whereas no significant difference was seen with changing concentration (p>0.05) in case of no vac-uum. The effect of vacuum was also analyzed and compared with OD under atmospheric pressure. Vacuum application caused a significant change in L* value for both cases, under vacuum or at atmospheric pressure (p≤0.05) (Figure 2).
Figure 2. Effect of the vacuum and the solution concentra-tion on the surface color values
L : 40°C 10min vacuum osmotic+70min osmotic 15% NaCl; M : 40°C 10min vacuum osmotic+70min osmotic 10% NaCl; N : 40°C 80min osmotic 15% NaCl; O : 40°C 80min osmotic 10% NaCl
Different lower case letters top of the bars indicate the sig-nificant effect of vacuum.
Different upper case letters top of the bars indicate the sig-nificant effect of solution concentration.
Vacuum and the solution concentration effects were im-portant for a* and b* values (p≤0.05) (Figure 2). Vacuum ef-fect was significant for both solution concentration (10% and 15%) on a* values (p≤0.05). Vacuum application caused an in-crease in a* value in case of 10% NaCl solution use, whereas it
reduced a* values in case of 15% NaCl solution use (p≤0.05). The effect of solution concentration was also significant on a* values (p≤0.05). a* value increased with rise of solution concentration under atmospheric pressure, whereas it was de-creased with NaCl concentration in vacuum assisted OD. b* was changed with NaCl concentration increased from 10% to 15% when OD was conducted under vacuum or atmospheric pressure (p≤0.05) (Figure 2). b* values were decrease with the increase in concentration of the solution irrespective of vac-uum applied or not. A significant difference in b* values was seen depending on vacuum application, as well (p≤0.05) (Fig-ure 2).
Moisture and Oil Content
The statistical values of moisture% and oil% were given at Table 1b. As can be seen from Table 1b that, moisture% and oil% values of all OD applications were different from moisture% and oil% values of control group (K-21). Table 3 displays the influences of NaCl concentration and vacuum ap-plication on moisture and oil content of fried zucchini slices. As can be seen from Table 3 that, none of the variables caused any significant change in moisture and oil content of zucchini slices (p>0.05). In other words, OD caused a change in mois-ture and oil content of final fired zucchini slices, this effect was not related to its process parameters investigated in this study. Oil content of final fried zucchini slices was reduced to almost to half of that measured for control group (K-21). However, it should be considered that moisture content remained high compared to control group (Table 1b).
Table 3. Significance of effect of corresponding parameter on moisture (%) and oil (%)
Parameter Moisture% Oil%
Solution Concentration (SC) 0.665 ns 0.165 ns
Vacuum (Vc) 0.572 ns 0.648 ns
SC*Vc 0.994 ns 0.180 ns
ns: shown that negligible of the difference between groups.
Ultrasound-Assisted Osmotic Dehydration
Effect of ultrasound assisted osmotic dehydration (US-OD) applications on textural properties, moisture and oil content, surface color values of the final product were examined. Cor-responding code for each application and all statistical data for these trials were given in Table 1a and Table 1b.
Textural Properties
From Table 1a, it is seen that all textural properties of US-OD applications (P, S, T, U, V, X, Y, Z) generally were not different from control group (K-21).
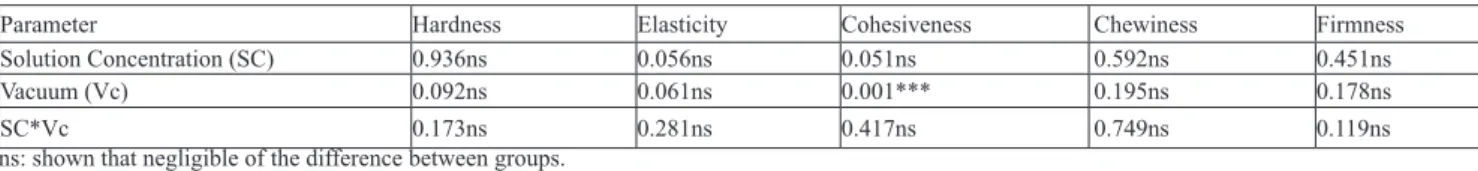
The effects of solution concentration and time on textural properties were shown in Table 4. Change of time significantly affected cohesiveness values of fried zucchini slices (p≤0.001). Changes in solution concentration and time did not create any significant effect on other textural properties (p>0.05) (Table 4).
Surface Color Values
Statistically obtained surface color values of US-OD ap-plications were in Table 1b. It has been seen that surface color values of US-OD applications (P, S, T, U, V, X, Y, Z) were
different from control group (K-21) as a general trend. The effects of changes in time and concentration on surface color values were shown in Figure 3. L* values of zucchini slices processed at all solution concentrations except for 0% concentration were significantly affected by time (p≤0.05). Also, different salt concentrations for each application time (10min and 20min) were found to be important (p≤0.001). An-other color parameter, a* value was also found to be varied with time significantly (p≤0.001), except for the samples treat-ed with 15% osmotic solution (p>0.05). Time change caustreat-ed a significant variation in b* values of the fried zucchini slices when they were subjected to osmotic treatment at solution con-centration of 0% or 15% (p≤0.05). However, time effect on b* value disappeared when concentration of osmotic solution was 5% or 10% (p>0.05).
Another process parameter, the concentration of osmotic solution was found to significantly affect the surface bright-ness of fried zucchini slices (p≤0.01). Similar trend was seen for color parameters of a* and b* values of samples and they significantly changed with concentration (p≤0.01).
Moisture and Oil
Moisture (%) and oil (%) values of zucchini slices pro-cessed by US-OD applications (P, S, T, U, V, X, Y, Z) were given in Table 1b, and compared with control group. When moisture (%) and oil (%) values of zucchini slices produced with US-OD application were compared with those for control group (K-21), it was seen that they were different form control group.
Figure 3. Effect of the time and the solution concentration on the surface color values
P 50% power 40°C 20 min ultrasound+osmotic 15% NaCl; S 50% power 40°C 10min ultrasound+osmotic 15% NaCl; T 50% power 40°C 20min ultrasound + osmotic 10% NaCl; U 50% power 40°C 10min ultrasound + osmotic 10% NaCl; V 50% power 40°C 20min ultrasound + osmotic 5% NaCl; X 50% power 40°C 10min ultrasound + osmotic 5% NaCl; Y 50% power 40°C 20min ultrasound + osmotic 0% NaCl; Z 50% power 40°C 10min ultrasound + osmotic 0% NaCl
Different lower case letters top of the bars indicate the sig-nificant effect of time.
Different upper case letters top of the bars indicate the sig-nificant effect of solution concentration.
Figure 4. Effect of the vacuum and the solution concentra-tion on the moisture (%) values
P 50% power 40°C 20 min ultrasound+osmotic 15% NaCl; S 50% power 40°C 10min ultrasound+osmotic 15% NaCl; T 50% power 40°C 20min ultrasound + osmotic 10% NaCl; U 50% power 40°C 10min ultrasound + osmotic 10% NaCl; V 50% power 40°C 20min ultrasound + osmotic 5% NaCl; X 50% power 40°C 10min ultrasound + osmotic 5% NaCl; Y 50% power 40°C 20min ultrasound + osmotic 0% NaCl; Z 50% power 40°C 10min ultrasound + osmotic 0% NaCl
Different lower case letters top of the bars indicate the sig-nificant effect of time.
Different upper case letters top of the bars indicate the sig-nificant effect of solution concentration.
Figure 4 and Figure 5 showed that the effect of time on moisture and oil content of zucchini slices. Time was only ef-fective on moisture content of fried samples, when solution concentration was 5% (p≤0.05). On the other hand, oil con-tent was found to be changed with time almost for all trials (p≤0.05), except for those performed when just water was used as an osmotic medium (p>0.05). Changes in salt concentration caused significant differences in the final moisture and oil con-tents of processed zucchini slices (p≤0.001).
Figure 5. Effect of the vacuum and the solution concentra-tion on the oil (%) values
P 50% power 40°C 20 min ultrasound+osmotic 15% NaCl; S 50% power 40°C 10min ultrasound+osmotic 15% NaCl; T 50% power 40°C 20min ultrasound + osmotic 10% NaCl; U 50% power 40°C 10min ultrasound + osmotic 10% NaCl; Table 4. Significance of effect of corresponding parameter on textural properties
Parameter Hardness Elasticity Cohesiveness Chewiness Firmness
Solution Concentration (SC) 0.936ns 0.056ns 0.051ns 0.592ns 0.451ns
Vacuum (Vc) 0.092ns 0.061ns 0.001*** 0.195ns 0.178ns
SC*Vc 0.173ns 0.281ns 0.417ns 0.749ns 0.119ns
ns: shown that negligible of the difference between groups. ***: shown that significance of the difference between groups.
V 50% power 40°C 20min ultrasound + osmotic 5% NaCl; X 50% power 40°C 10min ultrasound + osmotic 5% NaCl; Y 50% power 40°C 20min ultrasound + osmotic 0% NaCl; Z 50% power 40°C 10min ultrasound + osmotic 0% NaCl
Different lower case letters top of the bars indicate the sig-nificant effect of time.
Different upper case letters top of the bars indicate the sig-nificant effect of solution concentration.
Conclusion
Textural properties of OD applications and US-OD did not differ from that processed as a control group, whereas moisture (%), oil (%) and surface color values of OD applications and US-OD were different from those values determined for con-trol group as general trend.
OD process parameters did not create any significant vari-ation in textural properties for almost all OD applicvari-ations in general extent. Effects of vacuum and osmotic solution con-centration were found to be significant for surface color values, but in different levels. Nevertheless, different parameters of OD applications were negligible on moisture (%) and oil (%) values.
When the parameters’ effects of US-OD processes were evaluated, it was found that textural properties, moisture (%) and oil (%) values were not affected by almost all OD applica-tions in general extent. Surface color values were affected by the effects of vacuum and concentration of osmotic solution.
Unchanged textural properties and reduced oil (%) content for zucchini slices were obtained with OD and US-OD appli-cations in this study.
Acknowledgements
This research was financially supported by “Suleyman Demirel University Scientific Research Projects Office”, Tur-key (Project number: 4201-YL1-14).
References
AOAC. (1995). Official methods of analysis (16th ed.).
Bingol, G., Zhang, A., Pan, Z., & McHugh, T. H. (2012). Producing lower-calorie deep fat fried French fries using infrared dry-blanching as pretreatment. Food Chemistry, 132(2), 686-692 [CrossRef]
Bourne, M. C. (1978). Texture profile analysis [Food acceptability]. Food technology.
Choe, E., & Min, D. (2007). Chemistry of deep-fat frying oils. Journal of food science, 72(5), R77-R86 [CrossRef]
Corzo, O., Bracho, N., Rodríguez, J., & González, M. (2007). Predict-ing the moisture and salt contents of sardine sheets durPredict-ing vacuum pulse osmotic dehydration. Journal of food engi-neering, 80(3), 781-790 [CrossRef]
Da Silva, P. F., & Moreira, R. G. (2008). Vacuum frying of high-qual-ity fruit and vegetable-based snacks. LWT-Food Science and Technology, 41(10), 1758-1767 [CrossRef]
Dobarganes, C., Márquez-Ruiz, G., & Velasco, J. (2000). Interactions between fat and food during deep-frying. European Jour-nal of Lipid Science and Technology, 102(8-9), 521-528 [CrossRef]
Fernandes, F. A., Gallão, M. I., & Rodrigues, S. (2008). Effect of os-motic dehydration and ultrasound pre-treatment on cell structure: Melon dehydration. LWT-Food Science and Technology, 41(4), 604-610 [CrossRef]
Garcia-Noguera, J., Oliveira, F. I., Gallão, M. I., Weller, C. L., Ro-drigues, S., & Fernandes, F. A. (2010). Ultrasound-as-sisted osmotic dehydration of strawberries: Effect of pretreatment time and ultrasonic frequency. Drying Tech-nology, 28(2), 294-303 [CrossRef]
Hawkes, J., & Flink, J. M. (1978). Osmotic Concentration of Fruit Slices Priorto Freeze Dehydration. Journal of Food Pro-cessing and Preservation, 2, 265-284 [CrossRef] James, C. (1995). Determination of fat by the Soxhlet methods.
Ana-lytical chemistry of foods, 91-92.
Naz, S., Siddiqi, R., Sheikh, H., & Sayeed, S. A. (2005). Deterioration of olive, corn and soybean oils due to air, light, heat and deep-frying. Food Research International, 38(2), 127-134 [CrossRef]
Rastogi, N., Raghavarao, K., Niranjan, K., & Knorr, D. (2002). Re-cent developments in osmotic dehydration: methods to enhance mass transfer. Trends in Food Science & Tech-nology, 13(2), 48-59 [CrossRef]
Robertson, A. R. (1977). The CIE 1976 Color Difference Formulae. Color Research & Application, 2(1), 7-11 [CrossRef] Özçelik, S.G. (2015). Optimization of frying process of zucchini
slices by frying combined with predehydration in terms of oil absorption and product texture, Suleyman Demirel University Engineering Faculty, Isparta. 125.
Torreggiani, D. (1993). Osmotic dehydration in fruit and vegetable processing. Food Research International, 26(1), 59-68 [CrossRef]