Dergi web sayfası:
www.agri.ankara.edu.tr/dergi www.agri.ankara.edu.tr/journalJournal homepage:
TARIM BİLİMLERİ DERGİSİ
—
JOURNAL OF AGRICUL
TURAL SCIENCES
22 (2016) 307-316
Effects of Moisture Content on Some Physical Properties of the Yellow Lentil
Eşref IŞIKa, Nazmi İZLİaaUludag University, Faculty of Agriculture, Department of Biosystems Engineering, Görükle Campus, Nilüfer, Bursa, TURKEY ARTICLE INFO
Research Article
Corresponding Author: Eşref IŞIK, E-mail: [email protected], Tel: +90 (224) 294 16 03
Received: 17 December 2014, Received in Revised Form: 11 February 2015, Accepted: 20 February 2015
ABSTRACT
This research focuses on yellow lentil seeds and determining the effects of moisture content on some of their physical properties. The various types of machinery used in gathering crops, processing, shipping, categorizing, sorting, and packaging are designed according to the physical properties of the specific crops. When the moisture content increased from 15.6% to 22.5% d.b., the bulk density decreased from 750.27 to 625 kg m-3, the true density increased from 1200.5
to 1334 kg m-3, and the rupture force decreased from 2.5 to 16.2 N. Under the same conditions, the measurements
of the average thickness, diameter, arithmetic mean diameter, geometric mean diameter, projected area, surface area, sphericity, thousand seed mass, porosity, and terminal velocity values varied as follows: from 1.22 to 1.42 mm, 4.29 to 4.6 mm, 3.26 to 3.53 mm, 2.82 to 3.1 mm, 15.33 to 17.66 mm2, 24.93 to 30.15 mm2, 0.66 to 0.67, 15.33 to 17.66 mm2,
15.1 to 18.01 g, 37.49 to 53.18% and 1.5 to 2.09 m s-1, respectively. For all moisture content levels, rubber had the
greatest static coefficient of friction, followed by aluminum, galvanized iron, stainless steel, plywood and glass. Keywords: Yellow lentils; Physical properties; Moisture
Nem İçeriğinin Sarı Mercimeğin Bazı Fiziksel Özellikleri Üzerine Etkisi
ESER BİLGİSİAraştırma Makalesi
Sorumlu Yazar: Eşref IŞIK, E-posta: [email protected], Tel: +90 (224) 294 16 03 Geliş Tarihi: 17 Aralık 2014, Düzeltmelerin Gelişi: 11 Şubat 2015, Kabul: 20 Şubat 2015
ÖZET
Bu çalışma değişen nem oranlarına bağlı olarak sarı mercimek tohumlarının bazı fiziksel özelliklerini belirlemeye odaklanmıştır. Hasat, işleme, nakliye, katagorize etme, sınıflandırma ve paketlemede kullanılan makinalar bu fiziksel özelliklerine göre tasarlanmaktadır. Nem oranı % 15.6’dan % 22.5 d.b (kuru baz)’a arttığında, hacim ağırlığı 750.27’ dan 625 kg m-3’e, özgül ağırlık 1200.5’dan 1334 kg m-3’e ve kırılma kuvveti 22.5’dan 16.2 N’a azalmıştır. Aynı koşullar altında
ortalama kalınlık, çap, aritmetik ortalama çap, geometrik ortalama çap, küresellik, yüzey alanı, projeksiyon alanı, bindane ağırlığı, gözeneklilik ve kritik hız değerleri sırasıyla 4.29-4.6 mm, 1.22-1.42 mm, 3.26-3.53 mm, 2.82-3.1 mm, 0.66-0.67, 24.93-30.15 mm2, 15.33-17.66 mm2, 15.1-18.01 g, % 37.49-53.18 ve 1.5-2.09 m s-1 aralığında değişmiştir. Bütün nem
değerlerinde en yüksek sürtünme katsayısı kauçuk yüzey kullanıldığında elde edilmiştir, bunu alüminyum, galvanizli sac, çelik, kontrplak ve cam yüzeyleri takip etmiştir.
Anahtar Kelimeler: Sarı mercimek; Fiziksel özellikler; Nem
1. Introduction
Lentil (Lens culinaris L.) belonging to the Fabaceae family is one of the most popular cultivated plants for the dry foods industry and is an important ingredient for the canned food industry. Lentils are an excellent source of vitamins, energy, proteins, mineral elements, and carbohydrates (Gharibzahedi et al 2014). The widespread use of lentils in traditional foods around the world dates back to ancient times (Kouvoutsakis et al 2014). The most common varieties of lentils are red, yellow, black, or green.
Lentils are cultivated in many different countries, and in 2013 the annual production of lentils was calculated to be approximately 4.9 Mt. Canada is the most important lentil growing country (1880500 t); the other top producers are India (1134000 t), Turkey (417000 t) Australia (324000 t) and the USA (227658 t) (FAO 2013).
The known physical properties of crops are the main determining factor in the design of appropriate machinery for grading and sizing, separating, cleaning, shipping, handling, storing, sizing, processing, and packaging (Altuntas & Demirtola 2007). Additionally, the known physical properties aid in identifying the efficiency of machines and systems operations, determine the quality of the finished product, and correctly identify the different varieties. Determining these factors can lead to increased work efficiency and reduced product loss. Consequently, it is important to correctly identify and measure these properties and give them serious consideration (Fathollahzadeh et al 2008).
A number of studies have found that moisture affects the physical properties of a wide variety of specific agricultural products such as lentil seeds (Carman, 1996), safflower seeds (Baümler et al 2006), cowpea (Vigna sinensis L.) seed (Yalcin 2007), teff seeds (Zewdu & Solomon 2007), jatropha seeds (Garnayak et al 2008), bay laurel seeds (Yurtlu et al 2010), rice (Kibar et al 2010), red lentil seeds (Gharibzahedi et al 2011), christmas lima beans (Aghkhani et al 2012), coriander seeds (Balasubramanian et al 2012), hemp seeds (Taheri-Garavand et al 2012), maize seeds (Barnwal et al
2012), barley (Sologubik et al 2013) and Moringa
oleifera seeds (Aviara et al 2013). No previous
literature exists on how the physical properties of yellow lentil seeds are affected by moisture.
The purpose of this research was to study the various physical properties of yellow lentil seeds that are affected by moisture: thickness, diameter, arithmetic mean diameter, geometric mean diameter, projected area, surface area, sphericity, thousand seed mass, porosity, terminal velocity, rupture force and the static coefficient of friction.
2. Material and Methods
For the research purposes of this paper, yellow lentils from a market in Bursa, Turkey, were used. To cleanse the lentil seeds from foreign matter and ensure the removal of damaged or unripe seeds, the lentils were cleaned by hand. Using a digital moisture meter (Pfeuffer HE 50, Germany), the initial moisture content of the lentil was measured to be 15.6% (dry basis (d.b.)).
The preparation of the samples of yellow lentils with different chosen moisture contents was accomplished by adding the necessary amount of distilled water as calculated according to Equation 1 (Sacilik et al 2003). ) 100 ( ) ( f i f i M M M W Q − − = (1)
Where; Q, mass of water added (kg); Wi, initial mass of the sample (kg); Mi, initial moisture content of the sample (% d.b.), and Mf, final moisture content of the sample (% d.b.).
Next, the prepared samples were placed in individual polyethylene bags which were then tightly sealed and kept refrigerated for 7 days at 5 0C to ensure
that the moisture would spread evenly throughout the lentils in the bag. Before a test was conducted, the lentils to be used in the test were removed from refrigeration and placed at room temperature for approximately 2 h. For all tests of physical properties, measurements were taken for moisture levels of 15.6, 17.4, 18.9, 20.6 and 22.5% (d.b.).
The average yellow lentil size was calculated by choosing 100 seeds at random and measuring at each moisture level the diameter (D) and thickness (T), which are recognized as the principal dimensions. These measurements, taken with an accuracy of 0.01 mm, were obtained using digital slide calipers (Mitutoyo, Japan). Equation 2 and 3 were used to calculate the arithmetic mean diameter (Da) and the geometric mean diameter (Dg) (Mohsenin 1986).
(
2D T)
/3 Da = + (2)( )
2 1/3 T D Dg = (3)The sphericity (f) and the surface area (S) of yellow lentil seeds were determined according to the Equation 4 and 5 (Mohsenin 1986).
L / Dg = φ (4) 2 g D S =
π
(5)A digital camera (SONY; 10.1 Mpixels, China) was used to photograph the seeds in order to calculate the projected area Ap. The reference area was compared to the sample area using the Global Lab Image 2-Streamline (trial version) program (Işık 2007).
A digital electronic balance (Chyo, MP-300, Japan), which is accurate to 0.001 g, was used to measure the thousand seed mass (M1000).
Seed was poured at a constant rate from a height of 150 mm into a circular container (500 mL volume) until the container was full to measure the bulk density (rb), which was determined from the container’s volume and the seeds’ mass (Sacilik et al 2003).
The toluene displacement method was used to find the true density (rt). Yellow lentil seeds of a measured weight were immersed in toluene, and the volume of toluene displaced was measured (Paksoy & Aydın 2004).
The porosity (ε) of the yellow lentil seeds was found at the specific moisture percentages by calculations using the bulk and true densities
according to the equation given by Mohsenin (1986) as shown in Equation 6. 100 ) ( − × = t b t ρ ρ ρ ε (6)
A digital anemometer (Thies clima, Germany) with a least count of 0.1 m s-1 was used to measure
the terminal velocity (Vt) that was required to keep the seed suspended (Shirkole et al 2011).
A biological material test device (Sundoo, SH-500, Digital Force Gauge, China) with a load cell of 500 N was used to measure the yellow lentils’ rupture force (Rf).
Lentils were tested with six types of structural materials rubber (mru), aluminum (mal), galvanized iron (mgi), stainless steel (mss), plywood (mpw), and glass (mgl) to measure the static coefficient of friction. For this test, a polyvinylchloride (PVC) cylindrical pipe 50 mm in diameter and 100 mm in height resting on an adjustable tilting plate facing the test surface was used. The seed sample was poured into the cylinder, which was held just above the surface. A screw device was used to slowly raise the structural surface with the cylinder on top until the cylinder just began to slide down. A graduated scale was used to measure the angle of tilt (Karababa & Coşkuner 2013). Equation 7 was used to obtain the coefficient of friction.
α
µ=tan (7)
Where; m is the coefficient of friction and α is the angle of tilt (°).
The findings of these tests and calculations were processed with the MINITAB (Version 14, University of Texas and Austin, Texas, USA) and MS-Excel software programs. The results were analyzed with a one-way analysis of variance. Mean differences were tested for significance with a least significant difference (LSD). Variations were generally considered to be significant at P<0.05. Any other significance levels used are specified.
3. Results and Discussion
3.1. Seed dimensions
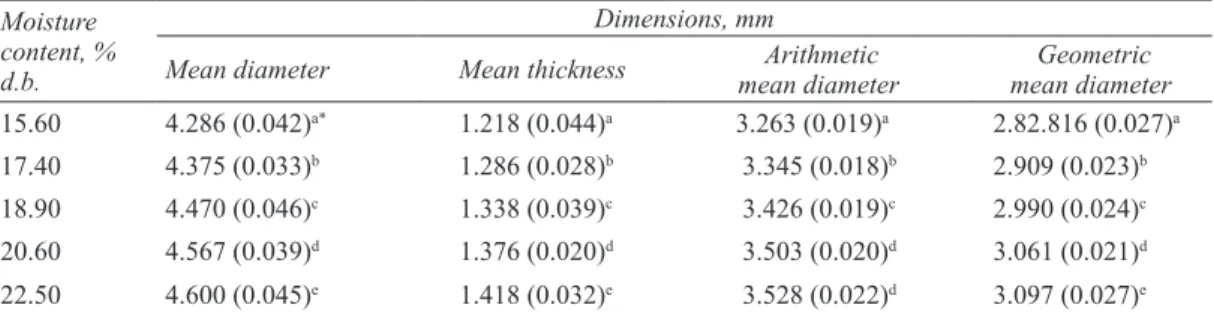
Table 1 contains the values of each of the lentil samples at different moisture percentages for their diameter, thickness, arithmetic mean diameter and geometric mean diameter. When the moisture content was increased from 15.6 to 22.5% d.b., the diameter, thickness, arithmetic mean diameter and the geometric mean diameter of seeds all significantly increased (P<0.05): from 4.29 to 4.60 mm, 1.22 to 1.42 mm, 3.26 to 3.53 mm and 2.82 to 3.1 mm, respectively. Gharibzahedi et al (2011) showed that when the moisture content for red lentil seeds increased from 9.5 to 21.1% (w.b.), the average thickness, arithmetic mean diameter and geometric mean diameter increased linearly from 2.32 to 2.38 mm, 3.44 to 3.5 mm and 3.33 to 3.39 mm, respectively. Other linear increases related to increasing moisture content that have been reported in the literature include the diameter of green lentils (Işık 2007), the thickness of locust bean seeds (Sobukola & Onwuka 2011), the arithmetic mean diameter of Christmas lima beans (Aghkhani et al 2012) and the geometric mean diameter of coriander seeds (Balasubramanian et al 2012).
3.2. Sphericity
Figure 1 details how sphericity is affected by moisture content. When the moisture content was
increased from 15.6 to 22.5% d.b., there was a linear increase in sphericity from 0.66 to 0.67. When Taheri-Garavand et al (2012) observed hemp seeds and Balasubramanian et al (2012) experimented with coriander seeds, the sphericity of these seeds linearly increased when the moisture content was increased. Equation 8 shows the relationship between moisture content and sphericity.
) 9139 . 0 ( 0038 . 0 6555 . 0 + 2 = = Mc R φ6555 0.0038 ( 0.9139) . 0 + 2 = = Mc R φ (8)
When compared to the sphericity results of bay laurel seeds, the sphericity values of yellow lentils were lower (Yurtlu et al 2010); however, another study by Garnayak et al (2008) found similar values for the sphericity of jatropha seeds.
Figure 1- Effect of moisture content on sphericity of yellow lentil seeds
Şekil 1- Nem içeriğininin sarı mercimek tohumlarının küreselliği üzerine etkisi
Table 1- Dimensions of the yellow lentil seeds at the different moisture contents
Çizelge 1- Farklı nem içeriğinde sarı mercimek tohumlarının boyutları Moisture
content, % d.b.
Dimensions, mm
Mean diameter Mean thickness mean diameter Arithmetic mean diameter Geometric
15.60 4.286 (0.042)a* 1.218 (0.044)a 3.263 (0.019)a 2.82.816 (0.027)a
17.40 4.375 (0.033)b 1.286 (0.028)b 3.345 (0.018)b 2.909 (0.023)b
18.90 4.470 (0.046)c 1.338 (0.039)c 3.426 (0.019)c 2.990 (0.024)c
20.60 4.567 (0.039)d 1.376 (0.020)d 3.503 (0.020)d 3.061 (0.021)d
22.50 4.600 (0.045)e 1.418 (0.032)e 3.528 (0.022)d 3.097 (0.027)e
*, values in the parentheses are standard deviation. a-e, means with different superscript alphabets in the same column differ significantly
3.3. Surface area of seeds
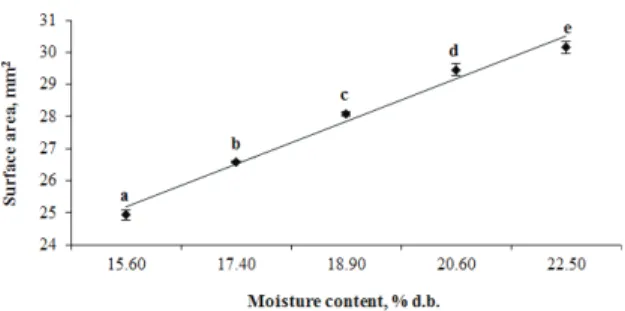
Figure 2 details the results of the experiments determining how different moisture levels affect the surface area of yellow lentils. In the experiment, when the moisture content was increased from 15.6 to 22.5% d.b., a 17.31% linear increase was observed (from 24.93 to 30.15 mm2). This moisture
content effect on the yellow lentils surface area was statistically significant (P<0.05). Surface area relationship with moisture content of yellow lentil seed was determined to be linear and is shown in Equation 9. 9821 . 0 3339 . 1 833 . 3 2 + 2 = = M R A.833s 1.3339 c 0.9821 3 2 + 2 = = M R As c (9)
Sacilik et al (2003) and Sologubik et al (2013) reported a similar linear increase with regards to surface area when experimenting with hemp seeds and barley, respectively.
Figure 2- Effect of moisture content on surface area of yellow lentil seeds
Şekil 2- Nem içeriğinin sarı mercimek tohumlarının yüzey alanı üzerine etkisi
3.4. Projected area of seed
A graphical representation of the projected area calculated for yellow lentil seeds at the various experimental moisture contents is presented in Figure 3. Increasing moisture content resulted in a linear increase of the projected area of the seed from 15.33 to 17.66 mm2. Equation 10 represents how the
moisture content and the value of the projected area are related. ) 9078 . 0 ( 5887 . 0 403 . 4 1 + 2 = = M R Ap 0.5887 c ( 0.9078) 403 . 4 1 + 2 = = M R Ap c (10)
Yalcin & Ozarslan (2004) found that vetch seeds also behaved similarly when moisture content was increased, as did Dursun & Dursun (2005) when caper seeds were studied and Işık (2007) when green lentils were observed.
Figure 3- Effect of moisture content on projected area of yellow lentil seeds
Şekil 3- Nem içeriğininin sarı mercimek tohumlarının projeksiyon alanı üzerine etkisi
3.5. Thousand seed mass
Figure 4 shows the results for the effects of moisture content on the thousand seed mass. An increase in moisture content from 15.6 to 22.5% d.b. was accompanied by a linear increase in the thousand seed mass M1000 from 15.1 to 18.01 g, which can be calculated as an increase of 19.27%. Szot et al (2003) noted that Polish and Canadian varieties of lentil seeds also increased in thousand seed mass when moisture was increased, as did Solomon & Zewdu (2009) in their study of Niger seeds and Bagherpour et al (2010) in a study of lentils. In other studies, the values for the thousand seed mass Dursun & Dursun (2005) observed for caper seeds were less than the values found for the yellow lentil samples; the values observed for green lentils were higher (Işık 2007). Equation 11 shows the relationship between moisture content and the thousand seed mass.
) 9827 . 0 ( 712 . 0 2= + =14.526 M R M1000 +0.712 c ( 2=0.9827) =14.526 M R M1000 c (11)
Figure 4- Effect of moisture content on the thousand seeds mass of yellow lentil seeds
Şekil 4- Nem içeriğinin sarı mercimek tohumlarının bin dane ağırlığı üzerine etkisi
3.6. Bulk density
The results found for the bulk density of yellow lentils at various moisture levels are given in Figure 5. Increasing the moisture content from 15.6 to 22.5% d.b. resulted in a decreased bulk density from 750.27 to 625 kg m-³; this effect was found to be statistically
significant (P<0.05). Increasing the moisture content resulted in a 16.7% percent corresponding decrease in bulk density for the yellow lentil sample. Equation 12 defines the relationship between moisture content and bulk density.
998 . 0 691 . 1 3 3 9 . 783 − 2 = = Mc R b ρ .93 31.691 0.998 783 − 2 = = Mc R b ρ (12)
Lentil seeds were also found to have a negative linear relationship between their bulk density and moisture content (Carman 1996); a similar negative relationship was found for maize seeds (Barnwal et al 2012).
Figure 5- Effect of moisture content on bulk density of yellow lentil seeds
Şekil 5- Nem içeriğininin sarı mercimek tohumlarının hacim ağırlığı üzerine etkisi
3.7. True density
Figure 6 shows how various moisture levels affect the true density of yellow lentils, which increased linearly from 1200.5 to 1334 kg m-3 as a result of
increasing the moisture content from 15.6 to 22.5% d.b. Equation 13 represents the relationship between the moisture content and the value of true density.
9993 . 0 5 4 . 3 3 5 . 1168 + 2 = = Mc R t ρ=1168.5+33.45M R2 =0.9993 c t ρ (13)
Singh et al (2012) also recorded an increase in true density accompanying an increase in moisture content for flaxseeds, as did Paksoy & Aydın (2004) in a study on edible squash seeds and Kibar et al (2010) in an examination of rice seeds.
Figure 6- Effect of moisture content on true density of yellow lentil seeds
Şekil 6- Nem içeriğininin sarı mercimek tohumlarının özgül ağırlığı üzerine etkisi
3.8. Porosity
Figure 7 shows how porosity was affected by moisture content. The increase in moisture content from 15.6 to 22.5% d.b. caused the porosity to increase from 37.49 to 53.18%. Porosity and moisture content relationship presented in Equation 14.
9981 . 0 9291 . 3 683 . 3 3 + 2 = = M R P=f33.683+3.9291M c R2 =0.9981 Pf c (14)
Altuntas & Yildiz (2007) reported porosity values for fava beans that are higher than those found for yellow lentils, while Vilche et al (2003) found lower porosity values for quinoa seeds when compared with yellow lentil seeds; Amin et al (2004) also found lower porosity values for lentil seeds.
Figure 7- Effect of moisture content on porosity of yellow lentil seeds
Şekil 7- Nem içeriğininin sarı mercimek tohumlarının boşluk oranı üzerine etkisi
3.9. Terminal velocity
Figure 8 gives the effects of moisture content on the values for terminal velocity. Increasing moisture content caused the terminal velocity values to increase from 1.5 to 2.09 m s-1. The reason for this
increase in terminal velocity can be explained by the increase in the mass of each seed per unit frontal area that faces the air stream. The linear relationship between moisture content and terminal velocity can be defined by Equation 15. ) 9975 . 0 ( 144 . 0 366 . 1 + 2 = = M R V.t366 0.144 c ( 0.9975) 1 + 2 = = M R Vt c (15)
When comparing the terminal velocity of yellow lentils with the terminal velocities of vetch seeds, the latter were found to have a higher terminal velocity when moisture levels were the same (Yalcin & Ozarslan 2004). Additionally, safflower seeds were found to have a higher terminal velocity (Kara et al 2012).
Figure 8- Effect of moisture content on terminal velocity of yellow lentil seeds
Şekil 8- Nem içeriğininin sarı mercimek tohumlarının kritik hızları üzerine etkisi
3.10. Rupture force
Figure 9 shows the effects of various moisture content levels on the rupture force of yellow lentils. An increase from 15.6 to 22.5% d.b. indicated a decrease in the rupture force of yellow lentils from 22.5 to 16.2 N. Bagherpour et al (2010) also found a negative linear relationship of rupture force with moisture content in a study of lentil seeds, while Balasubramanian et al (2012) found a negative relationship for coriander seeds. The relationship between moisture content and rupture force can be expressed with Equation 16.
9753 . 0 6 5 . 1 4 7 . 3 2 − 2 = = M R Rf=23.74−1.56M c R2 =0.9753 Rf c (16)
Baümler et al (2006) found a higher rupture force for the safflower seed when compared to the rupture force of yellow lentils at the same moisture level, as did Barnwal et al (2012) for maize seeds and Taheri-Garavand et al (2012) for hemp seeds.
Figure 9- Effect of moisture content on rupture force of yellow lentil seeds
Şekil 9- Nem içeriğininin sarı mercimek tohumlarının kırılma kuvveti üzerine etkisi
3.11. Static coefficient of friction
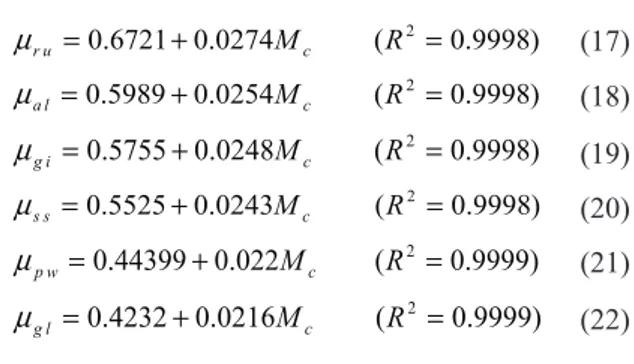
The coefficient results of testing how different moisture content levels ranging from 15.6 to 22.5% d.b. effected the static friction of yellow lentils on six surfaces including rubber, aluminum, galvanized iron, stainless steel, plywood, and glass against moisture are given in Table 2. For each material tested, the coefficient of static friction was found to linearly increase as the moisture content
increased. It is possible that this increase could be attributed to the fact that when moisture content is increased, there is increased adhesion between the surface of the material and the seed. The tests with the different moisture content levels showed that the coefficient of static friction on the rubber surface varied from 0.7002 to 0.8098, on the aluminum from 0.6249 to 0.7265, on the galvanized iron from 0.6009 to 0.7002, on the stainless steel from 0.5774 to 0.6745, on the plywood from 0.4663 to 0.5543 and on the glass from 0.4452 to 0.5317. These variations correspond to the following percentages of increase: 13.53%, 13.98%, 14.18%, 14.40%, 15.88% and 16.27% for the rubber, aluminum, galvanized iron, stainless steel, plywood and glass surfaces, respectively. The highest coefficient of static friction value (0.8098) was found for the rubber surface at 22.5% d.b. moisture content. The glass surface had the lowest value (0.4452) at 15.6% d.b. moisture content. Carman (1996) reported that rubber has the highest coefficient of static friction when tested with lentil seeds, and Aghkhani et al (2012) came to the same conclusion for lima beans. Araghi et al (2010) & Davies (2010) found that rough varieties of rice and arigo seeds, respectively, had the lowest friction values when tested on a glass surface. The effects of moisture content levels on the six different tested surfaces are shown in Equations 17-22.
) 9998 . 0 ( 0274 . 0 6721 . 0 + 2 = = Mc R u r µ ) 9998 . 0 ( 0254 . 0 5989 . 0 + 2 = = Mc R l a µ ) 9998 . 0 ( 0248 . 0 5755 . 0 + 2 = = Mc R i g µ ) 9998 . 0 ( 0243 . 0 5525 . 0 + 2 = = Mc R s s µ ) 9999 . 0 ( 022 . 0 44399 . 0 + 2 = = Mc R w p µ ) 9999 . 0 ( 0216 . 0 4232 . 0 + 2 = = Mc R l g µ ) 9998 . 0 ( 0274 . 0 6721 . 0 + 2 = = Mc R u r µ ) 9998 . 0 ( 0254 . 0 5989 . 0 + 2 = = Mc R l a µ ) 9998 . 0 ( 0248 . 0 5755 . 0 + 2 = = Mc R i g µ ) 9998 . 0 ( 0243 . 0 5525 . 0 + 2 = = Mc R s s µ ) 9999 . 0 ( 022 . 0 44399 . 0 + 2 = = Mc R w p µ ) 9999 . 0 ( 0216 . 0 4232 . 0 + 2 = = Mc R l g µ (17) (18) (19) (20) (21) (22)
4. Conclusions
This study examined the effect of different levels of moisture content on several different physical properties of yellow lentil seeds. When moisture levels were increased from 15.6 to 22.5% d.b., decreases were observed in the bulk density (from 750.27 to 625 kg m-3) and the rupture force (from
22.5 to 16.2 N). Additionally, with the same increase in moisture content levels, the average diameter increased from 4.29 to 4.6 mm, the thickness from 1.22 to 1.42 mm, the arithmetic mean diameter from 3.26 to 3.53 mm, the geometric mean diameter from 2.82 to 3.1 mm, the sphericity from 0.66 to 0.67, the surface area from 24.93 to 30.15 mm2, the projected
area of seed from 15.33 to 17.66 mm2, the thousand
seed mass from 15.1 to 18.01 g, the porosity from 37.49 to 53.18%, the terminal velocity from 1.5 to 2.09 m s-1 and the true density from 1200.5 to Table 2- Effect of moisture content on static coefficient of friction of yellow lentil seeds against various surface
Çizelge 2- Farklı yüzeylerde, nem içeriğinin sarı mercimek tohumlarının sürtünme katsayısı üzerine etkisi Moisture
content, % d.b.
Surface
Rubber Stainless steel Aluminium Glass Plywood Galvanised iron
15.60 0.700 (0.012)a* 0.577 (0.012)a 0.625 (0.009)a 0.445 (0.015)a 0.466 (0.013)a 0.601 (0.017)a
17.40 0.727 (0.008)ab 0.601 (0.015)ab 0.649 (0.011)ab 0.466 (0.008)ab 0.488 (0.016)ab 0.625 (0.019)ab
18.90 0.754 (0.006)bc 0.625 (0.006)bc 0.675 (0.012)bc 0.488 (0.014)bc 0.510 (0.017)abc 0.649 (0.018)bc
20.60 0.781 (0.009)cd 0.649 (0.012)cd 0.700 (0.008)cd 0.510 (0.013)cd 0.532 (0.025)bc 0.675 (0.015)cd
22.50 0.810 (0.005)d 0.675 (0.004)d 0.727 (0.010)d 0.532 (0.007)d 0.554 (0.014)c 0.700 (0.019)d
*, values in the parentheses are standard deviation; a-d, means with different superscript alphabets in the same column differ significantly
1334 kg m-3. A linear increase was observed in the
coefficients of static friction of yellow lentil seeds at the same levels of moisture content on surfaces of the following six structural materials: rubber (0.7002-0.8098), aluminum (0.6249-0.7265), galvanized iron (0.6009-0.7002), stainless steel (0.5774-0.6745), plywood (0.4663-0.5543) and glass (0.4452-0.5317).
Acknowledgements
This publication has been edited by American Journal Experts (AJE).
Abbreviations and Symbols
Ap Projected area mm²
As Surface area mm²
C1, C2 Regression coefficients
Da Arithmetic mean diameter
of seed mm
Dg Geometric mean diameter
of seed mm
D Diameter of seed mm
Mc Moisture content % d.b.
M1000 Thousand seed mass g
Mf Final moisture content of
sample % d.b.
Mi Initial moisture content of
sample % d.b.
Pf Porosity %
Q Mass of water to added g
Rs Rupture force N
R2 Coefficient of
determination dimensionless
T Thickness of seed mm
Vt Terminal velocity ms-1
Wi İnitial mass of sample g
rb Bulk density kgm-³
rt True density kgm-³
f Sphericity of seed dimensionless
m d.b. Coefficient of friction Dry basis dimensionless
-References
Aghkhani M H, Ashtiani S H M, Motie J B & Abbaspour-Fard M H (2012). Physical properties of christmas
lima bean at different moisture content. International
Agrophysics 26(4): 341-346
Altuntas E & Demirtola H (2007). Effect of moisture content on physical properties of some grain legume seeds. New Zealand Journal of Crop and Horticultural
Science 35(4): 423-433
Altuntas E & Yildiz M (2007). Effect of moisture content on some physical and mechanical properties of faba bean (Vicia faba L.) grains. Journal of Food
Engineering 78(1): 174-183
Amin M N, Hossain M A & Roy K C (2004). Effects of moisture content on some physical properties of lentil seeds. Journal of Food Engineering 65(1): 83-87 Araghi H A, Sadeghi M & Hemmat A (2010). Physical
properties of two rough rice varieties affected by moisture content. International Agrophysics 24(2): 205-207
Aviara A N, Power P P & Abbas T (2013). Moisture-dependent physical properties of Moringa oleifera seed relevant in bulk handling and mechanical processing. Industrial Crops and Products 42: 96-104 Bagherpour H, Minaei S & Khoshtaghaza M H (2010).
Selected physico-mechanical properties of lentil seed.
International Agrophysics 24(1): 81-84
Balasubramanian S, Singh K K & Kumar R (2012). Physical properties of coriander seeds at different moisture content. International Agrophysics 26(4): 419-422
Barnwal P, Kadam D M & Singh K K (2012). Influence of moisture content on physical properties of maize.
International Agrophysics 26(3): 331-334
Baümler E, Cuniberti A, Nolasco S M & Riccobene I C (2006). Moisture dependent physical and compression properties of safflower seed. Journal of
Food Engineering 72(2): 134-140
Carman K (1996). Some physical properties of lentil seeds. Journal of Agricultural Engineering Research 63(2): 87-92
Davies R M (2010). Some physical properties of arigo seeds. International Agrophysics 24(1): 89-92 Dursun E & Dursun I (2005). Some physical properties
of caper seed. Biosystems Engineering 92(2): 237-245 FAO (2013). FAOSTAT Agricultural Database Web Page
Retrieved in December, 23, 2013 from. http://faostat. fao.org/site/567/default.aspx#ancor
Fathollahzadeh H, Mobli H, Jafari A, Rafiee S & Mohammadi A (2008). Some physical properties of
tabarzeh apricot kernel. Pakistan Journal of Nutrition 7(5): 645-651
Garnayak D K, Pradhan R C, Naik S N & Bhatnagar N (2008). Moisture-dependent physical properties of jatropha seed (Jatropha curcas L.). Industrial Crops
and Products 27(1): 123-129
Gharibzahedi S M T, Ghasemlou M, Razavi S H, Jafarii S M & Faraji K (2011). Moisture-dependent physical properties and biochemical composition of red lentil seeds. International Agrophysics 25(4): 343-347 Gharibzahedi S M T, Emam-Djomeh Z, Razavi S H &
Jafari S M (2014). Mechanical behavior of lentil seeds in relation to their physicochemical and microstructural characteristics. International Journal
of Food Properties 17(3): 545-558
Işık E (2007). Moisture Dependent physical and mechanical properties of green laird lentil (Lens
culinaris) grains. Pakistan Journal of Biological Sciences 10(3): 474-480
Kara M, Bastaban S, Öztürk I, Kalkan F & Yildiz C (2012). Moisture-dependent frictional and aerodynamic properties of safflower seeds. International
Agrophysics 26(1): 203-205
Karababa E & Coşkuner E (2013). Physical properties of carob bean (Ceratonia siliqua L.): An industrial gum yielding crop. Industrial Crops and Products 42: 440-446
Kibar H, Öztürk T & Esen B (2010). The effect of moisture content on physical and mechanical properties of rice (Oryza sativa L.) Spanish Journal of Agricultural
Research 8(3): 741-749
Kouvoutsakis G, Mitsi C, Tarantilis P A, Polissiou M G & Pappas C S (2014). Geographical differentiation of dried lentil seed (Lens culinaris) samples using diffuse reflectance fourier transform infrared spectroscopy (DRIFTS) and discriminant analysis. Food Chemistry 145: 1011-1014
Mohsenin N N (1986). Physical properties of plant and animals materials (2nd ed.). Gordon and Breach Science Publishers New York. 891 pp
Paksoy M & Aydin C (2004). Some physical properties of edible squash (Cucurbita pepo L.) seeds. Journal of
Food Engineering 65(2): 225-231
Sacilik K, Ozturk R & Keskin R (2003). Some physical properties of hemp seed. Biosystems Engineering 86(2): 213-215
Shirkole S S, Kenghe R N & Nimkar P M (2011). Moisture dependent physical properties of soybean.
International Journal of Engineering Science and Technology 3(5): 3807-3815
Singh K K, Mridula D, Barnwal P & Rehal J (2012). Physical and chemical properties of flaxseed.
International Agrophysics 26(4): 423-426
Sobukola O P & Onwuka V I (2011). Effect of moisture content on some physical properties of locust bean seed (Parkia fillicoidea L.). Journal of Food Process
Engineering 34(6): 1946-1964
Sologubik C A, Campanone L A, Pagano A M & Gely M C (2013). Effect of moisture content on some physical properties of barley. Industrial Crops and Products 43: 762-767
Solomon W K & Zewdu A D (2009). Moisture-dependent physical properties of Niger (Guizotia abyssinica Cass.) seed. Industrial Crops and Products 29(1): 165-170
Szot B, Horabik J & Rusinek R (2003). Physical properties characteristic of Polish and Canadian lentil seeds.
International Agrophysics 17: 123-129
Taheri-Garavand A, Nassiri A & Gharibzahedi S M T (2012). Physical and mechanical properties of hemp seed. International Agrophysics 26(2): 211-215 Vilche C, Gely M & Santalla E (2003). Physical properties
of quinoa seeds. Biosystems Engineering 86(1): 59-65 Yalcin I & Ozarslan C (2004). Physical properties of vetch
seed. Biosystems Engineering 88(4): 507-512 Yalcin I (2007). Physical properties of cowpea (Vigna
sinensis L.) seed. Journal of Food Engineering 79(1):
57-62
Yurtlu Y B, Yeşiloğlu E & Arslanoğlu F (2010). Physical properties of bay laurel seeds. International
Agrophysics 24(3): 325-328
Zewdu A D & Solomon W K (2007). Moisture-dependent physical properties of tef seed. Biosystems