Intraneural Vascular Resistive Index of the
Median Nerve as a Predictor of Severity of Carpal
Tunnel Syndrome
Burçak Çakır Peköz
1, Mehmet Taylan Peköz
2, Pınar Doruk Analan
31Department of Radiology, University of Health Sciences-Adana Health Practices and Research Center,
Adana, Turkey
2Department of Neurology, Çukurova University School of Medicine, Adana, Turkey
3Department of Physical Medicine and Rehabilitation, Başkent University School of Medicine, İstanbul,
Turkey
ABSTRACT
Objective: There is a limited data about resistive index (RI) of median nerve (MN) in patients with carpal tunnel syndrome (CTS). In our study, we aimed to evaluate the relationship between CTS severity and MN-RI.
Methods: A total of 115 CTS patient wrists, and 49 wrists of control subjects without CTS, were examined on ultrasonogra-phy (US) and color Doppler US (CDUS), pulsed Doppler ultrasonograultrasonogra-phy (PDUS), and by electroultrasonogra-physiological evaluations. MN peak-systolic velocity (MN-PSV), MN end-diastolic velocity, MN-RI and MN pulsatility index (MN-PI) were measured by PDUS. Patients were divided into 3 groups according to electrophysiological examinations severity findings of CTS as mild (Group-I), moderate (Group-II), and severe (Group-III).
Results: MN-PSV, MN-PI and MN-RI increased significantly from Group-I to Group-III and these parameters were significantly higher in Group-III than other two groups. RI independently determines the patients to have severe CTS. Increased MN-RI (per-0.1) was found to increase the risk of having severe CTS by 3.45-times. In the ROC analysis, the area under the curve was 0.846 for MN-RI. When the MN-RI cut-off value was taken as 0.80, it determines patients to be severe CTS with 85.2% sensitivity and 78.2% specificity.
Conclusion: The increase in MN-RI in CTS patients is independently associated with disease severity and may be used in the clinical follow-up of these patients.
Keywords: Carpal tunnel syndrome, median nerve, pulsed doppler ultrasounography, resistive index
How to cite: Peköz BC, Peköz MT, Analan PD. Intraneural vascular resistive index of the median nerve as a predictor of severity of carpal tunnel syndrome. Eur J Ther 2020; 26(3): 218-24.
ORCID iDs of the authors: B.Ç.P. 0000-0002-7286-5535; M.T.P. 0000-0001-9126-9192; P.D.A. 0000-0002-3528-3712.
Corresponding Author: Burçak Çakır Peköz E-mail: [email protected] Received: 19.04.2020 • Accepted: 24.06.2020
Original Research
218
INTRODUCTION
Carpal tunnel syndrome (CTS) is the most predominant entrap-ment neuropathy of the median nerve (MN) constricted in the wrist. It is more common in middle-aged women (1). CTS affects 1% of the general population, and the prevalence is 5.8% for fe-males and 0.6% for fe-males (2). The MN is located tightly packed in the carpal tunnel (CT) with 9 tendons and synovial membranes. CTS may occur idiopathically, as well as in rheumatoid arthritis, hyperthyroidism, acromegaly, and diabetes mellitus (3). Patho-logic changes occur in CTS due to MN pressure (4). Anatomic variations such as bifid median nerve anomaly and persistent median artery synovitis and cyst, ganglion, aberrant muscle, a tumor that may cause nerve compression in the CT can be de-tected by imaging methods (5). Ultrasonography (US) is the most commonly used imaging technique for this purpose. The
fact that patients are not exposed to X-rays or contrasts, being a cheap, well-tolerated, noninvasive, ready-for-intervention, easily accessible, and easy-to-implement process, are the significant advantages of US.
In addition to anatomical parameters, MN epineural and in-tra-neural blood flow can be revealed by Doppler US (6). These Doppler US are color Doppler US (CDUS), pulsed Doppler US (PDUS), and superb microvascular imaging (SMI) examinations (6, 7). Intra-neural blood flow and density or vascularity can be visualized with color Doppler US. MN evaluation with US started with B-mode US, and in the last decade, in addition to B-mode, USG, PDUS, CDUS, and SMI are available for MN evaluation. As a result of these evaluations, in CTS patients; increased MN cross-sectional area (CSA), vascularity, hypoechogenity, and peak
Content of this journal is licensed under a Creative
systolic velocity (PSV) can be revealed (7-13). There are studies that investigate CTS severity with intraneural PSV (1, 8). There is limited information about the change of MN resistive index (RI) and its clinical significance in CTS patients (14).
Magnetic resonance imaging (MRI) and US are two important techniques for the diagnosis and severity assessment of CTS. MN CSA diffusion tensor imaging (DTI) findings obtained from different levels with MRI have been shown to be closely associ-ated with CTS severity (15, 16). In a study by Ikeda et al. (15), the CSA in the affected hand at the scaphoid body level was signifi-cantly larger rather than that in the unaffected hand. The CSA at the scaphoid body level positively correlated with distal motor latency in the affected hand. In a study by Wang et al. (16), the fractional anisotropy and apparent diffusion coefficient values obtained by DTI were reported to be closely associated with the diagnosis and severity of CTS. However, MRI for CTS evaluation is more expensive and difficult to reach than US examination. It was shown that MN CSA, MN vascularity increase, and MN-PSV and SMI were significant in order to determine the diagnosis and severity of CTS obtained by B-mode, CDUS, and PDUS (6, 7, 10, 11). However, other studies have reported no clear association between these findings and CTS severity (7, 12, 13). US is easily accessible, cheaper than the MRI, but is still not recommended as an objective and clear parameter. In most studies, MN vascularity has been shown to increase in CTS patients.
It has been shown that RI obtained from the renal artery, hepatic artery, splenic artery, and carotid artery determines the damage to the endothelium in these organs or related diseases (17-20). We think that MN compression, that occurs in patients with CTS, may also increase the RI and associated PDUS parameters in the arteries within this nerve by pressurizing the vasculature. There is limited information about the clinical use of the MN-RI value obtained by PDUS in CTS patients (14). In only one study, MN-RI values obtained by PDUS were reported to be significantly higher in patients with MN involvement than in those without MN involvement. However, this study did not give us any information on the relationship be-tween the MN-RI value and the severity of CTS disease (14). In this study, we aimed to investigate the relationship between PDUS findings of MN and CTS severity in patients diagnosed CTS with clinical and electrophysiological examinations.
METHODS
Patients and Study Design
One hundred and fifteen wrists of 82 patients (12 males, 70 fe-males, mean age 51.9±10.9 years) with CTS, who were referred to our physical medicine and rehabilitation outpatient clinic
be-tween April 2014 and April 2015, were evaluated on US, CDUS, and PDUS. CTS diagnosis was confirmed by both clinical and electrophysiological examinations. All patients had signs of paralysis, pain, and/or vasomotor symptoms of MN injury. For clinical assessment, provocative tests, including Allen’s test, Tin-nel test, and carpal compression test, were used. Patients with at least one positive provocative test were given preliminarily diagnosed with CTS. Electrophysiological examinations were performed using a four-channel Medelec Synergy (Oxford In-struments Medical, Surrey, UK) electromyography device. Neuro-physiological tests included nerve conduction studies and nee-dle electromyography for the median and ulnar nerves. Nerve conduction studies included measurement of the distal sensory and distal motor latencies and sensory/motor nerve conduction velocities. The exact diagnosis of CTS was made according to the most recently updated guidelines (21). CTS severity was classi-fied, on the basis of electrophysiological results, as mild, moder-ate, severe, or extreme, according to the modified scoring system of Padua et al. (22). Patients were excluded if they had polyneu-ropathy, radiculopathy, brachial plexus injury, proximal median neuropathy, diabetes mellitus, hypothyroidism, rheumatoid ar-thritis, amyloidosis, chronic renal failure managed by hemodialy-sis, pregnancy, and a history of surgery for CTS.
Forty-nine clinically and electrophysiologically normal wrists were included in the control group.
CDUS and electrophysiological evaluations were performed in all controls.
The study protocol was prepared according to the principles of the Declaration of Helsinki. The ethics committee of Baskent University Faculty of Medicine approved the study protocol, and each participant provided written informed consent.
Median Nerve Ultrasonography
All subjects were examined on B-mode and CDUS using a 13-MHz linear array transducer (Sonoline Antares; Siemens Medical Solutions, Inc., Hoffman Estates, IL, USA) in the neutral supine po-sition. All examinations were performed by a single radiologist who had 15 years of work experience. The MN from the distal forearm to the carpal tunnel outlet was assessed in the transverse and longitudinal planes. Three internal anatomic landmarks were used for the images. The images of the MN were obtained at the radial-ulnar junction immediately proximal to the flexor retinaculum, and at the level of the pisiform and the hook of the hamate (23, 24). MN vascularity was evaluated with CDUS, and flow velocity measurements were analyzed with PDUS. Repeated measurements and at least 8 waveforrms of intraneural arteries were obtained. PSV, end-diastolic velocity (EDV), pulsatility index (PI), and RI of intraneural arteries were measured on PDUS (Fig-ure 1). MN-RI and MN-PI values were meas(Fig-ured automatically by PSV-EDV/PSV formula, and PSV-EDV/MV (mean flow velocity) for-mula, respectively. The mean values of MN-PSV, MN-EDV, MN-PI, and MN-RI were recorded (Figure 1a-d).
Statistical Analysis
Continuous variables were expressed as mean±standard devi-ation (mean±SD), while categorical variables were reported as
Main Points:
• MN-RI increase is associated with disease severity in CTS patients.
• Increased MN-RI (>0.80) usually indicates increased CTS se-verity
counts and percentages. Comparisons of continuous variables were performed by the One-way ANOVA or Kruskal-Wallis 1-way ANOVA tests according to the distribution. For normally distribut-ed data, the Scheffe and Games-Howell tests were usdistribut-ed for mul-tiple comparisons of groups with respect to the homogeneity of variances. For non-normally-distributed data, the Bonferroni-ad-justed Mann Whitney U test was used for multiple comparisons of groups. The Chi-Square Test was used to compare categorical variables. Univariate analysis revealed demographic and Dop-pler US parameters that were significantly different in patients with CTS severity. For independent determination of patients who had severe disease for CTS, multivariate logistic regression analysis was performed. ROC curve analysis was performed to reassess markers that were independent for identifying patients with severe disease for CTS and to determine the threshold val-ues of these markers. The value of the area under the curve was used as the accuracy criterion of the test. The threshold for
statis-tical significance was set at p<0.05. All analyses were performed with SPSS 20.0 (IBM SPSS Corp.; Armonk, NY, USA) statistical soft-ware package.
RESULTS
The median MN-PSV, MN-EDV, MN-PI, and MN-RI values were 5.3 cm/s, 1.2 cm/s, 2.0 cm/s, and 0.79 cm/s, respectively. The medi-an values of the same parameters in patients with severe CTS were 7.2 cm/s, 1.1 cm/s, 2.71 cm/s, and 0.88 cm/s, respectively. The demographic findings and PDUS scores of the patients were evaluated according to the previously-mentioned CTS groups. In the control group, no hypervascularization was detected in any of the subjects.
Demographic and Ultrasonography Findings of the Study Groups
There was no significant difference between groups in terms of demographic (age and gender) parameters. MN- PSV, MN-PI, Figure 1. a-d. Color Doppler ultrasonography (CDUS) and pulsed Doppler ultrasonography (PDUS) findings of median nerve (MN) in carpal tunnel syndrome (CTS). (a) In patients with severe CTS; significantly increased intraneural vascularity of MN is demon-strated by CDUS. (b) In patients with severe CTS; significantly increased MN resistive index (MN-RI) is demondemon-strated by PDUS. The MN-RI is measured as 0.80. (c) In patient with mild CTS; mildly increased MN intraneural vascularity is demonstrated by CDUS. (d) In patient with mild CTS; MN-RI is measured as 0.23 with PDUS
a
c
b
d
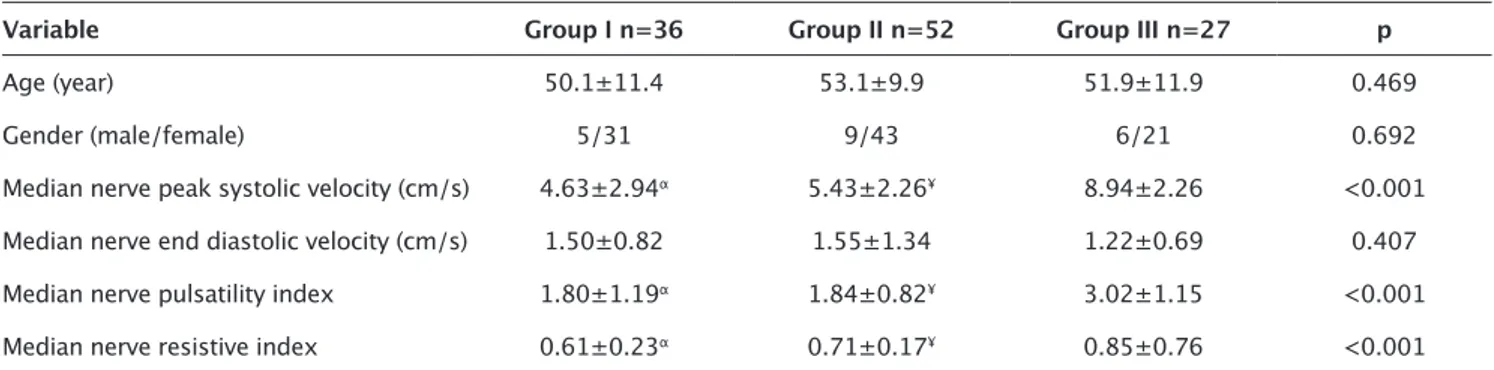
and MN-RI increased significantly from Group I to Group III, and these parameters were significantly higher in Group III than in the other two groups (Table 1, Figure 2 a-d). Also, PSV, MN-PI, and MN-RI were higher in Group II than in Group I, though the difference was not statistically significant (Table 1). MN-EDV was similar among the groups (Table 2, Figure 2b).
Multivariate Logistic Regression Analysis for the Detection of Patients with Severe CTS
Multivariate logistic regression analysis was performed to de-termine the closest relationship between CTS severity and age, gender, MN-PSV, MN-EDV, MN-RI, and MN-PI. Upon multivar-iate logistic regression analysis, it was found that only MN-RI independently identified the patients with severe CTS (Odds Ratio=3.449, 95% Confidence Interval: 1.147–8.392, p<0.001; Ta-ble 2). According to this analysis, increased MN-RI (per 0.1) was found to increase the risk of patients having severe CTS by 3.45 fold (Table 2)
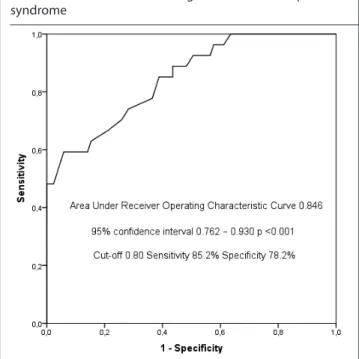
ROC Analysis for the Detection of Patients with Severe CTS
In the ROC analysis, the area under the curve was 0.846 for MN-RI for the prediction of severe CTS group (Area Under Receiver Operating Characteristic Curve=0.846, 95% Confidence Inter-val=0.762–0.930, p<0.001, p <0.05, Table 3 and Figure 3). An MN-RI value of 0.80 determined identified severe CTS with 85.2% sensitivity and 78.2% specificity.
DISCUSSION
The main finding in this study is that increased MN-RI obtained by PDUS independently predicts the severity of CTS patients. To our knowledge, this is the first study in the literature that inspects this relation. When the MN-RI cut-off value is taken as >0.80, it determines the risk of severe CTS development with ac-ceptable sensitivity and specificity.
Electromyography is recommended as the gold standard with electrophysiological examinations in the evaluation of patients Figure 2. a-d. Median nerve (MN) peak systolic velocity (a), MN end-diastolic velocity (b), MN pulsatility index (c) and MN resistive index (d) measurements of carpal tunnel syndrome severity groups
a
c
b
d
with CTS in daily practice and in determining disease severity (6). However, with electromyography, just electrophysiologi-cal properties of MN are shown. The MN entrapment status is shown indirectly. In addition, electromyography has electrode and needle placement problems (25). As a matter of fact, in or-der to complete these disadvantages and its deficiencies, MN US examination was recommended in the evaluation of CTS pa-tients in 1990 guidelines (26). US examination was initially pro-posed as an adjunctive one rather than a diagnostic one and used as an adjunctive modality for detecting nerve abnormal-ities (such as bifid MN), and mass lesions, or guiding injection treatments. The B-mode US of MN provides information about the nerve anatomy and also can detect the transverse carpal tunnel ligament pressure (5, 25). MN CSA is also calculated with B-mode US, and the CSA increase is reported to be associated with the presence of CTS and CTS severity (6, 27). However, in some studies, CSA and CTS severity are not related (7, 12, 13). In the CTS guidelines, MN CSA has been recommended as a new study on this issue because of the lack of the precise location of the measurement site and having a very good cut-off value
(21), because there are too many publications that have differ-ent threshold values (21).
Many studies have been carried out with the view that this in-creased vascularity is associated with direct nerve pressure may be associated with disease severity. Initially, CDUS was used, and in a large majority of these studies, MN vascularity was shown to be increased in CTS patients (6, 11, 28, 29) and reported to be import-ant for diagnosis. However, the question as to whether increased vascularity is associated with disease severity is unclear and has conflicting results. In some of these studies, the severity of CTS was associated with increased MN vascularity (10, 11), although some studies did not correlate with CTS severity (12, 25, 26, 30). At the same time, the increase in vascularity is a relative and subjec-tive measurement, resulting in a preference for flow velocity and pattern obtained with PDUS. The last published guideline also rec-ommended more objective studies of vascularity enhancement (21). With the recent MN-PSV study (1, 8), there is currently limited MN-RI examination as far as we have investigated, and our study is second in the literature (14). A similar study was performed
Table 1. Demographic and Doppler ultrasonography findings of the study groups
Variable Group I n=36 Group II n=52 Group III n=27 p
Age (year) 50.1±11.4 53.1±9.9 51.9±11.9 0.469
Gender (male/female) 5/31 9/43 6/21 0.692
Median nerve peak systolic velocity (cm/s) 4.63±2.94α 5.43±2.26¥ 8.94±2.26 <0.001
Median nerve end diastolic velocity (cm/s) 1.50±0.82 1.55±1.34 1.22±0.69 0.407
Median nerve pulsatility index 1.80±1.19α 1.84±0.82¥ 3.02±1.15 <0.001
Median nerve resistive index 0.61±0.23α 0.71±0.17¥ 0.85±0.76 <0.001
The values were shown as mean±standard deviation or n (%), Group I=Control group, Group II=Medical treatment group and Group III=Planed surgery group
αthe significant association between the Group I and Group III (p<0.05) βthe significant association between the Group I and Group II (p<0.05) ¥the significant association between the Group II and Group III (p<0.05)
Table 2. Variable regression analysis for the detection of patients with severe disease group
Variable Odds Ratio 95% Confidence Interval p
Age (year) 0.965 0.907–1.026 0.257
Gender (male/female) 0.588 0.113–3.052 0.528
Median nerve peak systolic velocity (cm/s) 1.194 0.972–1.466 0.091
Median nerve end diastolic velocity (cm/s) 0.325 0.039–2.728 0.300
Median nerve pulsatility index 0.927 0.372–2.310 0.870
Median nerve resistive index 3.449 1.147–8.392 <0.001
Table 3. Receiver Operating Characteristic analysis for the detection of patients with severe disease group
Variable Area Under Receiver Operating Characteristic Curve p Cut-off value Sensitivity Specificity
Median nerve resistive index 0.846 (0.762–0.930) <0.001 0.80 85.2% 78.2%
by Sayed et al. (14), and 28 patients with CTS were evaluated by electromyography. In patients with MN involvement, MN-RI val-ues were reported to be significantly higher than those without MN involvement. The most important limitation in the Sayed et al. (14) study is that the number of patients evaluated is low, and the MN-RI value and its importance in patients with severe CTS is not stated. In our study, CTS severity in 115 wrists was evaluated according to electrophysiological examinations, and MN-RI levels were significantly higher in patients with severe CTS than in other groups. In addition, when we were taken as a 0.80 threshold value, we showed that patients with severe CTS were determined with acceptable sensitivity and specificity.
MN-PI was not observed directly in the MN vascularity increase re-gion, PI was observed in arterial radialis indicis and arterial radialis palmaris from the 1st and 5th fingers while resting and provocation
and it has been reported that the decline in PI value obtained by both resting and provocation from arterial radialis indicis passing through the carpal tunnel is greater in patients with moderate to advanced CTS (29). As a result of the study, patients with CTS were reported to have impaired vasomotor function with PDUS that was reported to be associated with the severity of CTS disease (29). In another study similar to the previous study, the MN intraneural flow pattern was used. This study by Evans et al. (1) investigated MN intraneural flow. The mean PSV obtained from the CT entry of patients with CTS was found to be significantly lower. However, the findings of this study are contradictory to those of previous CTS studies. In the study conducted by Evans et al. (1), MN-RI eval-uation was performed in addition to MN-PSV in PDUS evaleval-uation, even though MN-PSV evaluation was performed, but they did not give us any information about MN-RI importance. It is clear that MN-RI significantly increased in the prevalence of CTS. The most pertinent problem in this study was reported to be that MN-PSV
values were lower in patients with CTS than in in asymptomatic cases (1). Although vascularity decreases in this study, increased MN vascularity has been reported in the majority of studies (6, 11, 28, 29). Wilder-Smith et al. (8) reported that the MN-PSV value ob-tained by Evans et al. (1) was significantly low. Our study value was very close to the value reported by Wilder-Smith Therimadasamy (8) In all patients with CTS, the mean median value was 5.3 cm/s; the MN-PSV value increased with disease severity and the median value in the severe CTS group was 7.2 cm/s. This value in our study is compatible with that reported by Wilder-Smith Therimadasamy (8) and there is no other threshold value in the literature to the best of our knowledge.
In 2010, inconsistencies in the studies on MN CSA enhancement (7, 13), and the subjectivity of data on increased vascularity and hypoechogenicity were directed us towards the PDUS, but several studies have also been discordant (1, 8). It is clear that there is a need for an US parameter that is different from these parameters in patients with CTS; this should be physiopatho-logically appropriate, more objective and acceptable. For this reason, the hypothesis that RI values obtained from intraneu-ral arteries that have not previously been used in patients with CTS may be associated with the severity of CTS. It is certain that the increase in vascularity, that is the result of compressed MN, is encountered by an increased resistance. For this reason, MN-RI is thought to be increased. Evans et al. (1) demonstrated that there is an increase in MN-RI in CTS, but they did not empha-size this finding in their studies. This is because in those years there was not much data available on RI evaluation (especially renal RI), especially for other organs, and the importance was not as much as it is today. In our study MN-RI was found to in-crease with the increasing severity of patients with CTS. MN-RI also independently determines the severity of CTS better than the other PDUS parameters associated with CTS (including MN-PSV). When the MN-RI threshold value is taken as 0.80, it identifies patients with severe CTS with acceptable sensitivity and specificity. To the best of our knowledge, this is the first in the literature as far as we investigate these findings and we could not find a new threshold to compare. CTS severity is not associated with MN-EDV in this study. Intraneural MN-PSV and MN-PI values were associated only in univariate analysis, but no significant correlation was found in multivariate analyses. In conclusion, PDUS findings may contribute to the diagnosis of CTS, its severity, and its treatment plan. This method can be used as a noninvasive method in cases in that electromyogra-phy cannot be performed.
A major limitation of our study is that our study was performed in a single center, it had a cross sectional design, and included a limited number of patients. The results of MN-RI and other studies could not be compared due to the lack of sufficient data on MN-RI values and its clinical availability in patients with CTS in the literature. For this reason, more studies with bigger sam-ples are needed. In our study, CSA and hypoechogenicity with B-mode US were not evaluated because of the conflicting results of many studies. A new review of MN vascularity was not evalu-ated in our study. Better and more meaningful results could be obtained if we had assessed the SMI in our study.
Figure 3. Receiver operating characteristic curves with median nerve resistive index for the diagnosis of severe carpal tunnel syndrome
CONCLUSION
According to our results, the increase in the MN-RI in CTS pa-tients is independently associated with disease severity and may be used in the clinical follow-up of these patients. We think that MN-RI evaluation should be a part of the assessment of CTS. Clinicians should consider patients with MN-RI >0.80, as serious CTS.
Ethics Committee Approval: Ethics committee approval was received for this study from the ethics committee of Başkent University School of Medicine (24.06.2015/ KA15/204).
Informed Consent: Written informed consent was obtained from partic-ipants who participated in this study.
Peer-review: Externally peer-reviewed.
Author Contributions: Concept - B.Ç.P.; Design - B.Ç.P., P.D.A.; Supervision - B.Ç.P., M.T.P.; Resources - B.Ç.P., P.D.A.; Materials - B.Ç.P., P.D.A.; Data Col-lection and/or Processing - B.Ç.P.; Analysis and/or Interpretation - B.Ç.P., M.T.P.; Literature Search - B.Ç.P., M.T.P.; Writing Manuscript - B.Ç.P., M.T.P.; Critical Review - B.Ç.P., M.T.P.; Other - B.Ç.P., M.T.P., P.D.A.
Acknowledgements: We thank Naime Altınkaya and Mevlüt Koç for sta-tistical assistance.
Conflict of Interest: The authors have no conflicts of interest to declare. Financial Disclosure: The authors declared that this study has received no financial support.
REFERENCES
1. Evans KD, Volz KR, Hutmire C, Roll SC. Morphologic Characterization of Intraneural Flow Associated With Median Nerve Pathology. J Di-agn Med Sonogr 2012; 28: 11-9. [Crossref]
2. de Krom MC, Knipschild PG, Kester AD, Thijs CT, Boekkooi PF, Spaans F. Carpal tunnel syndrome: prevalence in the general population. J Clin Epidemiol 1992; 45: 373-6. [Crossref]
3. Porth CM. Essentials of Pathophysiology. 3. Philadelphia: Lippincott Williams & Wilkins 2011.
4. Bianchi, S, Martinoli C. Ultrasound of the Musculoskeletal System. Berlin: Springer-Verlag 2007. [Crossref]
5. Özçakar L, Kara M, Chang KV, Çarl AB, Akkaya N, Tok F, et al. Nineteen reasons why physiatrists should do musculoskeletal ultrasound: EU-RO-MUSCULUS/USPRM recommendations. Am J Phys Med Rehabil 2015; 94: 45-9. [Crossref]
6. Vanderschueren GA, Meys VE, Beekman R. Doppler sonography for the diagnosis of carpal tunnel syndrome: a critical review. Muscle Nerve 2014; 50: 159-63. [Crossref]
7. Karahan AY, Arslan S, Ordahan B, Bakdik S, Ekiz T. Superb Microvas-cular Imaging of the Median Nerve in Carpal Tunnel Syndrome: An Electrodiagnostic and Ultrasonographic Study. J Ultrasound Med 2018; 37: 2855-61. [Crossref]
8. Wilder-Smith EP, Therimadasamy A. Nerve blood flow. J Ultrasound Med 2013; 32: 187-8. [Crossref]
9. Ghasemi-Esfe AR, Khalilzadeh O, Mazloumi M, Vaziri-Bozorg SM, Niri SG, Kahnouji H, et al. Combination of high-resolution and color Doppler ultrasound in diagnosis of carpal tunnel syndrome. Acta Radiol 2011; 52: 191-7. [Crossref]
10. Ghasemi-Esfe AR, Khalilzadeh O, Vaziri-Bozorg SM, Jajroudi M, Shaki-ba M, Mazloumi M, et al. Color and power Doppler US for diagnosing carpal tunnel syndrome and determining its severity: a quantitative image processing method. Radiology 2011; 261: 499-506. [Crossref] 11. Mohammadi A, Ghasemi-Rad M, Mladkova-Suchy N, Ansari S. Correla-tion between the severity of carpal tunnel syndrome and color Doppler sonography findings. AJR Am J Roentgenol 2012; 198: 181-4. [Crossref]
12. Bayrak IK, Bayrak AO, Tilki HE, Nural MS, Sunter T. Ultrasonography in car-pal tunnel syndrome: comparison with electrophysiological stage and motor unit number estimate. Muscle Nerve 2007; 35: 344-8. [Crossref] 13. Kwon HK, Kang HJ, Byun CW, Yoon JS, Kang CH, Pyun SB. Correlation
between Ultrasonography Findings and Electrodiagnostic Severity in Carpal Tunnel Syndrome: 3D Ultrasonography. J Clin Neurol 2014; 10: 348-53. [Crossref]
14. Sayed Z, Hazim T, Neven Fa, Manal A. The value of power and pulsed Doppler in the diagnosis of CTS: Is a solution in sight. The Egyptian Jour-nal of Radiology and Nuclear Medicine 2013; 44: 589-96. [Crossref] 15. Ikeda M, Okada M, Toyama M, Uemura T, Takamatsu K, Nakamura H.
Comparison of Median Nerve Cross-sectional Area on 3-T MRI in Patients With Carpal Tunnel Syndrome. Orthopedics 2017; 40: 77-81. [Crossref] 16. Wang CK, Jou IM, Huang HW, Chen PY, Tsai HM, Liu YS, et al. Carpal
tunnel syndrome assessed with diffusion tensor imaging: compari-son with electrophysiological studies of patients and healthy volun-teers. Eur J Radiol 2012; 81: 3378-83. [Crossref]
17. Ninet S, Schnell D, Dewitte A, Zeni F, Meziani F, Darmon M. Doppler-based renal resistive index for prediction of renal dysfunction reversibility: A sys-tematic review and meta-analysis. J Crit Care 2015; 30: 629-35. [Crossref] 18. Tanaka K, Numata K, Morimoto M, Shirato K, Saito S, Imada T, et al. El-evated resistive index in the hepatic artery as a predictor of fulminant hepatic failure in patients with acute viral hepatitis: a prospective study using Doppler ultrasound. Dig Dis Sci 2004; 49: 833-42. [Crossref] 19. Zhang L, Duan YY, Li JM, Yin JK. Hemodynamic features of Doppler
ultrasonography in patients with portal hypertension: intraoper-ative direct measurement of portal pressure in the portal venous system. J Ultrasound Med 2007; 26: 1689-96. [Crossref]
20. Frauchiger B, Schmid HP, Roedel C, Moosmann P, Staub D. Comparison of carotid arterial resistive indices with intima-media thickness as sono-graphic markers of atherosclerosis. Stroke 2001; 32: 836-41. [Crossref] 21. Graham B, Peljovich AE, Afra R, Cho MS, Gray R, Stephenson J, et al.
The American Academy of Orthopaedic Surgeons Evidence-Based Clinical Practice Guideline on: Management of Carpal Tunnel Syn-drome. J Bone Joint Surg Am 2016; 98: 1750-4. [Crossref] 22. Padua L, LoMonaco M, Gregori B, Valente EM, Padua R, Tonali P.
Neu-rophysiological classification and sensitivity in 500 carpal tunnel syndrome hands. Acta Neurol Scand 1997; 96: 211-7. [Crossref] 23. Bayrak IK, Bayrak AO, Kale M, Turker H, Diren B. Bifid median nerve in
pa-tients with carpal tunnel syndrome. J Ultrasound Med 2008; 27: 1129-36. [Crossref]
24. Altınkaya N, Leblebici B. Prevalence of persistent median artery in carpal tunnel syndrome: sonographic assessment. Surg Radiol Anat 2016; 38: 511-5. [Crossref]
25. Öztürk GT, Malas FÜ, Yildizgören MT, Baki AE, İnal EE, Batmaz İ, et al. Ultrasonographic Assessment of the Femoral Cartilage Thickness in Patients with Pes Planus: A Multicenter Study by TURK-MUSCULUS. Am J Phys Med Rehabil 2015; 94: 568-72. [Crossref]
26. Cartwright MS, Hobson-Webb LD, Boon AJ, Alter KE, Hunt CH, Flores VH, et al. Evidence-based guideline: neuromuscular ultrasound for the diagnosis of carpal tunnel syndrome. Muscle Nerve 2012; 46: 287-93. [Crossref] 27. Akcar N, Ozkan S, Mehmetoglu O, Calisir C, Adapinar B. Value of
power Doppler and gray-scale US in the diagnosis of carpal tunnel syndrome: contribution of cross-sectional area just before the tun-nel inlet as compared with the cross-sectional area at the tuntun-nel. Korean J Radiol 2010; 11: 632-9. [Crossref]
28. Ozcan HN, Kara M, Ozcan F, Bostanoglu S, Karademir MA, Erkin G, et al. Dynamic Doppler evaluation of the radial and ulnar arteries in patients with carpal tunnel syndrome. AJR Am J Roentgenol 2011; 197: 817-20. [Crossref]
29. Ghasemi-Esfe AR, Morteza A, Khalilzadeh O, Mazloumi M, GhasemiEsfe M, Rahmani M. Color Doppler ultrasound for evalua-tion of vasomotor activity in patients with carpal tunnel syndrome. Skeletal Radiol 2012; 41: 281-6. [Crossref]
30. Yoshii Y, Tanaka T, Ishii T. Correlations of median nerve area, strain, and nerve conduction in carpal tunnel syndrome patients. Hand 2016; 11: 161-7. [Crossref]