The Factors Influencing Voting Preferences in Local Elections “An Empirical
Study”
Dr. İhsan Kurtbaş
1Abstract
Although the literature generally makes generalisations suggesting that the local elections are a rehearsal of general elections, local elections are indeed sui generis in terms of their resources, pressure groups, political dynamics, voter preferences and the factors influencing those preferences. This study was conducted by surveying during the Local Elections of 29 March 2009. Results of the experimental data obtained in this study suggested that approximately one out of every ten voters did not care about the vote they were using. 48.4% of voters conducted no or very little research before elections. Approximately one out of every four voters said they would not support the candidate or the party that has no chance of winning in the elections. Meanwhile, with 28.7%, a large portion of the voters said the most important factor that influenced their preferences in local elections was the ideology of the candidate. As the level of income increased, the number of people who were interested in party cadres and the candidate’s knowledge of local problems while the number of those who were inclined to always vote for the same party. As the level of education increased, the number of people who cared for the former activities of the candidate increased whereas the number of people who valued that the candidate’s party was in power or who were inclined to always vote for the same party.
Keywords:
Politics, (Local) Elections, Factors Influencing Voting BehaviourIntroduction
Factors that influence voting behaviour in particular and voter’s behaviour in general are an important subject that is widely addressed in political science and sociology. As the factors that influence voters’ preferences are better understood, politics get closer to the ideal of creating a “common good” for the people, settling issues and ensuring social welfare and integrity. Therefore, whenever politics, which is the only method in this framework, has left it to other methods to fulfil these goals, the price was paid by the “human suffering” which is always the price for wrong politics. In today’s world where sicknesses, poverty and wars terrorise the entire planet, politics obviously has a long way to go. This is an empirical study that aims to understand the factors that influence the political choices of voters and the extent of their influence. It is believed that the data obtained in this study will contribute to the literature of political science and of other relevant areas. Furthermore, it will give interested parties an opportunity to better understand the voter – with respect to the local elections.
1 – Conceptual Framework
1.1. Politics and Local Politics 1.1.1. Politics
The world does not have a fixed order. If it did, there would be no need for politics. The thing that makes politics possible is the fact that disorder is as much a part of life as is order (Bilgin, 2005: 15). Since, in this context, almost everything is political, examining policy means examining almost everything (Roskin et al.; 2013, 18-19) and there are almost as many political definitions as the number of authorities who argue an opinion. One of the most widely known definitions of politics highlights the “power” on which power relations are based. In essence, politics is power. It focuses on achieving the intended target, namely to have and maintain power, by employing all tools available (Türköne, 2012: 30). Weber defines politics as “the individual’s having dominance over other individuals” (Kışlalı, 2010: 27). On the other hand, picturing politics as “a process of dialogue and negotiations” when defining it is also a widely used approach.
1
Asst. Prof.; Faculty of Economics and Administrative Sciences (Vice Dean), The Department of Political Science and Public
Administration at Ardahan University, Turkey and Director of Ardahan Social and Economic Research and Application Center
On this issue, Habermas (2012: 157) says that “politics consists of discussion(s) that parties have to clarify how they will agree with each other and in what kind of a society they want to live in”. Therefore, politics is a process and an activity in and by which the people and societies take, implement, regulate and protect the political decisions they live by. There are some common points established in the majority – if not all - of the definitions of politics (Heywood, 2014: 64): “Although politics is regarded as an academic discipline, it is clearly the study of the activity of politics. Second, politics is a social activity that arises out of interaction between people; it did not, for examples occur on Robinson Crusoe’s island (though it certainly did once Man Friday appeared). Third, politics develops out of diversity, the existence of a range of opinions, wants, needs or interests. Fourth, this diversity is closely linked to the existence of conflict: politics involves the expression of differing opinions, competition between rival goals or a clash of irreconcilable interests. Finally, politics is about collective decisions which are in some way regarded as binding on people. It is through such decisions that conflict is resolved. However, politics is better thought of as the search for conflict resolution rather than its achievement since not all conflicts are, or can be, resolved.” According to Kapani, all definitions of politics mainly gather around two differing and contesting views: “The first is that politics, whose main subject is to share values in society and whose target is to grab power, is a conflict, a struggle and a fight that arises out of sharing the benefits (blessings) of that power”. In this process of struggle, fight and conflict, like Barber says (1995:71) “politics has the risk of transforming into the original method of plundering from which humans need to be protected”. Meanwhile, scholars representing contesting opinions argue that the objective of politics is, above all else, to ensure the unity of the society; achieve general interests and “common wellbeing” of people by confronting personal interests; and to endeavour to set up a social order that is to the benefit of all.” The existing socio-cultural environment is crucial for such politics: if people cannot place the interests of the society before their personal and pecuniary advantages, the ideal of building the “common wellbeing” will hardly be achieved. In other words, if parties in a dispute or conflict aspire after returning from the negotiations table with exactly what they brought or more, it will become more difficult to take the decisions at that table which will build a social order benefiting all the people.
On the other hand, political participation, which is the key to the functionality of politics that’s one and only actor is the human being, must use the correct instruments and work properly. Political participation can be defined as “successful or unsuccessful legal or illegal attempts by citizens, which are designed either by themselves or others to influence the staff or the decisions of central or local state organs” (Anık, 2000: 161). Political participation which the American political scientist Robert Dahl describes as “interest; caring; information and action (Kapani, 2009: 144)” in fact consists of “a wide range of approaches and a range of influence from simple curiosity and interest in politics to taking political action.” (Tokgöz, 2008: 177). Meanwhile Özbudun talks about the four drivers that encourage people towards political participation: “personal commitment; solidarity; interests and the feeling of citizenship” (Anık, 2000: 161 and Özer, 2004: 88). Apolitical positions and a tendency towards alienation, which are distinct from these four drivers, may drag politics into a deadlock. Seeman argues that there are four types of political alienation: powerlessness, normlessness, meaninglessness and isolation. Political powerlessness is the individual’s expectation of the extent of his/her behaviours’ influence on the fulfilment of the desired political outcome. The more negative this expectation is, the more powerless the individual feels. Normlessness is when the individual feels that the authorities with political roles constantly and systematically violate the valued political rules and established traditions before the people. Meaninglessness is felt when the individual fails to understand how the political system works because then s/he will see politics as an unorganised, coincidental and uncontrollable event or chain of events. Isolation which is the fourth type of political alienation, accords very little value to the goals and beliefs shared by the other members or the majority of the society. Isolation starts with the rejection of political goals, norms and tools widely shared by the other members of the political society (or the entire society) (Alkan and Ergil, 1980: 251-254).
1.1.2. Local Politics
As per Article 127 of the Constitution of the Republic of Turkey, local administrations are public corporate bodies established to meet the common local needs of the inhabitants of provinces, municipal districts and villages, whose principles of constitution and decision making organs elected by the electorate are determined by law tbmm.gov.tr/docs/constitution_en). In this framework, the concept of “local services” means services which are not nationwide but which are provided for a place, precinct, location or region and its residents (Özel et al. 2009: 35).
Contrary to national politics, in local politics there are local power elites, local sources and contenders (Aydın, 2008: 314). Local politics is a power struggle among individuals and institutions engaging in legal activities on a city-level (Önder, 2008: 188) where they address problems and issues concerning the city and its people. It is also the art of managing the local society through local administration and authority by mobilising local sources and means to ensure the happiness, welfare and justice for the local citizens (Akdoğan, 2008: 10). This means that local politics covers all issues pertaining to the city and the urbanisation process. Issues such as the relationship between countryside and city, the local authority and the state or the local elections can all be discussed in the context of local politics (Çukurçayır, 2008: 23). Moreover, local politics is distinguished as a concept which examines the efficiency of the local socio-economic dynamics, geographical factors, local social fractions and interest groups in determining local and national authorities and influencing their decisions. It also examines the interactions these groups develop with the authorities and the impacts of all these on the general political picture (Aydın, 2008: 314). So, for people who are exposed to the effects of the local political authority’s judgement calls, the need to identify their own fate, influence the political decisions and guide the policies to be implemented is turned into action through the active participation channels provided by democratic systems (Dursun, 2008: 82).
2- Empirical Study
2.1. Objective and Importance of the Study
This study aims to better understand the local elections and the voters’ behaviours from the perspective of local politics. Thus, the study tries to understand the factors that influence voters’ political choices and the extent of each factor’s influence. It is believed that the analyses herein will contribute to the political science and relevant disciplines. Moreover, the study is expected to hep political actors, academicians and interested parties better understand the voter.
2.2. Methodology of Research
This study was conducted by using the survey technique on 478 voters on 29 March 2009 Elections in the province of Elazığ. The survey form was first used with a control group of 50 people. Consequently, unclear or insufficient questions were edited. In the field, surveys were given to each participant individually and their responses were recorded accordingly. To ensure the objectivity and accuracy of their answers, participants were not asked to give their names or ID details. The SPSS package programme was used in the analyses of the obtained data and the relationship between the variables was tested by Chi-square test. The study was constrained to the province of Elazığ and to voters who were 18 years and older.
2.3. Findings and Assessments
2.3.1. Socio-Demographic Features of Participants
Of the participants, 36.3% were women; 63.7% were men; 57.3% were married; 42.7% were bachelors. In terms of age, 34.5% were between 18-25 years; 26.2% were between 26-35 years; 29.4% were between 36-55 years, and; 9.9% were 55 years and older. As for the income level, a very large group, as much as 36.6% of the participants earned minimum wage - which was 500 TL at the time- or lower, 32.25% earned between 501 – 1000 TL; 21% earned 1001 to 1500 TL, and; 7.7% earned 1501 to 2000 TL. A very small group of participants, only 2.4%, earned 2001TL and above per month2. In terms of their occupation, participants’ stats were as follows: 23.9% was working in private sector; 17.5% was working in public sector; 19.2% was housewives; 25.9% was students; 5.4% was unemployed; 1.5% was farmers and 6.7% was retired. In terms of education level, 5.1% was illiterate. Of the participants, 18% was primary school graduate; 8.5% was secondary school graduate; 25.4% was high school graduate; 40.2% was university graduate and 3% was postgraduate.
2
At the time of the Survey, 1 US Dollar was 1.6682 TL; today (30 June, 2015) 1 US Dollar is 2.6863TL. Source: www.mevzuatbankasi.com/portal/doviz_kurlari_liste.asp?doviz_id=1&doviz_yil=2009&doviz_ay=3
2.3.2. Rate of Voter’s Voting Experience in Local and General Elections
Table 1: Participants’ Rate of Voting Experience in Local and General Elections How many times did you vote in
Local Elections?
f % How many times did you vote in General
Elections?
f %
Once including these elections 139 29,2 Once including these elections 109 24,1 Including two or more including
these elections
337 70,8 Including two or more including these elections
344 75,9
Total 476 100 Total 453 100
29.2% voted for the first time in the local elections and 24.1% in the general elections, whereas 70.8% said they were voting for the second time or more in the local, and 75.9% in the general elections. About one fourth of the participants said the 2009 local elections were the first time they had ever used a vote. These data are important in making the socio-political and psycho-political analyses of the voters’ mood before and after voting because first time voters and experienced voters will have different political experiences, therefore their emotional status will differ as well.
2.3.3. Importance the Voters Attach to the Local and General Elections
Table 2: Importance the Voters Attach to the Local and General Elections
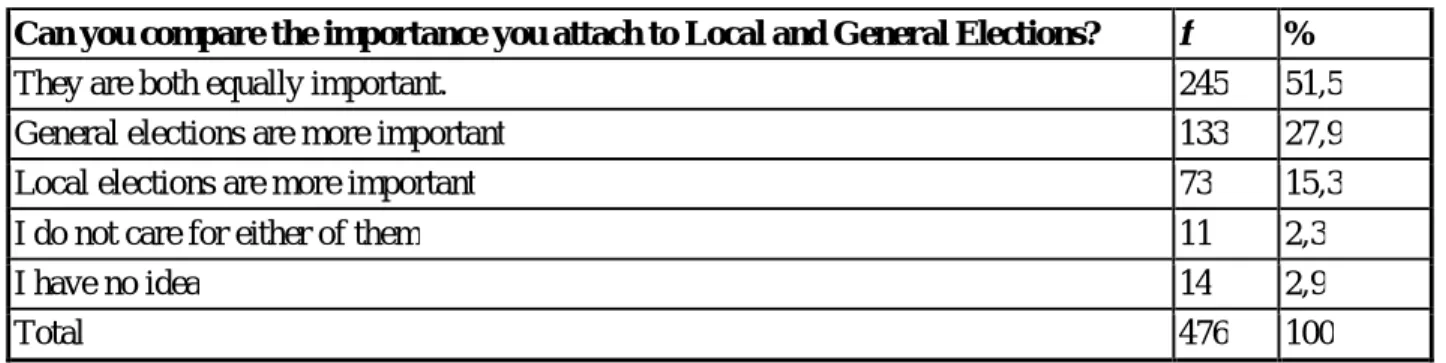
Can you compare the importance you attach to Local and General Elections? f %
They are both equally important. 245 51,5
General elections are more important 133 27,9
Local elections are more important 73 15,3
I do not care for either of them 11 2,3
I have no idea 14 2,9
Total 476 100
According to 51.5% of the voters local and general elections both had equal weight while for 27.9% the local elections and for 15.3% the general elections were more important. In addition to this, 2.3% of the participants said they did not care about either elections, while another 2.9% said they did not have any particular opinion. Since the percentage of voters who think the local elections are more important was only 15.3, this means that there are too few people who care about local policies that would produce a solution to their local problems. It is possible that the strong central governance in Turkey; the perception that the general elections are about Turkey’s general issues; and the belief that the body that will govern Turkey is determined only in general elections might have caused people to attach greater importance to the general elections.
The Relationship between Socio-Demographic Factors and the Importance Voters Attach to Local and General Elections
As age increased, the percentage of those who cared about the local elections more increased as well, the percentage of those who cared about the general elections decreased. As the education level increased, the percentage of those who said “local elections are more important” increased, while the percentage of those who said “general elections are more important” decreased. These data indicate that people with higher education levels attach greater importance to general elections whereas people with low education levels attach greater importance to local elections. As the level of income increased, the percentage of those who cared about the general elections more increased. As the level of income decreased, the percentage of those who said “I do not care about the local or general elections” increased. These data demonstrate that older people and people with lower education and income levels are more invested in their local problems and they consider local politics as a stronger saviour for the solution of local issues. So, the research found that as age increased and socio-economic and socio-cultural levels decreased, the level of importance attached to local politics increased.
The Relationship between the Number of Times Participants Voted in the Local Elections and the Importance They Attach to General Elections
Table 3: The Relationship between the number of times the participants voted in Local Elections and the Importance they attach to Local and General Elections
Can you compare the importance you attach to Local and General Elections?
L oc al E le ct ions a re m or e im por ta nt G ene ra l el ec ti ons ar e m or e im por ta nt I do not c ar e for ei the r of t he m B ot h ar e im por ta nt I ha ve no ide a T ot al
How many times did you vote in the Local Elections? This is the first time f 18 48 5 63 5 139 % 12,9 34,5 3,6 45,3 3,6 100 Twice or more f 53 83 6 182 9 333 % 15,9 24,9 1,8 54,7 2,7 100 f 71 131 11 245 14 472 % 15,0 27,8 2,3 51,9 3,0 100
Since (2) P: 0,13>0,05 there is no significant relation between the two variants.
The survey demonstrated that 34.5% of those who voted for the first time in their lives and 24.9% of those who had voted before thought the general elections were more important, whereas 15.9% of those who had voted at least twice before thought the local elections were more important. On the other hand, 54.7% of people who had voted at least twice before and 45.3% of people who voted for the first time considered both the local and general elections equally important. So, it is evident that for the first time voters the general elections, and for more experienced voters (those who had voted at least twice or more) the local elections are more important.
2.3.4. Voters’ Commitment to Elections
Table 4: Voters’ Commitment to Elections
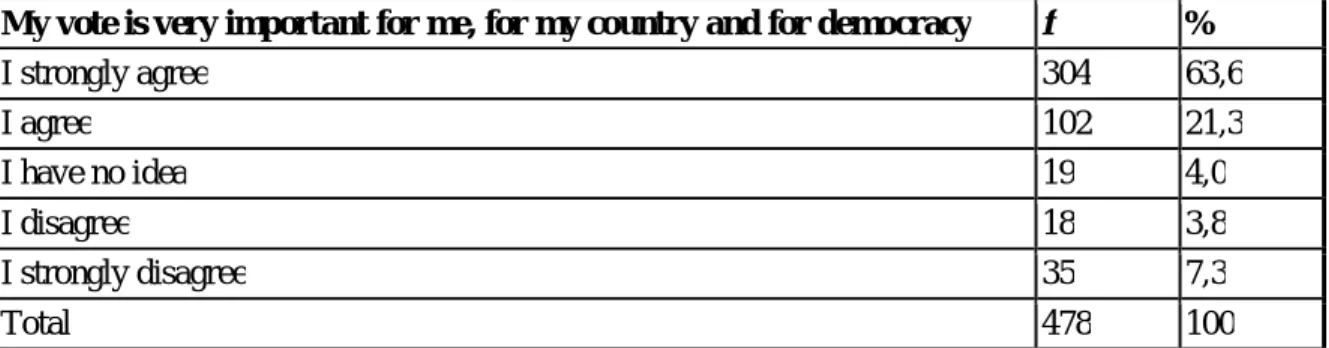
My vote is very important for me, for my country and for democracy f %
I strongly agree 304 63,6 I agree 102 21,3 I have no idea 19 4,0 I disagree 18 3,8 I strongly disagree 35 7,3 Total 478 100
As large a portion of the voters as 84.9% consider the vote they will cast an important tool for themselves, for their country and for democracy, while 11.1% think votes were unimportant. About one out of every ten voters does not care about using a vote, which is one of the most functional instruments of political participation. Such apolitical tendencies are in fact significant problems that lead politics, the most important fuel of which is the human, towards a stalemate.
The Relationship between Socio demographic Factors and Voters’ Commitment to Elections
Meanwhile 86% of the people who make 500 TL or less in a month, 85.1% of people who make between 501 TL and 1500 TL in a month and 84.8% of people who make more than 1500 TL believe that the votes they cast in local elections are important. Although the difference between these figures is around 1%, it still shows that the number of people who thought their vote important decreased as the level of income increased. Politics, above all else, is a culture of reconciliation in which the conflicting parties place the interests of the general society before their personal financial or actual interests, if need be.
What we see in this survey, namely the fact that people of higher income do not care about the votes they use is rather meaningful. People with lower incomes thought their votes were important to improve/correct the current situation and may have even considered voting a saving act. This means that the higher the expectations of politics, the greater the importance attached to voting.
3.5. Bandwagon and Underdog Effects
Table 5: Participants’ Tendency to Vote for Parties That Do Not Have a Chance of Winning Which political party do you think will
win in these elections
f % If the party you voted for did
not have a chance of winning, would you still vote for them?
f %
The party I will vote for 308 64,6 Yes, I would 330 69,2
Another party than the one I will vote for 85 17,8 No, I would not 120 25,2
I do not know – I have no idea 84 17,6 I have no idea 27 5,7
Total 477 100 Total 477 100
Before voting, a very large portion of the participants, as much as 64.6%, thought their party would win the elections whereas a significant portion as 17.8% thought another party would win. American researchers argue that there are only two possibilities if the voter evaluates the poll results and decides to change the political party s/he has been supporting till then: the first possibility is that they will tend to follow the winner (bandwagon effect) which means that they will incline towards the party that comes out as the winner in the public polls. The second possibility is that they will tend to vote for the party that is expected to lose in the elections by a landslide (the under-dog effect) which means that they will support the party or the candidate that has fallen far behind in the list (Yaşın, 2006: 646). In this research, 69.2% of the voters said they would still vote for the same party even if that party did not have any chance of winning the elections. We must look at this issue from two different angles: First for approximately 70% of the voters, the possibility that their “supported candidate may lose in the elections” does not influence their decision. According to this, Bandwagon effect has no effect on a large portion of voters, as high as 70%. Second, the tendency of “not voting for the party/candidate that is unlikely to win” is something shared by almost 30% of the voters. Comparatively, the fact that a single factor can become detrimental for a large portion of the voters shows the importance of the Bandwagon effect. In a 2013 study in political sociology where both qualitative and quantitate methods were employed, it was identified that voters were voting for a losing party for three main reasons (Kurtbaş, 2013: 571): First harbouring extremely political and ideological views. This group of voters use their votes in line with their extreme political and ideological views, for a cause, and argue that they cannot deny who they are for fear of their votes getting lost. Therefore, since the “vote” is considered a part of the supported “cause”, voting for what one believes means that s/he is defending his/her thoughts, ideas and identity. As an ideological stance, voting itself requires that these values are upheld. From another viewpoint, achieving a certain percentage of votes in the elections also gives a collective message to the ‘other’ party. The second reason is tradition: this group of people always votes for the same party, regardless of that party’s chances of winning in the elections, because it is a tradition they learnt from their fathers. The third is lack of political interest, knowledge and awareness. Driven by their inter-group connections, this group of voters gives a lot of “votes as a favour3”.
The percentage of women who said in the survey “Even if the party I support did not have any chance of winning the elections, I would still vote for them without faltering” was 71.5% meanwhile, this percentage was 67.5% for men. The percentage of men who said “I would never vote for a party/candidate that is destined to lose” was 27.1, whereas this figure was 22.1 for women. From this perspective, it is evident that the men’s tendency to stand by the winner (Bandwagon effect) is higher. Similarly, while older voters tend to vote for the party that is likely to win, younger voters have fewer tendencies to do so (73% of 18-25 year old voters, 69.4% of 36 – 55 year old voters and 66.4% of voters 56 year old and older). The bandwagon effect on older voters is high while it is low on younger voters.
3
Favour Votes: A type of vote given to a party/candidate upon the request of a loved and respected person who cannot be turned down.
As the education level increases, the number of voters who would still vote for the party they have been supporting even if that party had no chance of winning increases as well (47,8% of illiterate voters, 70,4% of primary school graduates, 75,4% of university graduates and 68,1% of post graduates). So, as the level of education increases, the level of Bandwagon effect decreases. As the level of income increases, the number of voters who would still vote for the party they have been supporting even if that party had no chance of winning decreases (72.7% of the people who make 500 TL or less in a month, 67.9% of people who make between 501 TL and 1500 TL in a month and 56.5% of people who make more than 1500 TL in a month). According to these data, voters with high incomes have a low tendency to vote for parties/candidates that are unlikely to win, while voters with low incomes have a high tendency to vote for the party/candidate they support even though they do not stand a chance in the elections.
2.3.6. Voters’ Political Interest and Awareness
Table 6: Voters’ Political Interest and Awareness
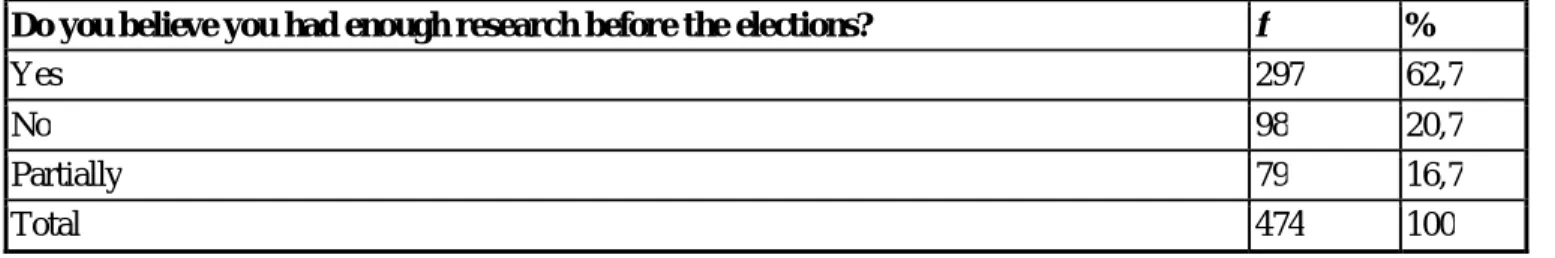
Do you believe you had enough research before the elections? f %
Yes 297 62,7
No 98 20,7
Partially 79 16,7
Total 474 100
62.7% of the voters said they had enough research on the parties and candidates before using their votes while a very significant portion, 48.2%, said they conducted very little or no research at all before elections.
The Relationship between Socio demographic Factors and Performing Research Before Elections
Men (70.9% said yes, 12.4% said no) conduct more research on parties/candidates before elections than women do (48.3% said yes, %24.4% said no). Therefore, in terms of knowledge and awareness, women are more outside the political area than the men are. According to Sears (1987: 237) women’s participation in politics is minimal because they are probably dependant on men, they are not interested in politics or the government and they are antipathetic about conflict. Furthermore, women have not become politicised not only because of lower political interest and knowledge but also because there is a well rooted/practical socio-political culture in the society which asserts that politics is “a man’s job”. Additionally, with increased age, the number of people who said they researched the candidates/parties increased. From this perspective, we can say that with age, the will to conduct thorough research and make informed choices about parties and candidates increases as well. As the education level decreases, the number of voters who said they had done very little (21.7% of illiterate voters, 19.5% of primary school graduates, 16% of high school graduates and 14.4% of university and post graduates) or no research at all (47.8% of illiterate voters, 25.2% of primary school graduates, 16% of high school graduates and 17.8% of university and post graduates) increased.
On this point, Sears (1987: 234) asks “whether the political human (homo-politicus) is a rational, consistent and informed person who is affected by fixed choices and values and is sensitive to external realities, or; an uninformed, irrational and inconsistent person who has nothing to do with today’s realities and is easily affected by prejudices and an achronical preference.” So, the answer to this question/problem is – partially – hidden in the finding that suggests with education, the will to conduct thorough research on parties and candidates before elections increases as well. Indeed, we can say that as their level of education increases, voters become more sensitive, rational, consistent and informed. As the income level decreases, the percentage of those who conduct little (18.3% of those who make 500 TL or less in a month, 16.8% of those who make between 501 TL and 1500 TL in a month and 2.2% of those who make more than 1500 TL in a month) or no research (25% of those who make 500 TL or less in a month, 19.7% of those who make between 501 TL and 1500 TL in a month and 13.3% of those who make more than 1500 TL in a month) on the candidates or the parties increases. In light of this information, we can say that as the level of income increases, the importance attached to voting decreases but the tendency to research the candidates and parties before elections increases. This contrast can be read as follows: while for low income voters who are, in colloquial language “struggling to earn a living”, politics is a hobby and engaging in politics is a luxury, their vote has the potential to save them from the current challenges.
The Relationship between Level of Participation in Local Elections and Conducting Research before Elections
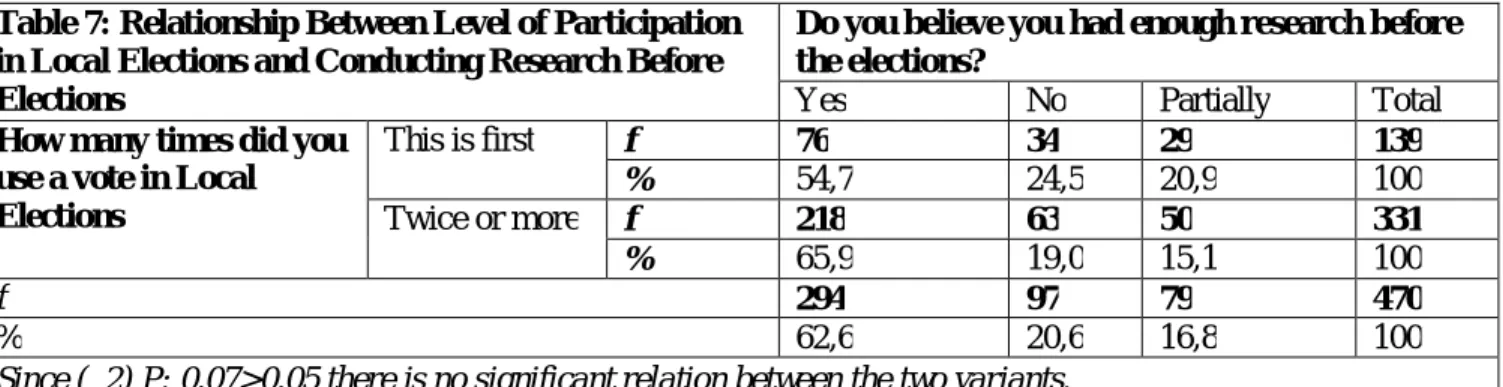
Table 7: Relationship Between Level of Participation in Local Elections and Conducting Research Before Elections
Do you believe you had enough research before the elections?
Yes No Partially Total
How many times did you use a vote in Local Elections This is first f 76 34 29 139 % 54,7 24,5 20,9 100 Twice or more f 218 63 50 331 % 65,9 19,0 15,1 100 f 294 97 79 470 % 62,6 20,6 16,8 100
Since (2) P: 0,07>0,05 there is no significant relation between the two variants.
65.9% of voters who had voted at least twice or more in their lives and 54.7% of those who voted for the first time said they researched the parties and candidates before elections, whereas 24.5% of first time voters and 19% of voters who had participated in elections twice or more said they did not conduct enough research on the candidates/parties. From this viewpoint, we can say that the more experienced the voter is, the higher their will to research before elections.
The Relationship between the Importances Attached to Local and General Elections and Conducting Research before Elections
Table 8: The Relationship Between the Importance Attached to Local and General Elections and Conducting Research Before Elections
Do you believe you had enough research before the elections?
Yes No Partially Total
C an yo u c om p ar e th e im p or tan ce you at tac h t o L oc al a n d G en er al E le ct ion
s Local Elections are more important f 43 12 17 72
% 59,7 16,7 23,6 100,0
General Elections are more important f 91 24 18 133
% 68,4 18,0 13,5 100,0
I do not care for either of them f 2 8 0 10
% 20,0 80,0 ,0 100,0
They are both equally important f 154 44 43 241
% 63,9 18,3 17,8 100,0
I have no idea f 4 9 1 14
% 28,6 64,3 7,1 100,0
f 294 97 79 470
% 62,6 20,6 16,8 100,0
Since (2) P: 0, 00<0, 05 there is a significant relationship between the two variants.
68.4% of those who said general elections were more important; 63.9% of those who said both elections were equally important; 59.7% of those who said local elections were more important and 28.6% of those who said they had no idea and 20% of those who said they did not care for either elections said they had done a research on the party and the candidates and were using an informed vote. It is interesting that those who attached greater importance to general elections had more research on parties before the elections. 23.6% of those who said local elections were more important; 17.8% of those who said both elections were equally important; 13.5% of those who said general elections were more important and 7.1% of those who said they had no idea made some research before the elections and thought that they were informed when voting. 80.0% of those who did not care for either elections; 64.3% of those who said they had no idea; 18.3% of those who said both elections were equally important; 18.0% of those who said general elections were more important; 16.7% of those who said local elections were more important said they did not make any research before the elections and did not think their votes were well informed.
Relationship between the Importances Attached to Voting and Conducting Research before Elections Table 9: Relationship between the Importance
Attached to Voting and Conducting Research Before the Elections
Do you believe you had enough research before the elections?
Yes No Partially Total
Th e V ot e I w il l u se i s ve r y im p or tan t fo r m e, for m y c ou n tr y an d fo r d e m o c rac y I strongly agree f 207 46 50 303 % 68,3 15,2 16,5 100,0 I agree f 58 22 18 98 % 59,2 22,4 18,4 100,0 I have no idea f 7 10 2 19 % 36,8 52,6 10,5 100,0 I disagree f 11 3 3 17 % 64,7 17,6 17,6 100,0 I strongly disagree f 13 16 6 35 % 37,1 45,7 17,1 100,0 f 296 97 79 472 % 62,7 20,6 16,7 100,0 Since (2
) P: 0,00<0,05 there is a significant relationship between the two variants
While 66.1% of those who thought their votes were valuable for themselves, for their country and for democracy said they researched the parties/candidates, 46.2% of those who thought their votes were not important said they thought they had enough information on the elections. On the other hand, while 36.5% of those who did not think their votes were important said they never researched the parties and candidates, 17% of those who thought their votes were important said they did not research the candidates/parties before the elections. According to this those who value their votes have a higher tendency and will to conduct research on the parties/candidates before elections. In other words, those who value their votes conduct more researches on the parties/candidates before the elections than those who do not value their votes.
Relationship between Voters Belief in the Success of Their Party in the Elections and Conducting a Research before the Elections
Table10: Relationship Between Voters Belief in the Success of Their Party in the Elections and Conducting a Research Before the Elections
Do you believe you had enough research before the elections?
Yes No Maybe Total
Would you still vote for the same party without any hesitation even when you knew they had no chance of winning in the elections?
Yes f 213 64 51 328 % 64,9 19,5 15,5 100,0 No f 71 23 22 116 % 61,2 19,8 19,0 100,0 No idea f 11 11 5 27 % 40,7 40,7 18,5 100,0 f 295 98 78 471 % 62,6 20,8 16,6 100,0
Since (2) P: 0, 07>0, 05 there is not a significant relationship between the two variants.
Of the emotional voters who said they would still vote for the same party even if that party had no chance of winning the elections, 64.9% said they had conducted a research on parties and candidates while 15.5% said they had some research and 195% said they had not conducted any research and thus that their votes were not informed. Of rational voters who said they would not vote for the same party if that party had no chance of winning the elections, 61.2% said they had conducted a research and used an informed vote whereas 19.0% said they had conducted some research and 19.8% said they had not conducted any research at all. Of those who said they did not know whether they would still vote for the same party if that party had no chance of winning the elections 40.7% said they had conducted a research on parties and candidates; 18.5% said they had conducted some research and 40.7% said they had not conducted any research. Voters’ devotion to their party and their commitment to elections with informed votes are two independent variants. There are no relationships between these two variants. According to the Chi Square test used in this study, since (2) P: 0, 07>0, 05 there is not a
2.3.7. The Most Important Factor(s) Influencing Voters’ Political choices
Table 11: The Most Important Factor(s) Influencing Voters’ Political Choices What was the most important factor that influenced your political preference in the local
elections?
f %
My political views and compliance with my ideology 136 28,7
Candidates previous activities and actions 102 21,5
Image of the candidate 80 16,9
The fact that his/her party was a political party that I relate to, that I feel committed to 56 11,8
The fact that the candidate knew the problems of the town/province 38 8,0
Party cadres and their projects 33 7,0
The fact that the candidate’s party was in power 26 5,5
Other 3 ,6
Total 474 100
A large portion of voters, as high as 28.7%, said the most important factor that influenced their preferences in local elections was the political view and ideology of the candidate. From this viewpoint, political ideology is crucial in local elections. For 21.5% of voters the candidate mayor’s former practices; for 16.9% the candidate’s image; for 11.8% their psychologic identification with the party; for 8% the candidate’s familiarity with local problems; for 7% the candidate’s party group; and for 5.5% the fact that the candidate’s party is in power, is important when voting in local elections.
Table 12: Importance of the Relationship between the Ideology of the Supported Candidate and Its Compliance with the Party Line
Does the candidate you support comply with the party line and ideology of the party s/he represents?
f %
Yes 360 75,3
No 53 11,1
Some 65 13,6
Total 478 100
When asked if “the candidate they supported was in compliance with the line and ideology of the political party s/he represented”, with 75.3% a significant majority of the voters said their candidate was in compliance with the line and ideology of his/her party; 11.1% said s/he was not in compliance; and 13.6% said s/he was partially in compliance. As a result, the ideology of candidates supported by almost three quarters of the voters reflected the line of the party s/he was representing. So, compliance between the political view of the supported candidate and the line of his/her party is an important factor that influences voter’s preferences.
Relationship between Gender and the Most Important Factors Influencing Political choices
Table 13: Relationship between Gender and the Most Important Factors Influencing Political choices
What is the most important factor that influences your preference in the local elections?
Im age o f th e ca nd id at e P ol it ic al i d eo logy o f th e ca nd ida te F or m er a ct io ns of t he c and ida te T he f ac t tha t h is /h er pa rt y is a pol it ic al pa rt y th at I ps yc hol ogi ca ll y ide nt if y m y se lf w it h P ar ty ca d re s and p roj ec ts T he f ac t tha t the c and ida te ’s pa rt y i s in pow er T he f ac t tha t the c and ida te know s the t ow n’ s/ p rov in ce ’s pr ob le m s w el l O the r T ot al Gender Women f 24 45 41 21 13 12 15 0 171 % 14,0 26,3 24,0 12,3 7,6 7,0 8,8 ,0 100 Men f 55 90 61 34 20 14 23 3 300 % 18,3 30,0 20,3 11,3 6,7 4,7 7,7 1,0 100 Total f 79 135 102 55 33 26 38 3 471 % 16,8 28,7 21,7 11,7 7,0 5,5 8,1 ,6 100
Of female voters, 26.3% said it was the candidate’s political ideology that influenced their political choices; for 24% it was the candidate’s former actions; for 14 % it was the candidate’s image; for 12.3% it was their psychologic identification with the candidate’s party; for 8.8% it was candidate’s knowledge of town’s/province’s problems; for 7.6% it was the party cadre and projects, and for 7% it was the fact that the candidate’s party was in power. On the other hand, of male voters, 30% said it was the candidate’s political ideology that influenced their political choices; for 20.3% it was the candidate’s former actions; for 18.3% it was the candidate’s image; for 11.3% it was their psychologic identification with the candidate’s party; for 7.7% it was candidate’s knowledge of town’s/province’s problems; for 6.7% it was the party cadre and projects, and for 4.7% it was the fact that the candidate’s party was in power. This shows that for men the political ideology and image of the candidate are more important that they are for women. Meanwhile, for women the candidate’s former actions and his/her knowledge of the town’s/province’s problems; the fact that his/her party is in power; their psychological attachment to the candidate’s party and party’s cadres and projects are more important than they are for men. But although there is a difference in percentages, it is not a significant difference. Additionally, no significant difference was identified between age and the most important factor that influences voters’ political choices.
Relationship between Monthly Income and the Most Important Factor That Influences Political choices Table 14- Relationship between
Monthly Income and the Most Important Factor that
Influences Political choices
What is the most important factor that influence your preference in the local elections?
Im a g e o f th e c a n d id a te P o li ti c a l id e o lo g y o f th e c a n d id a te F o rm e r a c ti o n s o f th e c a n d id a te T h e fa c t th a t h is /h e r p a rt y i s a p o li ti c a l p a rt y t h a t I p sy c h o lo g ic a ll y id e n ti fy m y se lf w it h P a rt y c a d re s a n d p ro je c ts T h e fa c t th a t th e c a n d id a te ’s p a rt y i s in p o w e r T h e fa c t th a t th e c a n d id a te k n o w s th e to w n ’s /p ro v in c e ’s p ro b le m s w e ll O th e r T o ta l Monthly Income 500TL and lower f 21 60 34 22 6 7 11 1 162 % 13,0 37,0 21,0 13,6 3,7 4,3 6,8 ,6 100 501-1500 f 50 57 50 26 20 14 20 2 239 % 20,9 23,8 20,9 10,9 8,4 5,9 8,4 ,8 100 1501 and above f 7 12 11 4 4 2 6 0 46 % 15,2 26,1 23,9 8,7 8,7 4,3 13,0 ,0 100 Total f 78 129 95 52 30 23 37 3 447 % 17,4 28,9 21,3 11,6 6,7 5,1 8,3 ,7 100
Since (2) P: 0,26>0,05 there is not a significant relation between the two variants
8.7% of those who make 1501 TL and more per month; 10.9% of those who make between 500 and 1500 TL and 13.6% of those who make 500 TL and lower said the most important factor for them was their long affiliation with the candidate’s party. For 3.7% of those who make less than 500TL per month; 8.4% of those who make between 501 and 1500 TL; and 8.7% of those who make more than 1500 TL per month, the most important factor was party cadres and projects. It was the candidate’s good knowledge of the town’s /province’s problems for 6.8% of those who make less than 500TL per month; 8.4% of those who make between 501 and 1500 TL; and 13% of those who make more than 1500 TL per month. According to this data, as the level of income increases, the percentage of those who thought candidate’s good knowledge of the town’s/province’s problems and party cadres and projects were the most influential factors increases. On the other hand, as the level of income increases, the percentage of those who tend to vote for the same party in every elections decrease.
Relationship between the Occupation and The Most Important Factor Influencing Political choices Table 14: Relationship between the Occupation and
the Most Important Factor Influencing Political choices
What is the most important factor that influences your preference in the local elections? Im a g e o f th e c a n d id a te P o li ti c a l id e o lo g y o f th e c a n d id a te F o rm e r a c ti o n s o f th e c a n d id a te T h e fa c t th a t h is /h e r p a rt y i s a p o li ti c a l p a rt y t h a t I p sy c h o lo g ic a ll y i d e n ti fy m y se lf w it h P a rt y c a d re s a n d p ro je c ts T h e fa c t th a t th e c a n d id a te ’s p a rt y i s in p o w e r T h e fa c t th a t th e c a n d id a te k n o w s th e t o w n ’s /p ro v in c e ’s p ro b le m s w e ll O th e r T o ta l
Occupation Private Sector f 20 32 24 10 9 6 8 0 109
% 18,3 29,4 22,0 9,2 8,3 5,5 7,3 ,0 100 Public Sector f 13 17 22 10 6 3 8 2 81 % 16,0 21,0 27,2 12,3 7,4 3,7 9,9 2,5 100 Unemployed4 f 35 75 51 28 17 13 17 1 237 % 14,8 31,6 21,5 11,8 7,2 5,5 7,2 ,4 100 Retired f 7 8 4 7 0 1 4 0 31 % 22,6 25,8 12,9 22,6 ,0 3,2 12,9 ,0 100 Total f 75 132 101 55 32 23 37 3 458 % 16,4 28,8 22,1 12,0 7,0 5,0 8,1 ,7 100
Since (2) P: 0, 55>0, 05 there is not a significant relation between the two variants.
22.6% of the retired participants, 18.3% of private sector workers, 16% of public sector workers and 14.8% of unemployed participants, the image of the candidate were the most influential factor. It was the political ideology of the candidate for 31.6% of unemployed participants; 29.4% of private sector workers; 25.8% of retired participants and 21% of public officers. Candidate’s former actions/projects were the most influential factor for 27.2% of public officers; 22% of private sector workers; 21.5% of the unemployed and 12.9% of the retired participants. Meanwhile, voters’ long affiliation with the candidate’s party was the most influential factor for 22.6% of the retired participants; 12.3% of public servants; 11.8% of the unemployed and 9.2% of private sector workers. Party cadre and party projects were the most influential factor for 8.3% of the private sector workers; 7.4% of the public servants; 7.2% of the unemployed, and; 0% of the retired participants. Meanwhile 5.5% of the unemployed; 5.5% of private sector workers; 3.7% of public servants, and; 3.2% of the retired participants thought the most influential factor was candidate’s party being in power. Candidate’s good knowledge of the town’s/province’s problems was the most influential factor for 12.9% of the retired; 9.9% of the public servants; 7.3% of the private sector workers and 7.2% of the unemployed participants. These figures show that the most influential factor for the private sector workers was the party cadres and projects; for the public servants it was former actions of the candidate; for the unemployed it was the political ideology of the candidate and for the retired, it was the image of the candidate, his/her good knowledge of the town’s/province’s problems and their psychologic connection to the candidate’s party.
Relationship between Education and the Most Important Factor Influencing Political choices Table 15: Relationship
Between Gender and the Most Influential Factor Influencing Political choices
What is the most important factor that influence your preference in the local elections?
Im age o f th e ca nd id at e P ol it ic al i d eo logy o f th e ca nd ida te F or m er a ct io ns of t he ca nd ida te T he f ac t tha t h is /h er pa rt y is a pol it ic al pa rt y th at I ps yc hol ogi ca ll y ide nt if y m ys el f w it h P ar ty ca d re s and p roj ec ts T he f ac t tha t the c and ida te ’s pa rt y i s in pow er T he f ac t tha t the c and ida te know s the t ow n’ s/ p rov in ce ’s pr ob le m s w el l O the r T ot al Education Level Primary School f 28 41 20 21 11 14 13 0 148 % 18,9 27,7 13,5 14,2 7,4 9,5 8,8 ,0 100,0 High School f 23 28 29 15 8 5 8 3 119 % 19,3 23,5 24,4 12,6 6,7 4,2 6,7 2,5 100 Bachelor and Post Graduate f 27 67 51 20 14 6 16 0 201 13,4 33,3 25,4 10,0 7,0 3,0 8,0 ,0 100 Total f 78 136 100 56 33 25 37 3 468 % 16,7 29,1 21,4 12,0 7,1 5,3 7,9 ,6 100
Since (2) P: 0, 01<0, 05 there is a significant relation between the two variants.
The most influential factor for 13.5% of primary school graduates, 24.4% of high school graduates and 25.4% of bachelors and postgraduates was the candidate’s former actions. Furthermore, 10% of bachelors and postgraduates, 12.6% of high school graduates and 14.2% of primary school graduates thought their long support to the candidate’s party was the most influential factor in their political choices. According to this, as the level of education increases, percentage of people who attach importance to the candidate’s former actions and who tend to always vote for the same party decreases.
Conclusion
Literature talks about three important factors that influence voters’ political choices: sociologic, rational and the theory of psychologic identification with the party. According to this, when making a choice, the voter can benefit from sociologic factors such as collective and social links; due to emotional links developed since childhood, the voter can identify himself/herself with a political party; or make a choice by rationally examining the subject matter and provided services in line with his/her own interests. In this study, the researcher had some findings on the factors that influence voters’ political choices and the extent of their influence. Following analyses were drawn from these findings: While 27.9% of the voters thought the general elections were more important, only 15.3% said local elections were more important. It is possible that the strong central governance in Turkey; the perception that the general elections are about Turkey’s general issues, and; the belief that the body that will govern Turkey is determined only in general elections might have caused people to attach greater importance to the general elections. This is an important research question because even something as simple as not being aware of the importance of local elections which will produce solutions to local problems introduces a dead-end for politics.
From a socio demographic perspective, people who are young, who have higher education and income levels and who are first time voters attach a greater importance to the general elections. On the other hand, for people who are older, who have voted more than once before and whose education and income levels are low, local elections are more important. For about one out of every ten voters, his/her vote means nothing to him/her, to his/her country or to democracy. As the level of education and income increases though, the number of people who value their vote decreases and as the level of education and income decreases, the number of people who say they have no idea about whether their vote is important increases. A significant portion of voters, as high as 48.4%, conducts little or no research before elections. When compared by gender, it is observed that man, those who value their vote and those who had voted more than at least once before, research about elections more than the women, those who do not value their vote and those who are first time voters. However, with increased age, education and income levels, the desire to research candidates/parties before elections increases as well. The largest portion of the voters, 28.7%, said the ideology of the candidate was the most influential factor on their preferences in local elections.
In addition to this, for voters the most important factors are, respectively: candidate’s former actions; his/her image; their psychological attachment to the candidate’s party; candidate’s good knowledge of local problems; candidate’s party’s projects and cadres; and candidate’s party’s being in power. Men care more about the political ideology and the image of the candidate whereas women attach greater importance to the candidate’s former activities; his/her knowledge of local problems; his/her party’s being in power; their psychological attachment to the candidate’s party and; that party’s cadres and projects. As the level of income increases, percentage of those who say the most influential factor on their political choices is party cadres and projects and the candidate’ knowledge of local problems increases while the percentage of those who say their long standing support to the political party matters the most decreases. In terms of participants’ occupation, for those who work in private sector, party’s cadres and projects; for public servants, the candidate’s former activities; for the unemployed the candidate’s political ideology and for the retired, the candidate’s image, his/her good knowledge of local problems and their psychological attachment to the candidate’s party was the most important factors influencing their political choices. In terms of education, as the level of education increased the percentage of those who care about the candidate’s former activities increased whereas the percentage of those who care whether the candidate’s party is in power and the percentage of those who tend to always vote for the same party decreased. A very large portion of the voters, as high as 69.2%, said they would still vote for their candidate/party although they had no chance of winning while 25.2% said they would not support a party and/or candidate that has no chance of winning. The fact that a single factor influences the decisions and preferences of one out of every four voters, relatively, demonstrates the importance of Bandwagon effect. Socio demograhically, women, young people and people with lower income levels have a greater tendency to vote for their candidate even though s/he does not have a chance of winning (Bandwagon effect is less). On the other hand, men, older people and people with lower education levels have a greater tendency to support the winning party (Bandwagon effect is more).
Bibliography
Akdoğan, Yalçın (2008), Yerel Siyaset-Kavramlar, Yerel Siyaset, 1. Baskı, Okutan Yayınları, İstanbul.
Alkan, Türker, Ergil Doğu (1980), Siyaset Psikolojisi, Siyasal Toplumsallaşma ve Yabancılaşma, Turhan Kitabevi, Birinci Baskı, Ankara
Anık, Cengiz (2000), Siyasal İkna, Vadi yayınları, Ankara.
Aydın, A. Hamdi (2008), Toplumsal Güvenlik ve Yerel Siyaset, Yerel Siyaset, 1. Baskı, Okutan Yayınları, İstanbul.
Barber, Benjamin (1995), Güçlü Demokrasi, Yeni Bir Çağ İçin Katılımcı Siyaset, Çev: Mehmet Beşikçi, Ayrıntı Yayınları, İstanbul.
Bilgin Nuri (2005), Siyaset ve İnsan, Siyaset Psikolojisi Yazıları, Bağlam Yayınları, İstanbul.
Çukurçayır, Akif (2008), Yerel Demokrasi ve Yerel Siyaset, Yerel Siyaset, 1. Baskı, Okutan Yayınları, İstanbul. Dursun, Davut (2008), Demokratik Siyasal Kültürün Gelişmesinde Yerel Yönetimler, Yerel Siyaset, 1. Baskı,
Okutan Yayınları, İstanbul.
Habermas, Jürgen (2012), “Öteki” Olmak, “Öteki”yle Yaşamak, Siyaset Kuramı Yazıları, Çev: İlknur Aka, Yapı Kredi Yayınları, İstanbul.
Heywood, Andrew (2014), Siyaset Teorisine Giriş, Çev: Hızır Murat Köse, 1. Baskı, Küre Yayınları, İstanbul. http://www.tbmm.gov.tr/anayasa/anayasa_2011.pdf
Kapani, Münci (2009), Politika Bilimine Giriş, Bilgi Yayınevi Yayınları, Ankara. Kışlalı, Ahmet Taner, (2010), Siyaset Bilimi, İmge Kitabevi Yayınları, Ankara.
Kurtbaş, İhsan (2013), Etnosantrizm ve Ötekileştirme Perspektifinde Siyasal Eğilimler, Ardahan İli Örneğinde Oy Verme Davranışına Etki Eden Faktörler, Yayımlanmamış Doktora Tezi, Elazığ.
Önder, M. Fahrettin (2008), Kentli Hakları ve Yerel Siyaset, Yerel Siyaset, 1. Baskı, Okutan Yayınları, İstanbul. Özel, Mehmet, Veysel Eren, İnal Emin (2009), Yerel Siyaset ve Yerel Halkın Belediye Hizmetlerine Bakışı, Yerel Hizmetlerden
Memnuniyet Düzeyi Üzerine Bir Araştırma, Alanya İşletme Fakültesi Dergisi, Sayı: 1, Cilt: 1, SS:33-50, Alanya.
Özer, İnan (2004), Kentleşme, Kentlileşme ve Siyasal Değişme, Ekin Kitabevi, Ankara.
Roskin Michael, G., Robert L. Cord, James A. Medeiros, Walter S. Jones, (2013), Siyaset Bilimi, Çev: Atilla Yayla, 1. Baskı, Adres Yayınları: Ankara.
Tokgöz, Oya (2008), Siyasal İletişimi Anlamak, İmge Kitabevi, Ankara. Türköne, Mümtaz’er (2012), Siyaset, Etkileşim Yayınları, İstanbul.
www.mevzuatbankasi.com/portal/doviz_kurlari/doviz_kurlari_liste.asp?doviz_id=1&doviz_yil=2009&doviz_ay=3
Yaşın, Cem (2006), Siyasal Kampanyada Bütüncül Yaklaşım. Selçuk Üniversitesi Sosyal Bilimler Enstitüsü Dergisi, Sayı: 15, Ss: 631-650, Konya.