Turkish Journal of Fisheries and Aquatic Sciences 12: 429-434 (2012)
www.trjfas.org ISSN 1303-2712 DOI: 10.4194/1303-2712-v12_2_33
© Published by Central Fisheries Research Institute (CFRI) Trabzon, Turkey in cooperation with Japan International Cooperation Agency (JICA), Japan
Assessment of Food Supply of Small Pelagic Fish in the Black Sea Based on
Their Lipid Content
Introduction
The most abundant small pelagic forage fishes, anchovy Engraulis encrasicolus ponticus and sprat Sprattus sprattus phalericus, are the key fish species in Black Sea food web. They are important grazers of zooplankton and a main food resource for top predators (dolphins, spiny dogfish, mackerel, whiting, turbot etc). Their early life stages are components of the diet of horse-mackerel and predatory zooplankton (Prodanov et al., 1997). Massive populations of anchovy and sprat display strong fluctuations depending on environmental conditions. Food supply is one of the most important conditions determining the population size of small pelagics (Nikolsky, 1965). In theory, the definition of ‘food supply’ implies the amount and nutritional value of food, the number of all consumers including competitors, and specific feeding conditions. These include among others the temperature and transparency of water, availability and nutritional value of prey items etc (Shulman and Love, 1999).
Food supply of organisms or populations can be expressed numerically as the ratio between food consumed and food required but direct determinations of these two variables are very difficult when studying fish in nature. An indirect approach is to
evaluate fish condition that ultimately depends on quantity and quality of consumed food. Many authors proposed fat content (triacylglycerols) or total lipid content as a good indicator of the fish nutritional condition (Håkanson, 1989; Lasker, 1970; Shulman, 1974; Garcia-Franco et al., 1999; Marshall et al., 1999; Shulman and Love, 1999; Orlova et al., 2010 and others). However, few publications used the lipid-based indicators with emphasis on estimation of long-term variability in food supply of fish.
The objective of this research was to determine the nutritional condition of these fish over the past decade compared to earlier historical data. The long-range goal is to develop a method for forecasting the fish stocks nutritional condition and hence, food supply. A long-term data series (1960 to present) of lipid accumulation in sprat populations provides a rich resource for retrospective data analyses of the fish condition which are thought to be driven by anthropogenic effects and climatic impact. Evidential links between the condition of the sprat and the environmental characteristics of the Black Sea have been found (Shulman et al., 2005), and initial attempts to predict probable changes in the nutritional condition of sprat have been made (Nikolsky and Shulman, 2005; Nikolsky et al., 2009).
Victor Nikolsky1,*, Georgiy Shulman1, Alla Shchepkina1, Tatjana Yuneva1, Levent Bat2, Yalçin Kaya2, Ahmet Kideyş3
, Kadir Seyhan4
1
Institute of the Biology of the Southern Seas, 2 Nakhimov av., 99011, Sevastopol, Ukraine.
2
Sinop University, Fisheries Faculty, 57000 , Sinop, Turkey.
3
Institute of Marine Sciences, Middle East Technical University, Erdemli, Mersin, Turkey.
4
Karadeniz Technical University, Faculty of Marine Sciences, 61530, Trabzon, Turkey.
* Corresponding Author: Tel.: +380.692 544110; Fax:+380.692 557813; E-mail:
Received 15 March 2012 Accepted 29 June 2012 Abstract
Total lipids in anchovy and sprat were measured and interpreted as indicators of their nutritional condition and food supply for the period 2005 to 2010. High lipid content in anchovies suggested that they were able to found sufficient food and favorable environmental condition supporting their stock biomass on a certain level which was strongly limited by heavy fishing. Wide inter-annual fluctuations in anchovy landings could be caused by variability in yearly recruitment and due to shifts in the spatial distribution patterns of the exploited stock. Unlike anchovy, lipid reserves in sprat declined remarkably to the lowest levels recorded during the 50-year observations period. Such a significant worsening in sprat nutritional condition followed the evident warming of the Black Sea and coincided with a sharp decline in sprat catches off Crimea. Thus, the deterioration of food supply together with intensive fishing could have contributed to the reduction of that local sprat stock. Keywords: Anchovy, sprat, water temperature, stock biomass.
To monitor inter-annual changes in fish nutritional condition, anchovy and sprat had been examined at the end of their feeding periods (June-July for sprat and October-November for anchovy) between 2005 and 2010. The techniques of sampling and determination of lipid content in small pelagic fish had been explicitly described earlier (Shulman et al., 2005). Specimens (not less than 100 fish) were sampled from each catch. Fish were sized at 5 mm intervals, and then every size group was separately homogenized. About 10–15 g of homogenate was dried at 100–105°C to a steady weight. Lipid content of fish was estimated using the relationship between total lipid and dry matter contents (Nikolsky et al., 2009). An average weighted value was calculated then for each sample by equation:
k i ix n N X 1 1 ,where ni is number of fish in size group i, xi is
lipid content in size group i, k is number of size groups, and N is number of all fish analyzed. Then the lipid content indicator (LCI) was calculated as a simple arithmetic mean of all samples collected each year. The food supply index (FSIt) was calculated as
the difference between the lipid content attained by fish at the end of feeding in a certain year (LCIt) and
average lipid content (LCI)deducted from data of the same period obtained over many years and normalized by standard deviation (SD):
SD LCI LCI FSIt t
± SD, the FSI does not exceed ± 1, and the food supply of the population is considered adequate; at FSI <–1, it is inadequate. In this way, the FSI values for all population and for different size groups were estimated.
Results
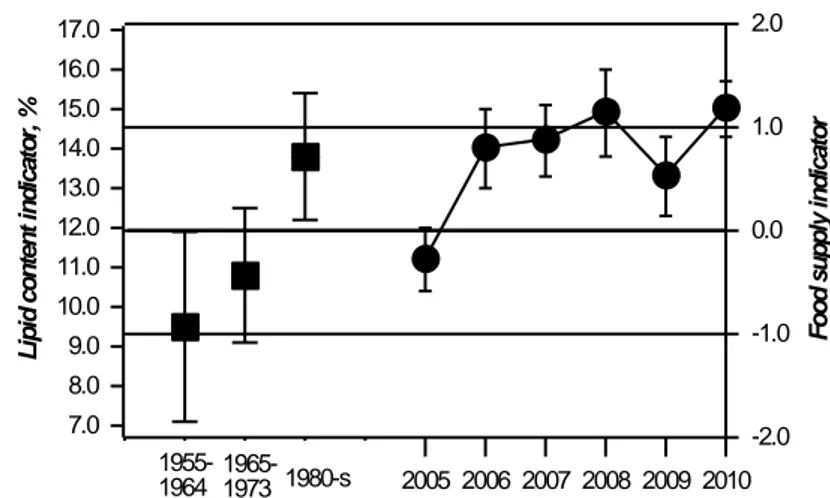
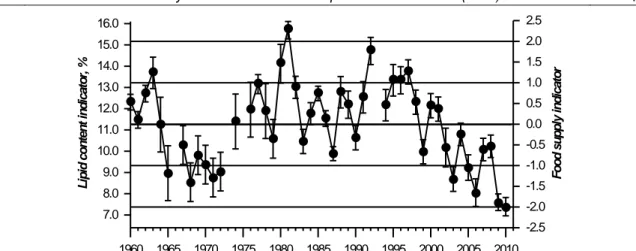
During six years of the study period, amount of lipids in anchovy in October-December ranged from 11.6% to 15.0% of wet mass. Minimal LCI was observed in 2005 while its maximums were recorded in 2008 and 2010 (Figure 1). On average, it equaled to 13.8% that was greater than its long-term value and close to the best nutritional condition observed in 1980-s. In contrast to anchovy, lipid reserves in sprat declined remarkably to the lowest level that had never been recorded during the 50-year long observations (Figure 2). The drop in lipid content of sprat was related to deterioration of food supply and associated with the sea warming. It was expected by the predictive model (Nikolsky et al., 2009) which also assumed the lowest LCI for the next year (Figure 3).
An additional indicator of food availability is the age-dependent content of the lipid stores in the fish (Shulman and Love, 1999). Under normal feeding conditions, elder fish accumulate more lipids than younger ones. In years when food is plentiful, the lipid content is greater and the relationship between fish fatness and age is more pronounced. And vice versa, when feeding conditions are poor, the relationship with age becomes inverted (Shulman, 1974). Validation of this general rule is confirmed by the relationship between size and lipid content of sprat based on all monitoring data (Figure 4). However, the examined fish demonstrated significant differences in their nutritional condition depending on
2000 2001 2002 2003 2004 2005 2006 2007 2008 2009 2010 7.0 8.0 9.0 10.0 11.0 12.0 13.0 14.0 15.0 16.0 17.0 L ip id c o n te n t in d ic a to r, % -2.0 -1.0 0.0 1.0 2.0 F o o d s u p p ly i n d ic a to r 1980-s 1955-1964 1965-1973
Figure 1. Lipid content (% wet mass, left axis) accumulated by anchovy at the end of feeding period (October–November) of
2005 to 2010 compared with mean values for the periods 1955 to 1973 (Shulman, 1974; Shulman and Love, 1999) and for the 1980s (Chashchin and Akselev, 1990). Horizontal lines show standard deviations (± SD and ±2 SD) from the overall long-term mean value 11.9±2.6. Right axis indicates the food supply index estimated
431
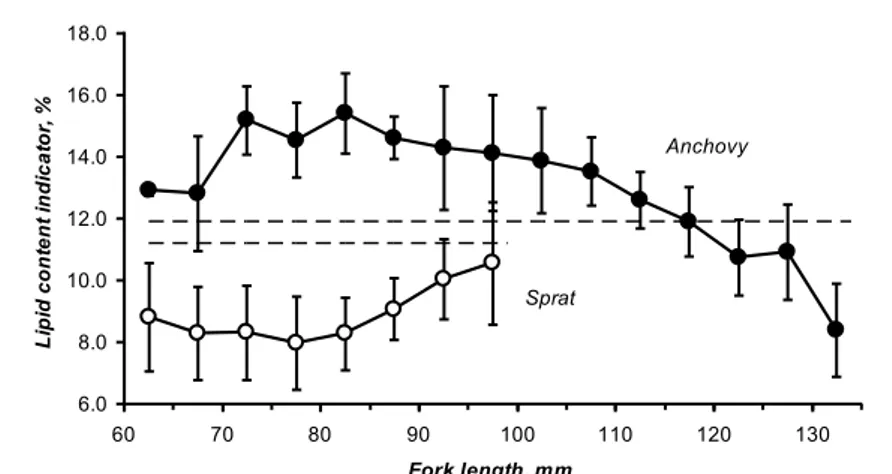
their size during 2005–2010 (Figure 5). In general, anchovies of mid sizes (80–110 mm length) were in better condition than large fish. Otherwise, sprats of mid sizes (65–80 mm length) were predominantly in worse condition compared to larger ones.
The results suggest that warm-water anchovies find quite enough food to maintain their stock
biomass on a certain level that is limited by heavy fishing. Moreover, food supply turned out more favorable for the most abundant mid-size fish but unfavorable for larger ones. Unlike anchovy, cold-water sprats experience deficiency in food required, and the most abundant mid-size sprats seem to be faced with the most unfavorable conditions.
1960 1965 1970 1975 1980 1985 1990 1995 2000 2005 2010 7.0 8.0 9.0 10.0 11.0 12.0 13.0 14.0 15.0 16.0 L ip id c o n te n t in d ic a to r, % -2.0 -1.0 0.0 1.0 2.0 -2.5 -1.5 -0.5 0.5 1.5 2.5 F o o d s u p p ly in d ic a to r
Figure 2. Variability of the sprat lipid content indicator and estimated food supply index (mean ± SE) from 1960 to 2010.
Horizontal lines show standard deviations (± SD and ± 2 SD) from the overall long-term mean value 11.2±1.9.
6.0 7.0 8.0 9.0 10.0 11.0 12.0 2002 2003 2004 2005 2006 2007 2008 2009 2010 2011 L ip id c o n te n t in d ic a to r, % 1 2 3
Figure 3. Long-term mean (1), predicted (2) and observed (3) values of sprat lipid content indicator for the period 2002 to
2010. 0.0 2.0 4.0 6.0 8.0 10.0 12.0 14.0 16.0 18.0 20.0 50 55 60 65 70 75 80 85 90 95 100 105 110 Fork length, mm Lipid content, % Jun-Jul Jan-Feb
Figure 4. Total lipid content in sprat of different sizes in winter and summer. The plot was generated using monitoring all data
Discussion
The fishery statistics data clearly show a recovering fishery of small pelagic fish after its collapse occurred between the end of the 1980s and the beginning of the 1990s. Since 1995, annual landings of anchovy in Turkey have approached levels recorded before the collapse. However, wide fluctuations in anchovy landings within the range of 100-400 thousand tons are still evident (Figure 6). Such extensive fluctuations could be caused by several reasons affecting the stock biomass such as due to variability in annual recruitment, predation or competition as well as changes in the spatial distribution pattern of parent stock.
It is known that anchovy spatial distribution during wintering depends on stored lipid reserves and is strongly controlled by the water temperature (Shulman, 1974; Chashchin and Akselev, 1990). This rule was clearly observed during the fishing season of 2005 when anchovy fatness was low and the water temperature off Crimea being higher than off the Anatolian coast (Figure 7). As a result, a considerable portion of the anchovy stock remained wintering in warmer waters off Crimea. Fishing continued there throughout the winter and even spring months while the lowest yield was recorded from Turkish waters since anchovy stocks had recovered after the collapse. A similar situation was observed in 2009: the temperature off Crimea was higher than off the Anatolian coast, lipid content in anchovy was not very high and Turkish anchovy catch decreased noticeably. On the contrary, a local peak in anchovy catch occurred in 2007 when water temperature off Crimea decreased abruptly following the destructive cyclone that happened in the north-western Black Sea in November.
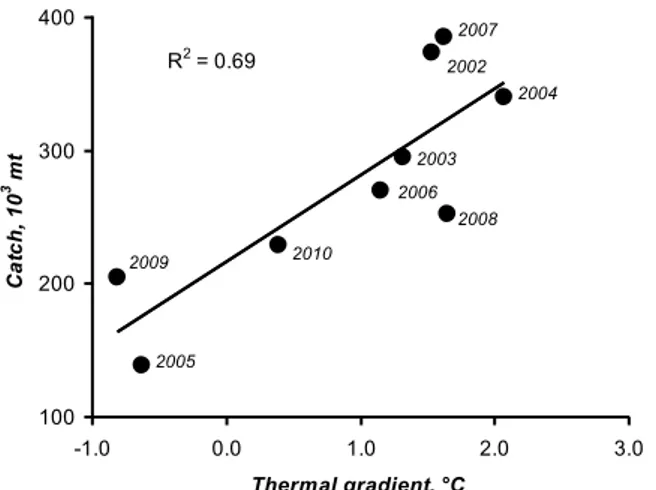
It is noticeable, that annual anchovy catches for the period of 2002 to 2009 show significant positive correlations with water temperature gradients between the two areas examined. Furthermore, the pronounced peaks in anchovy catches off Crimea occurred during
the 2002/03, 2005/04, 2007/08, and 2009/10 fishing seasons (Zuev et al., 2011) when the lowest and highest Turkish annual catches were recorded (Figure 8).
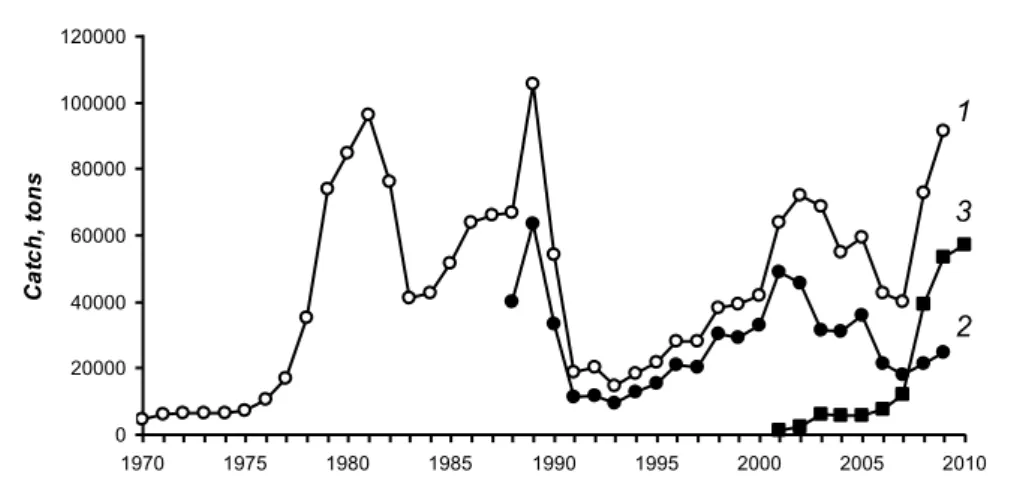
The significant decrease in sprat nutritional condition was followed by evident warming of the sea and coincided with sharp reduction in Ukrainian catches from the shelf of Crimea (Figure 9). It led to the conclusion that food abundance in the western shelf of Crimea was too low to support existing sprat stocks. Analyses of the fish stomach contents showed that sprats were lacking their main food items (cold-water copepods) and were forcing to consume zooplankton species which play a secondary role in their diet (Glushchenko, 2011). As a result, adult sprats had apparently to avoid that traditional local fishing ground. According to official statistics, fishing of sprat had developed remarkably during that same time in the south-eastern Black Sea by Turkey. Total sprat landings by all countries exceeded 91 thousand tons in 2009 and approached close to the critical maximal level of the 1980s (FAO, 2011).
Acknowledgements
The authors are grateful to their Turkish and Ukrainian colleagues whose roles in sample collection were very useful. This work was supported by TUBITAK-NASU Projects (numbers 105Y028 and 105Y341).
References
Chashchin, A.K. and Akselev, O.I. 1990. Migrations of the stocks and availability of Black Sea anchovy to the fishery to the autumn and winter. V. A. Shlyakhov (Ed.), Biological Resources of the Black Sea, VNIRO, Moscow: 80-93 (in Russian).
Garcia-Franco, W., Vidal-Talamantes, R., Cota-Villavicencio, A., Ramon-Corrales, J. and Prieto-Montalvo, I. 1999. Variation in fat content of northern anchovy (Engraulis mordax) in relation to the Baja California environment. CalCOFI Rep., 40: 165-169.
6.0 8.0 10.0 12.0 14.0 16.0 60 70 80 90 100 110 120 130 Fork length, mm L ip id c o n te n t in d ic a to r, % Sprat Anchovy
Figure 5. Variations in lipid stores of anchovy (October–November) and sprat (June–July) of different sizes. The plot was
433
Glushchenko, T.I. 2011. Nutrition and assessment of Black Sea sprat in 2009-2010. Tr. YugNIRO, 49: 34-39 (in Russian).
FAO 2011. Fishery statistics. GFCM Capture Production 1970-2009. http:// www.fao.org.
Håkanson, J.L. 1989. Analysis of lipid components for determining the condition of anchovy larvae, Engraulis mordax. Mar. Biol., 102: 143-151.
Lasker, R. 1970. Utilization of zooplankton energy by a
Pacific sardine population in the California Current. In: J.H. Steele (Ed.), Marine Food Chains, Edinburgh: 265-284.
Marshall, C.T., Yaragina, N.A., Lambert, Y. and Kjesbu, O. 1999. Total lipid energy as a proxy for total egg production by fish stocks. Nature, 402: 288-290. Nikolsky, G.V. 1965. Theory of fish stock dynamics.
Nauka, Moscow, 382 pp. (In Russian).
Nikolsky, V.N. and Shulman, G.E. 2005. The sprat fat
0 100000 200000 300000 400000 500000 600000 1970 1975 1980 1985 1990 1995 2000 2005 2010 C a tc h , t o n s 1 2
Figure 6. Total anchovy landings by all countries (1) including Turkey (2) from the Black Sea (FAO, 2011).
5.0 7.0 9.0 11.0 13.0 15.0 17.0 19.0 2005 2006 2007 2008 2009 2010 T L , % 12.0 13.0 14.0 15.0 16.0 17.0 S S T , oC 2 1
Figure 7. Inter-annual changes of lipid content (% wet mass) in anchovy body at the end of feeding period in
October-November (bars) and monthly average sea surface temperature in the Crimean (1) and Turkish (2) fishing areas. The temperatures were calculated using the NOAA/NASA satellite data.
R2 = 0.69 100 200 300 400 -1.0 0.0 1.0 2.0 3.0 Thermal gradient, °С C a tc h , 1 0 3 m t 2005 2009 2010 2006 2008 2003 2004 2002 2007
Figure 8. Turkish anchovy landings for the period 2002 to 2010 against the sea water temperature gradient between Sinop and
content variability in connection with long-term environmental changes in the Black Sea. V. Velikova and N. Chipev (Eds.), Large-scale disturbances (regime shift) and recovery in aquatic ecosystems: challenges for management towards sustainability. UNESCO-ROSTE/BAS Workshop on Regime Shifts, 14–16 June, Varna: 159-168.
Nikolsky, V.N., Yuneva, T.V., Schepkina, A.M., Bat, L., Kideys, A.E. and Shulman, G.E. 2009. Interannual changes of lipid content in the Black Sea sprat. In: G. Shulman, B. Öztürk, E. Kideyş, G. Finenko, L. Bat (Eds.), Trophic relationships and food supply of heterotrophic animals in the pelagic ecosystem of the Black Sea, Black Sea Commission Publ., Istanbul: 227-245.
Orlova, E.L., Rudneva, G.B, Renaud, P.E., Eiane, K., Savinov, V. and Yurko, A.S. 2010. Climate impacts on feeding and condition of capelin Mallotus villosus in the Barents Sea: evidence and mechanisms from a 30 year data set. Aquat. Biol., 10: 105-118.
Prodanov, K., Mikhailov, K., Maxim, K., Chashchin., A., Arkhipov, A., Shlyakhov, V. and Ozdamar, E. 1997.
Environmental management in the Black Sea and their rational exploitation. GFCM Stud. Rev., 68, FAO, Rome, 178 pp.
Shulman, G.E. 1974. Life cycles of fish. Physiology and biochemistry. Hulsted Press, John Wiley and Sons, New-York, 253 pp.
Shulman, G.E. and Love, R.M. 1999. The biochemical ecology of marine fishes. Adv. Mar. Biol., 36: 1-352. Shulman, G.E., Nikolsky, V.N., Yuneva, T.V., Minyuk,
G.S., Shchepkin, V.Ya., Shepkina, A.M., Ivleva, E.V., Yunev, O.A., Dobrovolov, I.S., Bingel, F. and Kideys, A.E. 2005. Fat content in Black Sea sprat as an indicator of fish food supply and ecosystem condition. Mar. Ecol. Prog. Ser., 293: 201-212.
Zuev, G.V., Gutsal, D.K., Goralevich, K.G., Bondarev, V.A., Murzin, U.L. and Novoselova, U.V. 2011. Intraspesific morphological, ecological and biological variability of Azov-Black Sea anchovy Engraulis encrasicolus (Pisces: Engraulidae) wintering at Crimea coastal waters. Marine ecological Journal, 10(1): 5-18 (in Russian). 0 20000 40000 60000 80000 100000 1970 1975 1980 1985 1990 1995 2000 2005 2010 C a tc h , t o n s 1 2 3
