Ankara Hacı Bayram Veli Üniversitesi İktisadi ve İdari Bilimler Fakültesi Dergisi 21/1 (2019) 37-55 e-ISSN 2667-405X
Factors Affecting the Use of Mobile Recommendation Systems: a Structural Equation Model
Erkan ARI Veysel YILMAZ
Geliş Tarihi (Received): 09.04.2019 – Kabul Tarihi (Accepted): 29.04.2019
Abstract
The main purpose of this study is to investigate attitudes and behaviors of university students towards mobile recommender systems using a proposed structural equation model (SEM). In the proposed model, expected recommendation quality of mobile recommender systems was defined as the exogenous latent variable, while perceived recommendation quality, enjoyment, collectivism, and attitude were defined as the mediating endogenous latent variables, and behavior was defined as the endogenous latent variable. To this end, the survey developed based on the literature was administered to 416 students from various faculties. The fitness of the proposed structural model was investigated based on various fitness criteria and the model fit was found to be within acceptable limits. Data analysis showed that expected recommendation quality and perceived recommendation quality were closely related and perceived recommendation quality, user enjoyment, and collectivism positively affected the attitudes of students towards mobile recommender systems. According to the results the exogenous latent variable of Expected Recommendation Quality (ERQ) positively affected Perceived Recommendation Quality (PRQ) and Enjoyment (ENJ). The path coefficient between “ERQ” and “PRQ” and between “ERQ” and “ENJ” was 0.77 and 0.64, respectively. In other words, an increase of one unit in expected recommendation quality related to mobile recommender systems led to an increase of 0.77 units in perceived recommendation quality and an increase of 0.64 units in enjoyment.
Keywords: Recommender System, Mobile Recommendation, User Behavior, Enjoyment,
Recommendation Quality, Collectivism.
Doç. Dr., Dumlupınar Üniversitesi, İktisadi ve İdari Bilimler Fakültesi, Ekonometri Bölümü, Kütahya, E-mail:
Prof.Dr., Eskişehir Osmangazi Üniversitesi, Fen Edebiyat Fakültesi, İstatistik Bölümü, Eskişehir, E-mail:
38
Mobil Öneri Sistemleri Kullanımını Etkileyen Faktörler: Bir Yapısal Eşitlik Modeli Öz
Bu çalışmanın temel amacı üniversite öğrencilerin mobil öneri sistemlerine yönelik tutum ve davranışları önerilen bir yapısal eşitlik modellemesiyle (YEM) araştırmaktır. Önerilen modelde, mobil öneri sistemlerinin beklenen öneri kalitesi, dışsal gizli değişken olarak tanımlanırken, algılanan öneri kalitesi, zevk, paylaşma, tutum aracı içsel gizil değişkenler ve davranış da içsel gizli değişken olarak tanımlanmıştır. Bu amaçla, çeşitli fakültelerinde öğretim gören 416 öğrenciye, literatürden yararlanılarak geliştirilen bir anket uygulanmıştır. Önerilen yapısal model çeşitli uyum ölçütlerine dayanarak uygunluğu araştırılmış ve sonuçta modelin kabul edilebilir sınırlar içinde kaldığı görülmüştür. Verilerin analizi sonucunda, beklenen ve algılanan öneri kalitesinin yüksek düzeyde ilişkili olduğu, algılanan mobil öneri kalitesinin, kullanıcı zevki ve paylaşmanın öğrencilerin mobil öneri sistemlerine yönelik tutumlarını olumlu yönde etkilediği belirlenmiştir. Sonuçlara göre “Beklenen Öneri Kalitesi” dışsal gizil değişkeninin “Algılanan Öneri Kalitesi” ve “Zevk” içsel gizil değişkenlerini pozitif olarak etkilediği sonucuna varılmıştır. “ERQ” ile “PRQ” ve “ERQ” ile “ENJ” değişkenleri arasındaki ilişki katsayısı sırasıyla 0,77 ve 0,64 dir. Yani öğrencilerin mobil öneri sistemlerine ilişkin beklenen öneri kalitesindeki bir birimlik artış mobil öneri sistemlerine ilişkin algılanan öneri kalitesini 0,77 birim; zevk gizil değişkenini ise 0,64 birim arttırmaktadır.
Anahtar Kelimeler: Öneri Sistemi, Mobil Öneri, Kullanıcı Davranışı, Zevk, Öneri Kalitesi,
39
Introduction
Rapid advancements in today’s technology have brought along many conveniences and innovations. Consumers frequently use internet services when shopping, traveling, and reading newspapers or books. Although consumers who meet a considerable portion of their needs in the internet environment are able to easily find what they look for, they sometimes may have difficulties in product selection due to abundance of options.
Recommender systems are applications which examine past behaviors of users and recommend suitable offerings for them. In the internet environment, these may be products on an e-commerce site as well as pages of a website. Recommender systems are often used to improve the structure of the website or to improve its performance. There are numerous methods in the literature to develop recommender systems including collaborative filtering, association rules, Markov models, bundling methods, and examination of consecutive orders. Collaborative filtering is one of the first and therefore most common methods used to develop recommender systems. In general, traditional web recommender systems make use of the collaborative filtering method to guess a specific user’s preference about a product. The assumption of “similar users like similar products” is the basic notion underlying the collaborative filtering method. The collaborative filtering method is divided into two main categories: memory-based collaborative filtering and model-based collaborative filtering.
Recommender systems are quite useful for both users and online retailers. While these systems help customers find the most appropriate option among countless products and services, they also help online retailers increase their sales. Being online increases the market share for sellers while reducing costs and creating a preferable environment for vendors. In addition to helping customers to find the product which looking for, it also provides a competitive environment for sellers (Demirkıran, 2016).
The emergence of smart phones has actually started a whole new era. Computers and the internet used to be indispensable components of our lives and we would spend countless hours in front of the computer; however, this has changed over the time with the introduction of smartphones. Computer and internet technologies are now within our palms at any time of our lives. Many applications containing recommender systems have been adopted to mobile devices with the introduction of Apple IOS and Google Android operating systems and this has made recommender systems easily available at any time.
40
Recommender systems are widely used by consumers in nowadays. The primary feature of recommender systems is that they provide personalized recommendations. Also, these systems allow consumers to see recommendations for users with similar tastes, which provides genuine advice. By doing so, recommender systems allow for communicating with other users as well. One of the reasons why consumers use mobile recommender systems is the indecision about which product would satisfy their needs the best. Using a recommender system may be one of the best solutions for consumers in this case.
A literature review shows that findings of studies on benefits of mobile recommender systems and attitudes and behaviors of users towards mobile recommender systems vary depending on beliefs and cultural values (Xu et al., 2018; Choi et al., 2014; Herlocker et al., 2004; and Choeh and Lee, 2008).
Also, studies in the literature have yielded different results related to attitudes and behaviors towards recommender systems in different countries and different cultures. The purpose of this study is to investigate attitudes and behaviors of students studying at Osmangazi University, Eskisehir towards mobile recommender systems using the proposed research model. Such a study with university students will be useful in terms of revealing the relationship between factors affecting mobile recommender system use behaviors of university students in Turkey.
1. Literature Review
In the following paragraphs there are studies on recommend systems.
Choi et al. (2014) identified the factors affecting user attitudes towards mobile recommendation systems. In addition, the authors examined how these factors affect cultural attitudes as well as technology attitudes. Based on the theory of justified action, belief factors for mobile recommendation systems are defined in three dimensions: functional, contextual and social. The research model was tested based on data collected in China, South Korea and the United Kingdom. The findings showed that functional and social factors have important effects on user attitudes towards recommendation systems.
Huang (2011) investigated whether these utility-based techniques outperform the traditional content-based technique for online recommendations. A laboratory experiment was conducted in two e-commerce contexts to compare the decomposed and holistic utility-based methods, simple multi-attribute rating technique exploiting ranks (SMARTER) and radial basis function network (RBFN), with the content-based method vector space model (VSM) in
41
terms of recommendation accuracy, time expense, and user perceptions. The results demonstrate that the performances of utility-based methods depend on recommendation contexts.
Tam and Ho (2005) revealed that users of mobile recommender systems found e-commerce sites providing personalized recommendations to be more useful than those that do not provide personalized recommendations. Kumar and Benbasat (2006) identified user attitudes towards web-based recommender systems and found that the perceived usefulness was the most affective factor on user attitudes.
2. Method 2.1. The Purpose of the Study
The study was designed with the aim of revealing the relationship between factors affecting attitudes and behaviors of students towards mobile recommender systems. To this end, the main purpose of the study was to propose a structural model to describe relationships between factors affecting attitudes and behaviors of students towards mobile recommender systems and test the proposed model based on various fitness criteria.
2.2. The Research Model and Hypotheses
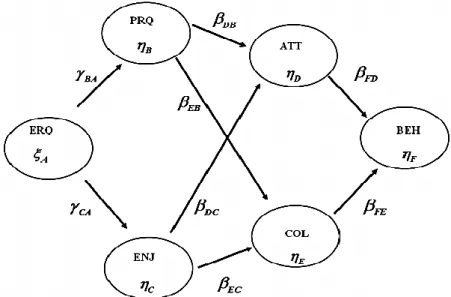
As shown in the research model given in Figure 1, expected recommendation quality of mobile recommender systems was defined as the exogenous latent variable, while perceived recommendation quality, enjoyment, collectivism, and attitude were defined as the mediating endogenous latent variables, and behavior was defined as the endogenous latent variable. In the literature, it was reported that there was a relationship ERQ and PRQ, as well as PRQ and ENJ (Lee et al., 2007; Choi et al., 2014) .The primary assumption of the model was that the expected recommendation quality would affect the perceived recommendation quality and enjoyment from mobile recommender system (MRS). Therefore:
H1: The expected recommendation quality affects the perceived recommendation quality.
H2: The expected recommendation quality affects the enjoyment from MRS.
The perceived recommendation quality of mobile recommender systems indicates their usefulness and is considered to be a significant factor affecting attitudes towards
42
information services (Xia and Benbasat 2007; Turel et al., 2006). Considering that recommendations provided to a mobile user are based on ambiguous data, recommendation services usually have poorer accuracy compared to other information services such as e-mail, web search, and news sources. When consumers believe that the results provided by the recommendation systems reflect their tastes, they help improve the recommendation systems (Natour et al., 2008). Once users receive high quality recommendations from a mobile recommender system, they develop positive attitudes towards mobile recommender systems and tend to share these systems with their acquaintances (Venkatesh, 2000; Hong and Tam, 2006). For this reason, recommendation quality becomes even more important since recommendations are expected to promote positive attitudes towards the service.
Hypotheses H3 and H4 were formed to test this assumption.
H3: The perceived recommendation quality has a positive effect on attitude towards mobile recommender systems.
H4: The perceived recommendation quality has a positive effect on collectivism related to recommender systems.
Enjoyment is defined as that, as well as performance improvement, the user may use a certain system just because he or she finds it enjoyable (Davis, 1989). Some mobile recommender systems have entertainment features such as creating personalized playlists (Apple Genius Mixes) and categorizing musical preferences of users (Music Aurora Pro). “Last.fm” produces playlists based on preferences of target users and listening history of other users. These recommendations may enable users to discover new songs. Although accuracy is one of the most significant objectives of recommendation algorithms, innovations which may bring new products or services to the attention of target users are important performance criteria for recommendation algorithms since they can provide an enjoyable experience for users (Herlocker et al., 2004). A user can enjoy functions of a recommender system and develop more positive feelings for the service in general while accumulating experiences with a recommender system (Lee et al., 2007; Xu, 2006).
Similar to the perceived recommendation quality, “enjoyment” may improve the attitude towards the mobile recommender system. The following hypotheses were formed accordingly.
43
H6: Enjoyment has a positive effect on collectivism related to mobile recommender systems.
Collectivism is related to social effects used to enable opinions and attitudes of one or more individuals to impact opinions and attitudes of others (Martin and Hewstone, 2003). Sharing recommended products with close acquaintances, knowing friends’ areas of interest, and facilitating their access to this knowledge may improve the attitude towards mobile recommender systems. Various studies have shown that social effects have an impact on user attitude towards mobile recommender systems (Choi et al., 2014; Lee et al., 2007; Al-Gahtani et al., 2007; Bandyopadhyay and Fraccastoro, 2007; and Hofstede, 2001). In our model, hypothesis H7 was suggested for the relationship between collectivism and behavior.
H7: Collectivism has a positive effect on mobile recommender system use behavior. Since it is believed that positive attitude towards mobile recommender systems would affect mobile recommender system use behavior positively, hypothesis H8 was suggested.
H8: Attitude has a positive effect on mobile recommender system use behavior.
ERQ: Expected recommendation quality; PRQ: Perceived recommendation quality; ENJ: Enjoyment; COL: Collectivism; ATT: Attitude; BEH: Behavior
Figure 1: The Research Model
The structural model proposed in this study consists of one exogenous latent variable (A: ERQ: expected recommendation quality; n=1) and 5 endogenous latent variables (PRQ: Perceived recommendation quality; ENJ: Enjoyment; COL: Collectivism; ATT: Attitude;
44
BEH: Behavior; n=5). The underlying formula of the structural model in SEM can be expressed as shown in Equation 1.
𝜂 = 𝐵𝜂 + 𝛤𝜉+ 𝜁 (1) In Equation 1; 𝜂 represents the endogenous latent variable, 𝜂∶ 𝑚𝑥1 represents the one-dimensional endogenous latent variable vector, 𝐵∶ 𝑚𝑥𝑚 represents the matrix of coefficients between endogenous latent variables whose main diagonal is zero, 𝛤∶ 𝑚𝑥𝑛 represents the matrix of coefficients between one-dimensional endogenous and exogenous latent variables, 𝜉∶ 𝑛𝑥1 represents the one-dimensional exogenous latent variable vector, 𝜁∶ 𝑚𝑥1 represents the one-dimensional latent error terms vector.
The matrix representation and structural equations for the model proposed in Figure 1 can be expressed as shown in Equation 2 and 3.
B C D E F = 0 0 0 0 0 0 0 0 0 0 0 0 0 0 0 0 0 0 0 DB DC EB EC FD FE B C D E F + 0 0 0 BA CA A + B C D E F (2) (3)
2.3. Data Collection Tool
The population of the study was made up of students studying at Eskisehir Osmangazi University in Turkey, during the 2017-2018 academic year. The measurement instrument developed based on the literature (Choi et al., 2014; Lee et al., 2007; Tam and Ho, 2005; Herlocker et al., 2004). The first section of the survey form consisted of items related to demographic characteristics of participants, items aimed at identifying internet use time and website visit frequency, while the second section consisted of items aimed at measuring participants’ expected and perceived recommendation quality, collectivism, enjoyment, and attitudes towards mobile recommender systems. In the second section, the items related to the
B BA A B C CA A C D DB B DC C D E EB B EC C E F FD D FE E F
45
factors of ERQ: Expected recommendation quality; PRQ: Perceived recommendation quality;
ENJ: Enjoyment; COL: Collectivism; ATT: Attitude were measured with a five-point Likert
scale ranging from “5: Strongly agree/1: Strongly disagree”, while the items related to the factor of BEH: Behavior was measured with a five-point Likert scale ranging from “5: Very often/1: Never”.
After preparing the questionnaire, it was administered to 464. However, 48 questionnaires were omitted due to incomplete and missing data; therefore, the analysis was conducted with 416 survey forms. A reliability analysis was performed on the survey items to reveal whether or not the variables observed via the survey method consistently reflected the measured phenomenon. The internal consistency coefficient of the survey was calculated to be CA= 0.92. It can be said that the survey items successfully reflected the desired phenomenon since this value is close to 1.
2.4. Sampling Plan
The stratified sampling method was used as the sampling type of this study. Students studying at the Faculty of Arts and Sciences, Faculty of Education, Faculty of Engineering and Architecture, and Faculty of Economics and Administrative Sciences of Eskisehir Osmangazi University, were divided into 4 strata and the proportional distribution technique was used to determine the unit number to be selected from each stratum. The sample was divided into strata using the proportional distribution technique. The necessary number of participants was found to be 89 for the first stratum (Faculty of Arts and Sciences), 57 for the second stratum (Faculty of Education), 156 for the third stratum (Faculty of Engineering and Architecture), and 82 for the fourth stratum (Faculty of Economics and Administrative Sciences). Extra 20 participants were added to each stratum to prevent data loss and the study was administered to a total of 464 participants.
46
3. Findings 3.1. Descriptive Statistics
Table 1 shows the descriptive statistics related to demographic information of the students.
Table 1: Demographic Information of Participants
As shown in Table 1, 45.2% of the participants were female (n=188) and 54.8% (n=228) were male. 32.5% of the participants were 1st year students, 32.5% second year students, 18% were 3rd year students, 13.2% were 4th year students, and 3.8% were 5th year students or above. In terms of operating system, 30.8% of the students were IOS users, 68.0% were Android users, and 1.2% were Windows Mobile users.
According to Table1, 67.3% of the students preferred social network applications, 66.1% used entertainment applications, 17.3% finance applications, 17.3% travel applications, 34.6% educational applications, 10.3% health-related applications, 50.7% news applications, and 15.6% used fashion applications on their smartphones. Considering frequency of internet
Demographic Information N % Gender Female 188 45.2 Male 228 54.8 Year 1 135 32.5 2 135 32.5 3 75 18,0 4 55 13.2 5 and above 16 3.8 Operating System IOS 128 30.8 ANDROID 283 68.0 WINDOWS MOBILE 5 1.2 Types of Application Social network 280 67.3 Entertainment 275 66.1 Finance 72 17.3 Travel 64 17.3 Training 144 34.6 Health 43 10.3 News 211 50.7 Fashion 65 15.6 Internet Use
Less than 1 hour 15 3.6
1-3 hours 162 38.9
4-5 hours 165 39.7
More than 6 hours 74 17.8 Experience Smartphone and computer 319 76.7 Only smartphone 48 11.5 Only computer 5 1.2 None 44 10.6
47
use, 3.6% of the students were on the internet for less than 1 hour per day, 38.9% were on the internet for 1-3 hours per day, 39.7% were on the internet for 4-5 hours per day, and 17.8% were on the internet for more than 6 hours per day. In terms of experience related to use of mobile recommender systems, 76.7% of the students used MRS on their smartphones and computers, 11.5% used MRS on their smartphones only, 1.2% used MRS on their computers only, and 10.6% did not experience MRS at all.
3.2. Analysis Results of the Structural Equation Model
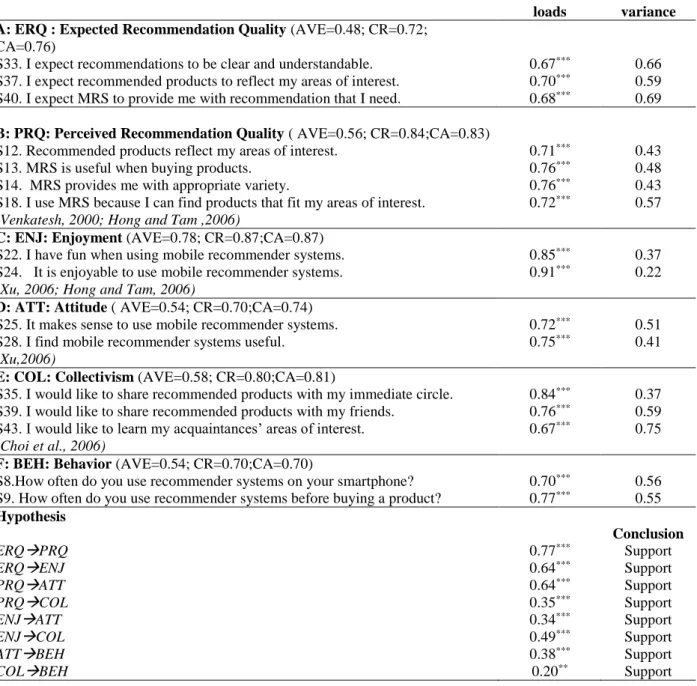
Three criteria were considered to check the convergent validity of the model. Firstly, the standardized factor loading of each observable variable belonging to the latent variables must be over 0.5 and statistically significant (Hata! Başvuru kaynağı bulunamadı.). Secondly, the Construct Reliability (CR) and Cronbach’s Alpha (CA) value for each construct must be over 0.7 (Hata! Başvuru kaynağı bulunamadı.). Thirdly, the Average Variance Extracted (AVE) must be over 0.5 for each construct (Hata! Başvuru kaynağı bulunamadı.). The convergent validity of the model was checked and it was found that the standardized factor loads varied between 0.67 and 0.91, the CR values were 0.70 and above, and lastly all of the AVE values except for one were above 0.50 (see Table 2). The AVE value for the “A: ERQ : Expected Recommendation Quality” factor was calculated to be 0.48. These results show that the model had convergent validity.
A SEM analysis was performed to measure attitudes and behaviors of the students towards mobile recommender systems. Parameter estimates for factors can be seen in Table 2. All of the hypotheses were supported according to the results of the 𝑡 test.
Table 3 shows the goodness of fit criteria for the research model, while Figure 2 and 3 show the path diagrams for the Structural Equation Model. A comparison of the proposed model and standard values shows that the results for the model were acceptable in terms of fitness.
48
Table 2: SEM Results for Research Model
Factors/items Standardized
loads
Error variance A: ERQ : Expected Recommendation Quality (AVE=0.48; CR=0.72;
CA=0.76)
S33. I expect recommendations to be clear and understandable. 0.67*** 0.66
S37. I expect recommended products to reflect my areas of interest. 0.70*** 0.59
S40. I expect MRS to provide me with recommendation that I need. 0.68*** 0.69
B: PRQ: Perceived Recommendation Quality ( AVE=0.56; CR=0.84;CA=0.83)
S12. Recommended products reflect my areas of interest. 0.71*** 0.43
S13. MRS is useful when buying products. 0.76*** 0.48
S14. MRS provides me with appropriate variety. 0.76*** 0.43
S18. I use MRS because I can find products that fit my areas of interest. 0.72*** 0.57
(Venkatesh, 2000; Hong and Tam ,2006)
C: ENJ: Enjoyment (AVE=0.78; CR=0.87;CA=0.87)
S22. I have fun when using mobile recommender systems. 0.85*** 0.37
S24. It is enjoyable to use mobile recommender systems. 0.91*** 0.22
(Xu, 2006; Hong and Tam, 2006)
D: ATT: Attitude ( AVE=0.54; CR=0.70;CA=0.74)
S25. It makes sense to use mobile recommender systems. 0.72*** 0.51
S28. I find mobile recommender systems useful. 0.75*** 0.41
(Xu,2006)
E: COL: Collectivism (AVE=0.58; CR=0.80;CA=0.81)
S35. I would like to share recommended products with my immediate circle. 0.84*** 0.37
S39. I would like to share recommended products with my friends. 0.76*** 0.59
S43. I would like to learn my acquaintances’ areas of interest. 0.67*** 0.75
(Choi et al., 2006)
F: BEH: Behavior (AVE=0.54; CR=0.70;CA=0.70)
S8.How often do you use recommender systems on your smartphone? 0.70*** 0.56
S9. How often do you use recommender systems before buying a product? 0.77*** 0.55
Hypothesis
Conclusion
ERQPRQ 0.77*** Support
ERQENJ 0.64*** Support
PRQATT 0.64*** Support
PRQCOL 0.35*** Support
ENJATT 0.34*** Support
ENJCOL 0.49*** Support
ATTBEH 0.38*** Support
COLBEH 0.20** Support
*p<0.10; **p<0.05; ***p<0.01
Table 3: Goodness of Fit Values of The Structural Equation Model Fitness
Criteria
Good Fit Acceptable Fit Research
Model NFI 0.95≤ 𝑁𝐹𝐼 ≤ 1 0.90≤ 𝑁𝐹𝐼 ≤ 0.95 0.96 CFI 0.97≤ 𝐶𝐹𝐼 ≤ 1 0.95≤ 𝑁𝐹𝐼 ≤ 0.97 0.97 GFI 0.95≤ 𝐺𝐹𝐼 ≤ 1 0.90≤ 𝐺𝐹𝐼 ≤ 0.95 0.91 AGFI 0.90≤ 𝐴𝐺𝐹𝐼 ≤ 1 0.85≤ 𝐴𝐺𝐹𝐼 ≤ 0.90 0.89 RMSEA 0≤ 𝑅𝑀𝑆𝐸𝐴 ≤ 0.05 0.05≤ 𝑅𝑀𝑆𝐸𝐴 ≤ 0.10 0.079
49
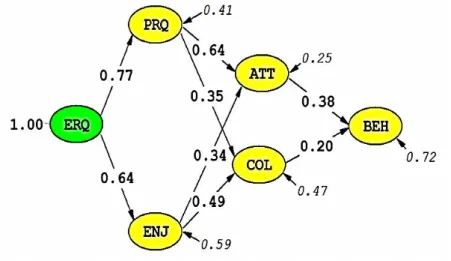
ERQ: Expected recommendation quality; PRQ: Perceived recommendation quality; ENJ: Enjoyment; COL: Collectivism; ATT: Attitude; BEH: Behavior
Figure 2: Path Diagram of The Mobile Recommender System
50 Structural Equations 2 2 2 2 0.77 0.41 ;R 0.59 0.64 0.59 ;R 0.41 0.64 0.34 0.25 ;R 0.75 0.35 0.49 0.47 ;R 0.33 0.38 B A C A D B C E B C F
2 0.20 0.72 ;R 0.28 D
E According to the results shown in Table 3 and Figure 2 and 3, the exogenous latent variable of “Expected Recommendation Quality” positively affected “Perceived Recommendation Quality” and “Enjoyment”. The path coefficient between “ERQ” and “PRQ” and between “ERQ” and “ENJ” was 0.77 and 0.64, respectively. In other words, an increase of one unit in expected recommendation quality related to mobile recommender systems led to an increase of 0.77 units in perceived recommendation quality and an increase of 0.64 units in enjoyment. “Perceived Recommendation Quality” was observed to positively affect “Attitude”. The path coefficient between perceived recommendation quality and attitude was 0.64. In other words, an increase of one unit in perceived recommendation quality related to mobile recommender systems led to an increase of 0.64 units in attitude towards mobile recommender systems. Similarly, “PRQ” positively affected “COL”. The path coefficient between PRQ and COL was 0.35. In other words, an increase of one unit in perceived recommendation quality related to mobile recommender systems led to an increase of 0.35 units in collectivism. Based on these coefficients, it can be said that attitude towards and collectivism related to mobile recommender systems would increase in parallel to the increase in perceived recommendation quality related to mobile recommender systems. Similarly, “Enjoyment” positively affected “Attitude” and “Collectivism”. The path coefficient between the variables was 0.34 and 0.49, respectively. In other words, an increase of one unit in enjoyment from mobile recommender systems led to an increase of 0.34 units in attitude towards mobile recommender systems and an increase of 0.49 units in collectivism related to mobile recommender systems.
“Attitude” was observed to positively affect “Behavior”. The path coefficient between these variables was 0.38. In other words, an increase of one unit in positive attitude towards
51
mobile recommender systems led to an increase of 0.38 units in behavior related to mobile recommender systems.
Similarly, “Collectivism” was observed to positively affect “Behavior”. The path coefficient between the variables of Collectivism and Behavior was 0.20. In other words, an increase of one unit in collectivism related to mobile recommender systems would lead to an increase of 0.20 units in behavior related to mobile recommender systems.
“Perceived Recommendation Quality” had 3 items. These items were observed to have positive coefficients. S37 had the highest coefficient (0.70). This means that the students’ notion of “I expect recommended products to reflect my areas of interest.” would increase together with the increase in expected recommendation quality related to mobile recommender systems. “Enjoyment” had 2 items. Among these two, S24 had the higher coefficient (0.91). This means that the students’ notion of “It is enjoyable to use mobile recommender systems.” would increase together with the increase in enjoyment from mobile recommender systems.
The exogenous latent variable of “Expected Recommendation Quality” had 4 items. S13 and S14 had the highest coefficients among these. The students’ notions of “Mobile recommender systems are useful when buying products.” and “Mobile recommender systems provide me with appropriate variety.” would increase together with the increase in perceived recommendation quality related to mobile recommender systems.
“Collectivism” had 3 items and S35 had the highest coefficient among these. The students’ notion of “I would like to share recommended products with my acquaintances.” would increase together with the increase in collectivism related to mobile recommender systems. “Attitude” had 2 items and S28 had the highest coefficient (0.75) among these. This means that the students’ notion of “I find mobile recommender systems useful.” would increase together with the increase in their attitudes towards mobile recommender systems. “Behavior” had 2 items and S9 had the highest coefficient (0.77) among these. The students’ frequency of “using mobile recommender systems before buying a product” would increase together with the increase in their mobile recommender system use behavior.
4. Discussion
The main purpose of this study was to reveal factors affecting attitudes and behaviors of students towards mobile recommender systems and the relationship between these factors using a proposed SEM. To the best of our knowledge, the number of studies investigating
52
factors affecting mobile recommender system use in Turkish universities and the relationship between these factors is limited. Thus, we believe that our study will contribute to the literature by providing a different dimension with the proposed research model and the SEM analysis of this model.
According to the SEM analysis results of the proposed research model, the variable of perceived recommendation quality positively affected the students’ attitudes towards mobile recommender systems. Some of the results of this study were similar to those in the literature. Xiao and Benbasat (2007) and Turel et al. (2006) found that the recommendation quality of information services was a significant factor affecting attitudes towards information services. In a mobile recommender system, the perceived recommendation quality is considered as the perceived benefit of the mobile system. When users wish to search restaurants that they could visit using their mobile devices, they might prefer restaurants closer to their current location rather than those further away. Therefore, a high recommendation quality received from mobile recommender systems, users develop positive attitudes towards mobile recommender systems. In this way, perceived recommendation quality becomes even more important than expected in terms of promoting positive attitudes towards the service (Choi et al., 2014).
In our study, enjoyment was found to positively affect mobile recommender system use behavior. Herlocker (2004) reported that users enjoyed some mobile recommender systems due to features such as creating personalized playlists (Apple Genius Mixes) and categorizing musical preferences of users (Music Aurora Pro). The author also highlighted that “Last.fm” produced playlists based on preferences of target users and listening history of other users and users enjoyed these recommendations since they direct them to new songs (Herlocker et al., 2004). Lee et al. (2007) and Xu (2006) found that users enjoyed using recommender system functions since they allow users to accumulate experiences and generally developed more positive feelings towards the service.
In our study, another factor affecting the attitude towards mobile recommender systems was collectivism. According to Choi et al. (2014), the dimension of collectivism is necessary for recommender systems since users of mobile recommender systems may consider opinions of others more easily when making purchasing decisions and adapt more to general tendencies of the society. Collectivism was considered a significant factor in revealing cultural differences in many previous studies (Al-Gahtani et al., 2007; Bandyopadhyay and Fraccastoro, 2007; and Hofstede, 2001). Similarly, Lee et al. (2007) found that collectivism
53
allowed individuals to make more definitive decisions through social interactions, thereby positively affecting user attitudes.
4.1. Research Limitations
The purpose of this study was to reveal attitudes and behaviors of university students towards mobile recommender systems using a proposed research model and provide an opportunity to investigate the relationship between factors affecting recommender system use. The sample included students from Eskisehir Osmangazi University only, which limits the generalizability of the study. Future studies may be conducted with students from different universities and by adding different dimensions to the model in order to reveal the relationship between factors affecting mobile recommender systems. Also, the analysis results and relations between variables may be compared with the results of this study. The results obtained in the study can be used especially for electronic commerce.
54
References
Al-Gahtani, S.S., Hubona,G.S. and Wang, J.(2007). Information technology (IT) in Saudi Arabia: culture and the acceptance and use of IT. Information & Management, 44, 681–691.
Al-Natour, S., Benbasat, I. and Cenfetelli, R.T. (2008). The effects of process and outcome similarity on users' evaluations of decision aids. Decision Sciences, 39, 175–211.
Bandyopadhyay, K. and Fraccastoro, K.A. (2007). The effect of culture on user acceptance of information technology. Communications of the Association for Information Systems, 19, 522–543. Baum, D. and Spann, M. (2014). The interplay between online consumer reviews and recommender systems: an experimental analysis. International Journal of Electronic Commerce, 19(1), 129-162. Choeh J.Y. and Lee, H.J. (2008). Mobile push: personalization and user experience. AI
Communications, 21, (2008) 185–193.
Choi, J., Lee, H.J., Sajjad, F. and Lee, H. (2014). The influence of national culture on the attitude towards mobile recommender systems. Technological Forecasting & Social Change, 86, 65-79. Davis, F.D. (1989). Perceived usefulness, perceived ease of use and user acceptance of information technology. MIS Q., 13, 319–340.
Demirkıran, E.T. (2016). Recommender Systems For E-Learning Environments. International Conference on Research in Education and Science (ICRES),377-381, May 19-22, 2016, Bodrum, Turkey
Fornell, C. and Larcker, D. F. (1981). Evaluating structural equation models with unobservable variables and measurement error. Journal of Marketing Research, 18(1):39–50.
Hair, J. F., Anderson, R. E., Tatham R. L. and Black, W. C. (1998). Multivariate Data Analysis, 5th Edition,New Jersey Prentice-Hall International.
Herlocker, J., Konstan, J.A., Terveen, L.G. and Riedl, J.T. (2004). Evaluating Collaborative Filtering Recommender Systems. ACM Transactions on Information Systems, 22(1), 1-53.
Hofstede, G. (2001). Culture's Consequences, 2nd ed. Sage Publications, Thousand Oaks, CA.
Hong, S.J. and Tam, K.Y. (2006). Understanding the adoption of multipurpose information appliances: the case of mobile data services. Information Systems Research, 17, 162–179.
Huang, S. (2011). Designing utility-based recommender systems for e-commerce: Evaluation of preference-elicitation methods. Electronic Commerce Research and Applications,10,398-407.
Kumar, N. and Benbasat, I. (2006). The influence of recommendations and consumer reviews on evaluations of websites. Information Systems Research. 17, 425–429.
55
Lee, B., Choi, B., Kim, J. and Hong, S. (2007). Culture–technology Fit: effects of cultural characteristics on the post-adoption beliefs of mobile internet users. International Journal of
Electronic Commerce. 11, 11–51.
Martin, R. and Hewstone, M. (2003). Social-influence Processes of Control and Change: Conformity, Obedience to Authority and Innovation, Sage, London.
Raykov, T. and Marcoulides, G.A. (2006). A first course in structural equation modelling, Mahwah, NJ: Lawrance Erlbaum Associates, 238.
Schermelleh- Engel, K. and Moosbrugger, H. (2003). Evaluating the fit of structural equation models: Test of significance and descriptive goodness of-fit measures. Methods of Psychological Research-
Online, 8(2), 23-74.
Tam, K.Y. and Ho, S.Y. (2005). Web personalization as a persuasion strategy: an elaboration likelihood model perspective. Information Systems Research, 16, 271–291.
Turel, O., Serenko, A., Detlor, B., Collan, M. and Nam, I. J. (2006). Puhakainen, Investigating the determinants of satisfaction and usage of mobile IT services in four countries. Journal of Global
Information Technology Management, 9, 6–25.
Xu, X., Dutta, K. and Ge, C. (2018). Do adjective features from user reviews address sparsity and transparency in recommender systems? Electronic Commerce Research and Applications, 29, 113-123.
V. Venkatesh (2000). Determinants of perceived ease of use: Integrating control, intrinsic motivation, and emotion into the technology acceptance model. Information Systems Research, 11, 342–365. Xiao, B. and Benbasat, I. (2007). E-commerce product recommendation agents: use, characteristics, and impact. MIS Quarterly, 31, 137–209.
Xu, D.J. (2006). The influence of personalization in affecting consumer attitudes toward mobile advertising in China. Journal of Computer Information Systems, 47, 9–19.