*Corresponding author: Oguzhan Zahmacioglu, Faculty of Medicine, Department of Child and Adolescence Psychiatry, Yeditepe University, Icerenkoy M. Hastane Yolu 102-104 Atasehir-Istanbul, Turkey, E-mail: [email protected]
Binnur Okan Bakir: Faculty of Health Sciences, Department of Nutrition and Dietetics, Yeditepe University, Istanbul, Turkey Hulya Akan: Faculty of Medicine, Department of Family Medicine, Yeditepe University, Istanbul, Turkey
Mehmet Akman: Faculty of Medicine, Department of Family Medicine, Marmara University, Istanbul, Turkey
Osman Hayran: Faculty of Medicine, Department of Public Health, Medipol University, Istanbul, Turkey
Binnur Okan Bakir, Hulya Akan, Mehmet Akman, Oguzhan Zahmacioglu* and Osman Hayran
Nutritional status, Healthy Eating Index and
eating attitudes of the adolescents in Istanbul:
a cross-sectional study
DOI 10.1515/ijamh-2015-0082
Received August 7, 2015; accepted September 30, 2015
Abstract
Background: The aim of this study was to evaluate dietary
quality of adolescents by using the Healthy Eating Index
(HEI) and to assess their eating attitudes by the EAT-26
Eating Attitude Test.
Methods: Eight schools; four primary schools and four
secondary schools were randomly selected from the
school list of official website of Istanbul Education
National Directorate. Five hundred and ninety-eight
stu-dents who met the inclusion criteria included in the study,
24 h dietary recalls were collected to calculate their HEI
scores and eating attitudes were evaluated by EAT-26
Eating Attitude Test. Their weight, height and waist
cir-cumference were measured.
Results: According to HEI scores, only two (0.3%) of
ado-lescents had high quality diet, 379 (63.4%) had diet quality
that needed improvement and 217 (36.3%) had poor diet.
Regarding Eating Attitude Test scores, 513 (85.8%) had
normal attitudes regarding eating behaviors.
Conclusion: Almost all of the participants need either
development or major changes in their eating behaviors.
Interventions aiming high quality diet among adolescents
are strongly recommended.
Keywords: adolescents; dietary patterns; eating
disor-ders; Healthy Eating Index; nutritional status.
Introduction
Turkey has a 24%–26% young (10–24 years) according to
the UN World Population Prospects report (2008 revision)
(1). Adolescence is one of the most challenging periods
in human development. The relatively uniform growth
of childhood is suddenly altered by a rapid increase in
the growth rate. These sudden changes create special
nutritional needs. Adolescents are considered especially
vulnerable nutritionally for several reasons. First, they
have an increased demand for nutrients because of the
dramatic increase in physical growth and development.
Second, the changes in lifestyle and food habits of
adoles-cents affect nutrient intake and needs. Third, adolesadoles-cents
have special nutrient needs associated with participation
in sports, pregnancy, development of an eating disorder,
excessive dieting, use of alcohol and drugs, or other
situa-tions common to adolescents (2).
Nowadays, unhealthy eating attitudes and relating
disorders are a global concern in both developed and
developing countries. Prevalence of eating disorders
continues to remain high in school age children and
ado-lescents. Many adolescents demonstrate poor dietary
practices while failing to meet current dietary guidelines
and recommendations (3). The situation is the same in
Turkey although there are few studies directly targeting
diet quality of adolescent age group (4).
Existing studies show that diet quality of Turkish
ado-lescents needs to be improved (4–6). The aim of this study
is to evaluate eating attitudes and diet quality of
adoles-cents by using EAT-26 Eating Attitude Test and Healthy
Eating Index (HEI).
Materials and methods
Study population
A cross-sectional study was conducted among adolescents attending primary and secondary schools in Anatolian side of İstanbul. The list of primary and secondary schools were obtained from Istanbul
Provincial Education Directorate’s website. The size of study sam-ple that will represent the adolescents in these schools at a confi-dence level of 95% was estimated to be 384. Four primary schools and four secondary schools were randomly selected from the school lists. Then three classes, one from each of the 6th, 7th and 8th years of primary schools and another three classes, one from each of the ninth and tenth years of secondary schools were selected randomly. All students attending to the selected classes were included in the study sample if they met the inclusion criteria.
Subjects were chosen among adolescents without any illness requiring a diet restriction, on a voluntary basis. Trained interview-ers from the Department of Dietetics and Medical School of Yeditepe University collected all data during face-to-face interviews, between April 2013 and April 2014 in the selected schools.
Pre-study period
All interviewers were trained for standardization of the data collec-tion procedures and preventing the probable interviewer bias. They were informed about the aim of the study, the use of study instru-ments, application of the questionnaires and the details of the 24 h dietary recall method.
Measurements and data collection
Trained dietetics and medical students did all measurements. A port-able scale (SECA, model: 869; Seca Medical Measuring Systems and Scales, Birmingham, UK) and a stadiometer were used to measure weight and height and body mass index (BMI) was calculated as weight (kg) divided by height squared (m2). Weight has been
meas-ured with pants on in boys and skirts on in girls and also shirts on for both genders. Shoes and outer clothing were taken off during meas-urements. According to BMI percentiles (WHO/NCHS/CDC, 1983), the 95th percentile and above was considered as obese and 85th percen-tile and above was considered as overweight. Waist circumference (WC) was measured at the mid-point, above the iliac crest and below the lowest rib margin using a flexible tape.
A questionnaire was filled during face-to-face interviews before the anthropometric measurements. The questionnaire included ques-tions about age, sex, presence of food allergies, systemic diseases, use of medications and physical activity status of the participants. Questions regarding the educational status, economic status and medical history of the participants’ families were also included in the questionnaire.
Twenty-four hour dietary recall (24HR) method was used to assess the food consumption and score HEI and Nutrition Informa-tion System (BeBiS; BEBIS Pacific Electricity, Electronic and Envi-ronment Technology Products, Industry and Commerce Limited Co., Istanbul, Turkey) was used to calculate daily nutrient intakes recorded form 24HR.
HEI was designed to assess diet quality in people aged 2 years and older (7). The HEI score is the sum of individual scores for 10 compo-nents. The first five components measure the degree of compliance with the US Department of Agriculture Food Guide Pyramid recommenda-tions for grains, vegetables, fruit, dairy and meat as recommended in servings per day. The next four components of the HEI assess the degree of adherence to Dietary Guidelines for Americans recommendations for daily intake of total fat, saturated fat, cholesterol, and sodium. The final component examines the variety of foods in the same groups.
Scores between 0 and 10 were assigned to all components. A score of 10 was assigned to all first five components if the recom-mended amount or more is consumed and a score of 0 was assigned when any kind of food in that group is not consumed. For next four components which observe total fat, saturated fat, cholesterol and sodium intake considers the maximum score 10 as the diet contains less amounts than maximum intake allowances, while the intakes increase, scores decrease proportionally and the score 0 is for the extreme amounts. The last components of the HEI is variety is scored according to the different kind of food in the same groups at the first five component; grains, vegetables, fruit, dairy and meat. For all components intermediate scores are calculated proportionally. The HEI score categorization proposed by Kennedy and colleagues (7) was initially used (an HEI score > 80 implies a good diet, a score between 50 and 80 indicates a diet needs improvement, and a score lower than 50 indicates a poor diet). However, because only a few percent of participants had a score of > 80, further analyses were per-formed using the quartile of the HEI score (8).
The Eating Attitude Test (EAT-26) is one of the most widely used standardized measures used to assess the disorder risk based on atti-tudes, feelings, and behaviors related to eating (9). Participants are asked to respond to each of 26 questions on a six-point scale which score, respectively, 3 (always), 2 (usually), 1 (often), 0 (never/rarely/ sometimes), indicating how often they have the eating symptoms and concerns that are common in eating disorders. Total scores of EAT-26 can range from 0 to 78, with higher scores indicative of more severe disordered eating. A score at or above 30 indicates a high risk of eating disorder. In our study, reliable and valid Turkish version of EAT-26 was used (10).
Statistical analyses
SPSS version 18.0 is used for statistical analysis. Descriptive statistics were calculated and statistical analyses were conducted to determine the possible associations between participants’ demographics, phys-ical activity status and their eating patterns. A χ2-test was used for
the comparison of categorical variables and the Student’s t-test or its nonparametric equivalent was used for the comparison of continu-ous variables. p < 0.05 was accepted as significant.
Ethics
The study has been approved by Yeditepe University Ethical Commit-tee. Also, official permission has been taken from İstanbul Provincial Education Directorate. After official permission, each school princi-pal was contacted for oral permission and appointment for the data collection. Adolescents’ parents signed an informed consent adher-ing to Declaration of Helsinki protocols (Word Medical Association) before conducting the study.
Results
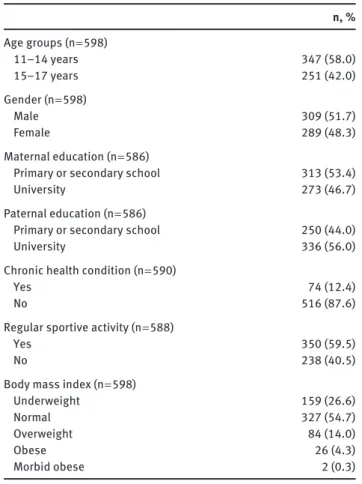
Complete and reliable data were collected from 598 of
642 students with a participation rate of 93.1%. Some
demographic and health characteristics of the study group
are presented in Table 1. As it is seen, 48.3% of the study
group were female, 12.4% had a chronic health problem,
59.5% were engaged in regular sportive activities. The
major-ity of the group 54.7% had normal BMI values, while 14.0%
were overweight, 4.3% obese and 26.6% underweight.
According to healthy index, only two (0.3%) of
adoles-cents had high quality diet, 379 (63.4%) had diet quality
need to be developed and 217 (36.3%) had poor diet. HEI
scores of participants by demographic and health
char-acteristics are presented in Table 2. HEI scores were
sig-nificantly higher among females than males (p = 0.01),
and among the students whose fathers are graduates of
university (p = 0.038).
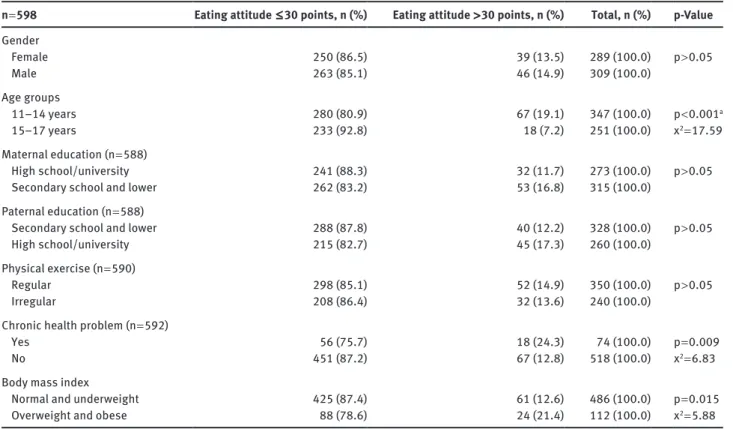
Among 598 adolescents 85 (14.2%) of adolescents had
eating attitude points > 30 and 513 (85.8%) had normal
attitude points ( ≤ 30) (Table 3). There was no difference
between males’ and females’ eating attitudes scores.
Percentage of adolescents with normal eating attitude
scores ( ≤ 30) was significantly higher among 15–17 years
age group than 12–14 years age group (92.8% vs. 80.9%,
respectively; p < 0.001). Percentage of adolescents with
normal eating attitude values was significantly higher
Table 1: Participants’ characteristics.n, % Age groups (n = 598) 11–14 years 347 (58.0) 15–17 years 251 (42.0) Gender (n = 598) Male 309 (51.7) Female 289 (48.3) Maternal education (n = 586)
Primary or secondary school 313 (53.4)
University 273 (46.7)
Paternal education (n = 586)
Primary or secondary school 250 (44.0)
University 336 (56.0)
Chronic health condition (n = 590)
Yes 74 (12.4)
No 516 (87.6)
Regular sportive activity (n = 588)
Yes 350 (59.5)
No 238 (40.5)
Body mass index (n = 598)
Underweight 159 (26.6)
Normal 327 (54.7)
Overweight 84 (14.0)
Obese 26 (4.3)
Morbid obese 2 (0.3)
among the participants who declared no chronic health
problem (p = 0.009) and normal or underweight
adoles-cents (p = 0.015).
Males were more regularly exercising than females
(72.4% vs. 45%, respectively; x
2= 45.69, p < 0.001). There
was no gender difference regarding BMI, parental
educa-tion, chronic health condieduca-tion, owing house or car, any
health condition restricting physical activity, going to
school by walking.
Total scores of subcomponents of HEI has been shown
in Table 4.
Discussion
The goal of the National Food and Nutrition Strategy for
Turkey is to protect and promote health through healthy
nutrition, reduce the burden of diseases, while
contrib-uting to socio-economic development and a sustainable
food security (11). So, it is clear that healthy eating is an
important component of improvement of general
popu-lation health. Healthy diet does not only mean being at
the healthy weight, but also consuming the food and
beverages such as fresh fruit, vegetables, calcium rich
foods at recommended amounts according to the age
groups (12).
The mean HEI scores of all adolescents indicate that
overall dietary quality of adolescents is poor. 0.3% of
adolescents had a good diet, 36.9% had poor diet and
62.8% had diet needs improvement. This might be
con-sidered, as all of the adolescents need improvement for
their diets and nutritional habits. These results are not
very different from the study conducted by Acar Tek et al.
(4) in Ankara the capital of Turkey in which adolescents’
dietary quality was evaluated with HEI. They also found
out that the overall diet quality and nutritional habits
of Turkish adolescents need modification and
improve-ment with a result that 42.8% have poor diet and 57.2%
need improvement with no one having a good diet.
Differ-ently they have found that HEI did not associate with age,
gender and weight, while our results have shown HEI is
significantly associated with sex and females had greater
HEI scores. Similarly they have found a significant
rela-tionship between parental education and HEI as we did in
this study (4). A study in Sao Paulo, Brazil evaluated diet
quality of adolescents with HEI and they found 97.1% of
the adolescents have a poor diet or they need improvement
with an average HEI score 59.7. In contrast with our study
they have found male adolescents have higher HEI scores
(13). Among 2616 Canadian adolescents aged between
13 and 17, who were also evaluated with HEI, 8% of them
had a poor diet while 71% had a diet needs improvement
and 21% had a good diet. Similarly they have found
over-weight adolescents are more likely to develop eating
dis-orders as they are more concerned about their weight (14).
Studies show that females have better diet quality
than males (15, 16) and the results of the participants of
the National Health and Nutrition Examination Survey
(NHANES) showed that the diet quality of Americans differ
by sex with females better scores of HEI (17). Children aged
between 2 and 17 participated in NHANES study had HEI
scores between 54.7 and 59.6 (18). In Greece, a study that
was conducted among 525 adolescents have shown similar
results such as maternal education is directly related with
a healthier diet but differently they have found boys have
healthier attitudes than girls. Their results also showed
that there is a significant association between the age of
the adolescents and healthy diet. In early adolescence
students have healthier diet (19). Such like having healthy
dietary patterns in early adolescence in our study they are
found to have higher risk for eating disorders in spite of
eating disorders typically occur during mid to late
ado-lescence (20) while we have found differently as in early
adolescence eating disorders are more frequent.
Overweight adolescents are more likely to develop
eating disorders. In a study evaluating eating disorder
symptoms in 7082 early adolescents at age 13 it is found
that overweight adolescents have higher prevalence of
eating disorders similar to our results (21). In a study about
eating disorder characteristics in 1197 adolescents aged
between 12 and 18, it was shown that overweight
adoles-cents are more dissatisfied with their weight and are more
likely to develop eating disorders with an odds ratio 10.23
(22). Like overweight adolescents obese adolescents are
also have a higher risk for evolving disorders that is also
shown in a study with 99 obese adolescents. It is found
that obese adolescents have a higher risk independently
from age and sex (23). A study in 179 adolescents had found
a 36.7% prevalence of eating disorders and the ones who
had eating disorders have all a overweight history (24).
Table 2: Healthy Eating Index (HEI) scores by participants’ characteristics.n = 596 HEI ≤ 50 points, n (%) HEI 51–80 points, n (%) Total, n (%) p-Value
Gender Female 90 (31.7) 198 (68.3) 288 (100.0) p = 0.01a Male 127 (41.2) 181 (58.8) 308 (100.0) x2 = 6.40 Age groups 11–14 years 132 (38.2) 214 (61.8) 346 (100.0) p > 0.05 15–17 years 85 (34.0) 165 (66.0) 250 (100.0) Maternal education (n = 586) University 108 (39.9) 163 (60.1) 271 (100.0) p > 0.05
Secondary school and lower 107 (34.0) 208 (66.0) 315 (100.0)
Paternal education (n = 586)
University 83 (32.0) 176 (68.0) 259 (100.0) p = 0.038a
Secondary school and lower 132 (40.4) 195 (59.6) 327 (100.0) x2 = 4.30
Physical exercise (n = 588)
Regular 128 (38.7) 221 (63.3) 349 (100.0) p > 0.05
Irregular 86 (36.0) 153 (64.0) 239 (100.0)
Chronic health problem (n = 590)
Yes 23 (31.1) 51 (68.9) 74 (100.0) p > 0.05
No 193 (37.4) 323 (62.6) 516 (100.0)
Body mass index
Underweight 61 (38.6) 97 (61.4) 158 (100.0) p > 0.05 Normal 113 (34.7) 213 (65.3) 326 (100.0) Overweight/obese 43 (38.4) 69 (61.6) 112 (100.0) Eating attitude Normal 184 (35.9) 328 (64.1) 512 (100.0) p > 0.05 Eating disorder 33 (39.3) 51 (60.7) 84 (100.0)
According to FAO Food Balance Sheets, Turkish
people appeared to be well nourished. The total protein
consumption per capita was estimated as high, but
mis-distribution and the poor quality of much if the food
con-sumed in Turkey are not properly demonstrated in food
balance sheets (5).
Turkey is a major agricultural producer. With respect to
its climate and land nature, Turkey is suitable for the product
of various products. Grain is a staple food of the Turkish
people and a major percentage of energy comes from bread
Table 3: Eating attitude scores by participants’ characteristics.n = 598 Eating attitude ≤ 30 points, n (%) Eating attitude > 30 points, n (%) Total, n (%) p-Value
Gender Female 250 (86.5) 39 (13.5) 289 (100.0) p > 0.05 Male 263 (85.1) 46 (14.9) 309 (100.0) Age groups 11–14 years 280 (80.9) 67 (19.1) 347 (100.0) p < 0.001a 15–17 years 233 (92.8) 18 (7.2) 251 (100.0) x2 = 17.59 Maternal education (n = 588) High school/university 241 (88.3) 32 (11.7) 273 (100.0) p > 0.05
Secondary school and lower 262 (83.2) 53 (16.8) 315 (100.0)
Paternal education (n = 588)
Secondary school and lower 288 (87.8) 40 (12.2) 328 (100.0) p > 0.05
High school/university 215 (82.7) 45 (17.3) 260 (100.0)
Physical exercise (n = 590)
Regular 298 (85.1) 52 (14.9) 350 (100.0) p > 0.05
Irregular 208 (86.4) 32 (13.6) 240 (100.0)
Chronic health problem (n = 592)
Yes 56 (75.7) 18 (24.3) 74 (100.0) p = 0.009
No 451 (87.2) 67 (12.8) 518 (100.0) x2 = 6.83
Body mass index
Normal and underweight 425 (87.4) 61 (12.6) 486 (100.0) p = 0.015
Overweight and obese 88 (78.6) 24 (21.4) 112 (100.0) x2 = 5.88
ap < 0.05 accepted statistically significant.
Table 4: Total HEI and component scores of students included in the study. Mean Std error (±) Grains 6.53 0.15 Vegetables 4.73 0.15 Fruits 3.63 0.14 Dairy 4.39 0.15 Meat 6.65 0.14 Total fat 3.51 0.17 Saturated fat 2.88 0.16 Cholesterol 5.88 0.19 Sodium 6.77 0.16 Variety 7.84 0.13 Total 38.31 0.97
(48%) and other cereals (58%) (5); while the adolescents did
not have enough scores for grains regarding HEI.
Mostly saturated fat and total fat intake scores and
fruit consumption scores were low, indicating that they
consume foods high in saturated fat and while their dairy
and vegetable consumptions were also below the half of
adequate amounts.
Obesity is increasing in most high-income countries,
in developing countries undergoing nutrition
transi-tion, and even poor countries. The situation in
develop-ing countries varies widely regarddevelop-ing urbanization and
income, but obesity is not merely a problem of
high-income group (24).
The health consequences of overweight and obesity
in adolescence include psychosocial problems, increased
cardiovascular risk factors, abnormal glucose
metabo-lism, hepatic gastrointestinal disturbances sleep apnoea
and orthopedic complications. Obesity in adolescence
may have serious problems health and psychological
diffi-culties that also persist through adult years (25), although
for others, obesity in adolescence may have limited
emo-tional implications (26). Adolescents are sensitive about
body image and obese teenagers are especially vulnerable
to social discrimination (24).
Excessive consumption of energy-dense foods is a
major contributor to weight gain during adolescence. But,
interventions directed at this population have achieved
limited success (27, 28). Complex psychological changes
in adolescence period have been offered as an
explana-tion for the lack of efficacy in dietary intervenexplana-tions (29).
This study has some limitations. First it was conducted
in a region so our results may not reflect whole
popula-tion. There may be some recall bias since HEI scores based
on students statements.
Conclusion
In conclusion, percentage of adolescents having poor diet
is high among in our study group. Almost all of the
partici-pants needs either development or major changes in their
eating behaviors. Interventions aiming high quality diet
among adolescents are strongly recommended.
Conflict of interest statment
Declaration of conflicting interest: The authors declare
that there are no conflict of interests.
Authors’ contributions: BO has participated study design,
conducted the study and written the manuscript. HA
has designed the study and contributed to statistics and
manuscript writing. MA has done the statistics and
con-tributed to writing of the manuscript. OZ has concon-tributed
to study design and written the manuscript. OH has
con-tributed to study design and to conducting the study and
also to writing of the manuscript.
Funding: This research received no specific grant from any
funding agency in the public, commercial or not-for-profit
sectors.
References
1. UN. Department of Economic and Social Affairs. World population prospects: highlights of the 2008 revision. New York: UN, 2009. 2. Spear BA. Adolescent growth and development. J Am Diet Assoc
2002;102(3 Suppl):S23–9.
3. Moreno LA, Rodriguez G, Fleta J, Bueno-Lozano M, Lazaro A, et al. Trends of dietary habits in adolescents. Crit Rev Food Sci Nutr 2010;50:106–12.
4. Acar Tek N, Yildiran H, Akbulut G, Bilici S, Koksal E, et al. Evalua-tion of dietary quality of adolescents using Healthy Eating Index. Nutr Res Pract 2011;5:322–8.
5. Pekcan G. Food and nutrition policies: what’s being done in Turkey. Public Health Nutr 2006;9:158–62.
6. Akman M, Akan H, Izbirak G, Tanriover O, Tilev SM, et al. Eating patterns of Turkish adolescents: a cross-sectional survey. Nutr J 2010;9:67.
7. Kennedy ET, Ohls J, Carlson S, Fleming K. The Healthy Eating Index: design and applications. J Am Diet Assoc 1995;95:1103–8.
8. Manios Y, Kourlaba G, Kondaki K, Grammatikaki E, Birbilis M, et al. Diet quality of preschoolers in Greece based on the Healthy Eating Index: the GENESIS study. J Am Diet Assoc 2009;109:616–23.
9. Garner DM, Olmsted MP, Bohr Y, Garfinkel PE. The eating attitudes test: psychometric features and clinical correlates. Psychol Med 1982;12:871–8.
10. Savasir I, Erol N. Yeme Tutum Testi: Anoreksiya nervoza belirtil-eri indeksi. Psikoloji Dergisi 1989;7:19–25 (in Turkish). 11. SPO. National Food and Nutrition Strategies (2001) [cited 2014
October 10]. Available at: http://www.ekutup.dpt.gov.tr/gida/ strateji.pdf.
12. CDC. Dietary Guidelines for Americans 2010. Available at: http://www.cdc.gov/healthyweight/healthy_eating/.
13. de Andrade SC, de Azevedo Barros MB, Carandina L, Goldbaum M, Cesar CL, et al. Dietary quality index and associated factors among adolescents of the state of Sao Paulo, Brazil. J Pediatr 2010;156:456–60.
14. Woodruff SJ, Hanning RM, Lambraki I, Storey KE, McCargar L. Healthy Eating Index-C is compromised among adolescents with body weight concerns, weight loss dieting, and meal skipping. Body Image 2008;5:404–8.
15. Feskanich D, Rockett HR, Colditz GA. Modifying the Healthy Eating Index to assess diet quality in children and adolescents. J Am Diet Assoc 2004;104:1375–83.
16. Bowman SA, Gortmaker SL, Ebbeling CB, Pereira MA, Ludwig DS. Effects of fast-food consumption on energy intake and diet qual-ity among children in a national household survey. Pediatrics 2004;113(1 Pt 1):112–8.
17. Hiza HA, Casavale KO, Guenther PM, Davis CA. Diet quality of Americans differs by age, sex, race/ethnicity, income, and education level. J Acad Nutr Diet 2013;113:297–306.
18. USDoA. United States Department of Agriculture. The quality of children’s diets in 2003-04 as Measured by the Healthy Eating Index-2005. April 2009 Nutrition Inside 43. Available at: http:// www.cnpp.usda.gov/sites/default/files/nutrition_insights_ uploads/Insight43.pdf.
19. Papadaki S, Mavrikaki E. Greek adolescents and the Mediter-ranean diet: factors affecting quality and adherence. Nutrition (Burbank, Los Angeles County, Calif). 2015;31:345–9. 20. Golden NH, Katzman DK, Sawyer SM, Ornstein RM, Rome ES,
et al. Update on the medical management of eating disorders in adolescents. J Adolesc Health 2015;56:370–5.
21. Micali N, Ploubidis G, De Stavola B, Simonoff E, Treasure J. Frequency and patterns of eating disorder symptoms in early adolescence. J Adolesc Health 2014;54:574–81.
22. Cordoba Caro LG, Luengo Perez LM, Feu S, Garcia Preciado V. [Satisfaction with weight and characteristics of eating disorders in high school]. Anales de Pediatria (Barcelona, Spain: 2003) 2015;82:338–46.
23. Marin V, Sommer K, Agurto P, Ceballos ML, Aguirre ML. [ Eating disorders risk among obese adolescents]. Revista medica de Chile. 2014;142:1253–8.
24. Lebow J, Sim LA, Kransdorf LN. Prevalence of a history of overweight and obesity in adolescents with restrictive eating disorders. J Adolesc Health 2015;56:19–24.
25. WHO. Nutrition in adolescence – issues and challenges for the health sector. The World Health Organisation, 2005.
26. Lifshitz F, Tarim O, Smith MM. Nutrition in adolescence. Endocr Metab Clin 1993;22:673–83.
27. Summerbell CD, Waters E, Edmunds LD, Kelly S, Brown T, et al. Interventions for preventing obesity in children. Cochrane Data-base Syst Rev 2005(3):Cd001871.
28. Elster AB, Kuznets NJ. AMA guidelines for adolescent preventive services (GAPS): recommendations and rationale. Baltimore: Williams & Wilkins, 1994.
29. Ammerman AS, Lindquist CH, Lohr KN, Hersey J. The efficacy of behavioral interventions to modify dietary fat and fruit and vegetable intake: a review of the evidence. Prev Med 2002;35:25–41.