http://www.saujs.sakarya.edu.tr/
Title: A Climate Change Impact: Variation In Precipitation Patterns, And Increased
Drought Risk In Turkey
Authors: İsmail Dabanlı
Recieved: 2018-10-04 00:00:00
Revised: 2018-10-13 00:00:00
Accepted: 2018-10-22 00:00:00
Article Type: Research Article
Volume: 23
Issue: 2
Month: April
Year: 2019
Pages: 193-202
How to cite
İsmail Dabanlı; (2019), A Climate Change Impact: Variation In Precipitation
Patterns, And Increased Drought Risk In Turkey. Sakarya University Journal of
Science, 23(2), 193-202, DOI: 10.16984/saufenbilder.467119
Access link
A Climate Change Impact: Variation in Precipitation Patterns, and Increased
Drought Risk in Turkey
İsmail Dabanlı*1, 2 Abstract
Since the industrial revolution, temperature averages have been changing both in local and global scale. These variations are related with the climate and global warming changes. Such typical changes (i.e., increasing heavy precipitation, and declined light or total precipitation) are also observed in Turkey. As expected, decreased precipitation usually promotes drought conditions, and can cause extended dry days or periods. Thus, strong relationship can be considered between precipitation scarcity and drought conditions. In this study, changes in precipitation (i.e., total, bottom/lowest and extreme 10%), dry days length, dry spells (>6 days) and drought severity risk based on Standardized Precipitation Index (SPI) and Standardized Precipitation Evapotranspiration Index (SPEI) were evaluated quantitatively over Turkey from 1971 to 2000 with regards to climate changes. Trend analysis is performed by using Innovative-Şen analysis (ITA) method to evaluate trend behavior of precipitation, lengths of dry days and spells. Results show that changes in dry days (ΔDD/ΔT) converge to (-2% ±3%)/0C, while changes in
prolonged dry spells change (ΔDS/ΔT) are comparativelyhigher (3% ±5%)/0C. For precipitations, mean values of
ΔP/ΔT converges to constant value as (-6% ±8%)/0C, (0% ±2%)/0C and (-1% ±4%)/0C for total, top 10% heavy
and lowest 10% precipitations, respectively. These changes are supported by ITA outputs. All results support and point out that prolonged drought risk frequency and severity has been increasing.
Keywords: Drought risk, dry days, dry spells, precipitation patterns, Turkey
1. INTRODUCTION
After industrial revolution, abrupt changes in atmospheric temperature and precipitation patterns are observed in many regions around the World. Increases in extreme events (i.e., urban floods and water stress) have drawn great attention on climate change and/or global warming [1]. Nasef [2] stated that the average global temperature, increased by more than 0.8 0C
* Corresponding author. Tel.: +90 2166815100; E-mail address: [email protected]
1 Istanbul Medipol University, School of Engineering and Natural Sciences, Civil Engineering Department, Kavacık, Istanbul,
Turkey
2 Istanbul Medipol University, Climate Change Researches Application and Research Center, (IKLIMER) Kavacık, Istanbul,
Turkey.
compared to the pre-industrial era since latest quarter of the 19. century. Nonetheless, the mean global temperature rise has accelerated since middle of 20. century at an estimated average of decadal rate equal to 0.16 0C [3]. Temperature increases are coupled with
regular precipitation decline by the end of the twenty-first century. Total precipitation amount increases also in mid-latitudes, because of extreme precipitation frequency increases as estimated in climate model
scenarios at continental level [4, 5]. Increases in heavy precipitation, which may result in extreme storms, or floodings could even occur more frequently due to water vapor volume elevation induced by higher temperature [6]. Recent studies for drought analysis support such precipitation increases in the mid-latitude countries like Turkey [7,8].
The European region and Mediterranean countries are affected most heavily [9] and they are currently vulnerable to mean annual temperature increase, coupled with increased dry days and dry spells [10]. Several researches based on the temporal drought analysis, reveal that Mediterranean countries have experienced more drought periods during recent decades [11, 12, 13]. Especially, annual mean temperature has increased significantly during last four decades. Moreover, not only temperature changes, but heavy precipitation linked with agricultural loss, and dry spells has been increasing across Turkey.
Evaluation of variations in historical hydro-climatic records is an essential process to understand climate change, and surface temperature difference. Temperature is one of the most prime parameters affecting many climatic variables (i.e., precipitation, dry day, etc) and poses great relations with dry periods. In literature several studies have showed recently the relationship between precipitation intensity and surface temperature [14, 15, 16, 17, 18, 19, 20, 21]. Primary motivations of this studies help to investigate uncertainties of whether precipitation intensity, and enhancement according to Clausius–Clapeyron (CC) ratio (approximately 7% K-1) with extremes as the
global temperature increases [22]. Beside these, the relationship between global temperature difference and several kinds of precipitation difference (ΔP) were analyzed by different groups [23, 24]. The difference between stream and equilibrium temperatures was connected to the temperature difference by O’Driscoll and DeWalle [25].
, Turkey is exposed to fight several drought circumtances in history. To come up with drought and extreme events, struggling and understanding of phenomena in scientific basis is essential. Some prominent studies help this aspect of hazards. For example, Sırdas and Şen [26] statically analyzed spatio-temporal variability of precipitation in the northwest ragion of Turkey (Trakya Region). Sönmez et al., [27] evaluated drought in Turkey mainland using Standardized Precipitation Index (SPI) without considering spatially homogeneous drought regions.
To the best of our knowledge, previously conducted studies focused mostly on drought and flood risks in nationwide scale. However, there is no conducted study to investigate the national precipitation changes and drought risk. Temperature difference has not been associated with precipitations (bottom/lowest, total and top 10%), dry days and prolonged dry spells in literature for Turkey. It is hypothesized that function of temperature difference (ΔT) can lead to innovative approaches in hydro-meteorological sciences particularly in drought risk assessments.
Due to complex nature of droughts, the standardized indices are often used as proxies for drought assessment including SPI [28]. The SPI is a widely used drought indicator due to its relatively simple procedure in terms of data needs [29, 30]. The Standardized Precipitation Evapotranspiration Index (SPEI) is used frequently based upon the difference between cumulative precipitation and potential evapotranspiration [31]. The SPI and SPEI can be examined for a variety of time scales to capture relevant drought information [32].
Trend assessment of hydro-climatic variables is important output for future drought risk prediction. When, drought risk evaluation is supported by trend behavior identification, it can strength the findings. Thus, the innovative graphical trend identification method suggested by Şen [10] is employed for precipitation, dry days and prolonged dry spells in this study.
The main objectives of this study are: (1) to investigate drought risk by evaluating changes of precipitation (total, lowest and extreme 10%), dry days, prolonged dry spells (spell>6 days) with respect to temperature difference (ΔT); (2) to generate and compare future trend behavior and drought risks for the alterations in precipitation, dry days, prolonged dry spells in a context of climate change.
2. STUDY AREA AND DATA
Turkey connects Europe and Asia as an inter-continental country located between 26o-450 E and 360
-420 N longitudes and latitudes, respectively. Data used
in this study are obtained from 101 gauges over Turkey. (Figure 1). Daily temperature and rainfall data are provided from Turkish State Meteorological Service (TSMS), between 1971 and 2000, inclusive. Although, daily records consist of few gaps, missing data are filled by linear regression method, which is widely
used simple reconstruction method for hydrologic time series [33]. In the south and west regions of Turkey prolonged dry days are seen in summer season from May to October. Population distribution is not homegenious. Particularly, agricultural sectors and urban populations are located in the sea coast and western parts, because of convenient morphological charecteristics, climatic conditions and economic facilities.
3. METHODOLOGY
Applied method in this paper is inspired from Liu et al. [23] and strengthened by Mishra and Liu [24]. On contrary of these papers, local temperature was chooseninstead of global sea surface temperature. The absolute difference, ΔT, of annual average temperatures were calculated between any 2 years during 1971–2000 with a total of 30×29/2=435 independent data points [34]. In equation 1, calculation
procedure is presented in matrix form to clarify the calculation process. By following the same calculation method, any climatic variables, ΔX, can also be obtain in the same manner and order based on ΔT. The ΔTs and corresponding ΔXs were sorted in ascending order and then grouped into 29 equal sub-categories to control fluctuatinons within narrow interval without changing characteristics in ΔT.
(1)
Figure 1 Observation gauges locations on Turkey mainland [34].
4. APPLICATION AND RESULT
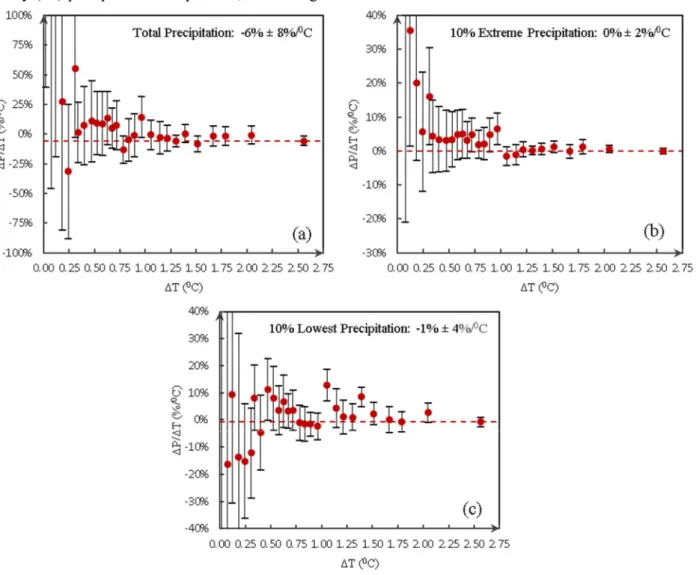
The first application of mentioned technique is performed for the lightest and heaviest 10% precipitations over Turkey. The precipitation record in each observation gauges from 1971 to 2000 are sorted into 10 bins, which include equal precipitation amount in increasing precipitation intensity. Only precipitation amount was considered by dividing data range (into 10 bins. The mean values of bins for 101 gauges records
were calculated as 7.69, 14.42, 22.75, 34.03, 50.08, 70.65, 98.01, 134.63, 192.21, and>192.21 mm/day. In Figure 2, while ΔT increases, mean values of ΔP/ΔT converges to constant values as (-6% ±8%)/0C, (0%
±2%)/0C and (-1% ±4%)/0C for total (Figure 2a), top
10% heavy (Figure 2b), and lowest (or lightest) 10% (Figure 2c) precipitations. These results show that ΔP implies decreasing differences in precipitation for corresponding ΔTs. When the highest value of ΔT reaches to approximately 2.56 0C within 1 standard
deviation range, horizontal red dashed line passes through the mean of last bin. This shows that mean
İsmail Dabanlı
A Climate Change Impact: Variation In Precipitation Patterns, And Increased Drought Risk In Turkey
value of ΔP/ΔT corresponds to highest value of ΔT, which can be considered as the representative value of ΔP/ΔT ratio. As seen in all the graphs in Figure 2 (a, b, c) ΔT increases from 1971-2010, and precipitation amounts decrease as expected for total (2a) and lowest 10% (2c) precipitations and neutralizes for top 10% heavy (2b) precipitations. In practice, decreasing total
precipitation is consistent with general expectation in climate change perspective for Turkey as mentioned in Dabanlı et al. [7]. However, 10% extreme precicipitation neutralization is not in consisteny to expectation.
Figure 2 Illustration of ΔP/ΔT slope for different precipitation levels as a function of ΔT. Vertical bar denotes 1 standard deviation. a) Total precipitation b) Top 10% heavy precipitation c) Lowest 10% precipitation.
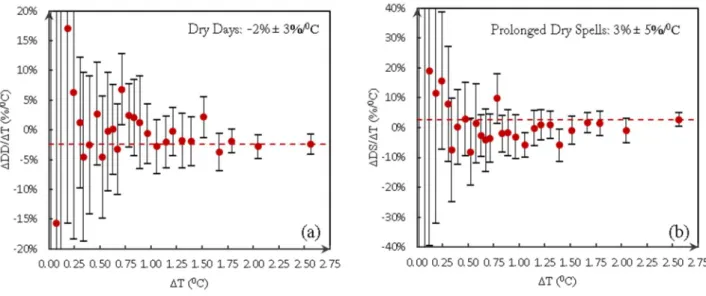
The annual changes in the average dry days (DD) (Figure 3a) and total prolonged dry spells (DS) (Figure 3b) are also identified by using ΔT. Similar computation and relationship generation processes were implemented to dry day and dry spell data in each year from 1971 to 2000, inclusive. Arbitrarily six or more dry days were selected to determine dry spell count as suggested by Mishra and Liu [24]. Analysis results indicate that, ΔDD/ΔT converges to (-2% ±3%)/0C, while prolonged dry spells ΔDS/ΔT
approaches to (3% ±5%)/0C. Accordingly increasing
prolonged dry spells (more than consecutive 6 days)
prove that longer dry periods tend to appear frequently, while total dry day count decreases. This might cause longer drought events as in the past. However, this results does not gives temporal variability of droughts. The negative ratio of total dry days can be explained by spatial variability of precipitation over Turkey. If this analysis is implemented on geographical regions, drought risk perspective results may be distinguishable between south and north regions. North regions almost have no drought risk due to the regular precipitation regime. This point is essential discussion or research field for develop models and comparision.
Finally, drought risks are evaluated by using different indices. The SPI (Figure 4a, 4b and 4c) and SPEI (Figure 4d, 4e and 4f) were employed to unveil drought risk in different scale as presented for extreme, severe and moderate drought conditions for 3-month time scales. Convergence values are (5% ±38%)/0C, (1%
±18%)/0C and (1% ±12%)/0C for extreme (4a), severe
(4b) and moderate (4c) drought risks in SPI-3, respectively. Regarding 3-month time scale for SPEI,
(99% ±275%)/0C, (1% ±97%)/0C and (75% ±53%)/0C
are resultants for extreme (4d), severe (4e) and moderate (4f) drought increases, respectively. In SPEI-3 analyis, it is hard to claim that consistency of risk level is not clear. However, SPI-3 results can be accepted as more realistic and consisted.
Figure 3 ΔT function relationship between ΔDD/ΔT for average dry days (a) and ΔDS/ΔT for total prolonged dry spells (b) in annual scale over Turkey
Figure 4 Changes of drought risk in different time scale and indices as a function of ΔT: a) SPI-3 for extreme drought risk b) SPI-3 for severe drought risk c) SPI-3 for moderate drought risk d) SPEI-3 for extreme drought risk e) SPEI-3 for severe
drought risk f) SPEI-3 for moderate drought risk.
İsmail Dabanlı
A Climate Change Impact: Variation In Precipitation Patterns, And Increased Drought Risk In Turkey
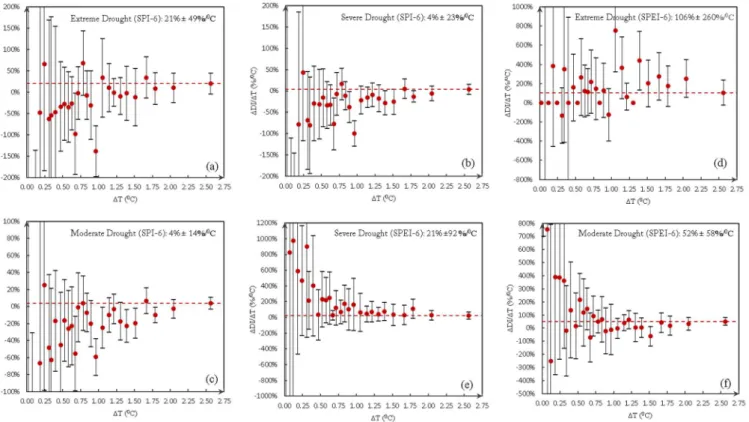
6-month time scale SPI-6 and SPEI-6 for drought risks were calculated and the results are illustrated in Figure 5. Similarly, all indices come out with increasing drought risk tendency. Regarding extreme drought risks, (21% ±49%)/0C (5a) and (106% ±260%)/0C (5d)
are valid for SPI-6 and SPEI-6 respectively. For severe drought risks, these ratios are (4% ±23%)/0C (5b) in
SPI-6 and (21% ±92%)/0C (5e) in SPEI-6. Finally, (4%
±14%)/0C (5c) and (52% ±58%)/0C (5f) are calculated
for SPI-6 and SPEI-6 moderate drought risks, respectively. As a result, consistency is seen only in same indices for different severity levels. This output prove that, SPEI index does not present logical convergent values. In same severity level difference almost above %100 between SPI and SPEI.
As a last analyis, drought risks were calculated for 12-mothh time scales and results are presented in Figure 6. Drought risks have also increasing tendency in all severity levels for 12-month time scales. Convergence values are (24% ±43%)/0C (6a), (13% ±28%)/0C (6b)
and (3% ±21%)/0C (6c) for extreme, severe and
moderate drought risks in SPI-12, respectively. Regarding SPEI-12, these percentages are (132% ±398%)/0C (6d), (0% ±0%)/0C (6e) and (49%
±67%)/0C (6f), respectively. These results are not
indicates and coherency between SPI-12 and SPEI-12
as expected. Moreover, zero (0) risk for severe drought in (Figure 6e) SPEI-12 dissociates from others.
Obtaining result from SPI analysis for enhancing drought risk level is consisted with previous works for Turkey [7,8]. It is hard to claim consistency for SPEI analysis. However, inconsistency between SPI and SPEI drought risk levels is unpredictable. In this case, calculation procedures and differences in the parameters may play important role behind the inconsistency case. This point may lead to new researches. Furthermore, similar analysis by using different indices (i.e. Palmer Drought and Severity Index-PDSI, Surface Water Supply Index-SWSI and Crop Moisture Index -CMI etc) may explain the reason of fluctuating or inconsistencey in SPEI.
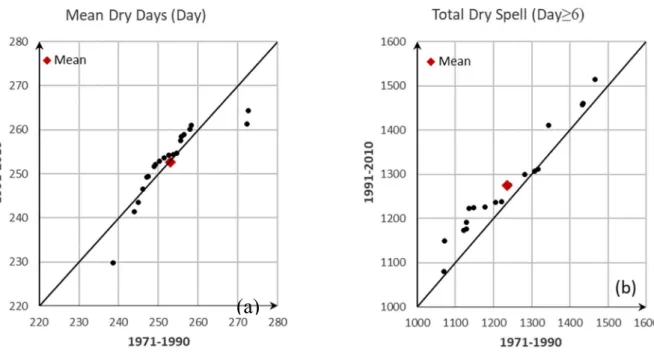
Besides all, trend behavior for dry days and dry spell counts were investigated by using Innovative-Şen trend analysis (ITA) template [33]. In Figure 7a, mean dry day counts clearly increase if two highest data values are ignored. This two point values may consist measurement errors. In holistic perspective, these data can be ignored for trend interpretation. Similar interpretation can be valid for total dry spell (days≥6) as in Figure 7b. All data scatter points fall above trendless line.
Figure 5 Changes of drought risk in different time scale and indices as a function of ΔT: a) SPI-6 for extreme drought risk b) SPI-6 for severe drought risk c) SPI-6 for moderate drought risk d) SPEI-6 for extreme drought risk e) SPEI-6 for severe
Figure 6 Changes of drought risk in different time scale and indices as a function of ΔT: a) SPI-12 for extreme drought risk b) SPI-12 for severe drought risk c) SPI-12 for moderate drought risk d) SPEI-12 for extreme drought risk e) SPEI-12 for severe
drought risk f) SPEI-12 for moderate drought risk.
Figure 7 Trend detection by Innovative-Şen Analysis for mean dry days counts (a) and total dry spell counts (b).
These results are consistent with general acceptance for drought expectation in the near future. Increases in dry spell numbers indicate that drought occurrence in Turkey may be more frequent in future than present. However, occuring time of drought can not be
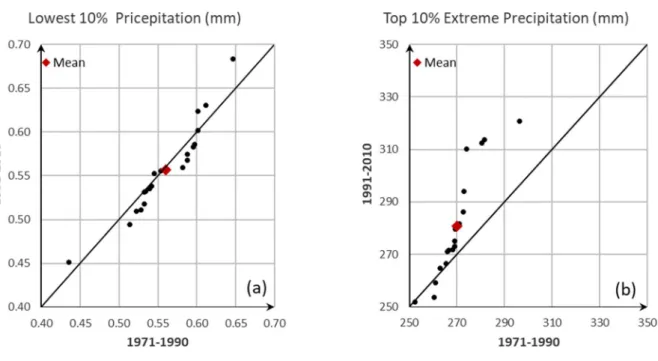
predicted by using this tren results. To evalutae temporal variability or periodicity analysis is needed. Another trend investigation method is employed for extreme precipitations (Lowest and Top 10%) as in Figure 8a and Figure 8b, respectively. It is rather hard
(a)
İsmail Dabanlı
A Climate Change Impact: Variation In Precipitation Patterns, And Increased Drought Risk In Turkey
to claim pure trend behavior for lowest 10% precipitations; however, it is obvious from Figure 8b that there is a clear increasing trend. This increasing
manner of extreme precipitations is also consistent with climate change expectations on heavy precipitations over Turkey.
Figure 8 Trend detection by Innovative-Şen Analysis (ITA) for lowest average of 10% precipitations (a) extreme average of 10% precipitations (b).
To sum up, decreases in total precipitations coupled with increases in dry days, dry spells and drought severity indices can beprecursory of drought risk for Turkey.
5. CONCLUSION
Drought risk is analyzed by using different parameters such as dry days, dry spells, precipitations (top and lowest), SPI and SPEI with respect to ΔT between 1971 and 2000 in Turkey, by using inter-annual differences. According to this analysis, dry days change (ΔDD/ΔT) converge to (-2% ±3%)/0C, while prolonged dry spells
change (ΔDS/ΔT) reach to (3% ±5%)/0C. For
precipitation ΔP/ΔT mean values converge to constant value as (-6% ±8%)/0C, (0% ±2%)/0C and (-1%
±4%)/0C for total, top 10% heavy and lowest 10%
precipitation values. Significant increases are obtained in several drought severity levels for SPI and SPEI indexes. Especially SPI analysis results are also supported by trend analysis consequences for dry days, dry spells and extreme 10% precipitations. Regarding to SPEI, it is hard to say coherency between results and expectations. Dry days, dry spells and extreme 10% precipitations analysis results can help to identify increasing trend manner based on ITA.
Overall, both interannual differences and trend analysis results indicate that drought risk might have been more extensive than today. Dry days, prolonged dry spells and increases in total precipitations might have significant role for drought risk increments in Turkey as a typical effect on climate change. To cope with drought phenomena, adaptation measures should be improved more effectively.
ACKNOWLEDGMENTS
Author wish to thank Turkish State Meteorological Service (TSMS) for sharing climatic data supply. Also, author wish to thank ananomys reviwer and editors of SAUJS for valuable assistance and contributions. Conflict of Interest: The authors declare that they have no conflict of interest.
REFERENCES
[1] E. M. Laflamme, E. Linder, Y. Pan, Statistical downscaling of regional climate model output to achieve projections of precipitation extremes. Weather and Climate Extremes. 12, 15–23, 2015.
[2] M. A. Nasef, “Using GIS and statistical methods to detect the multi-decadal variability for temperature trends on Egypt: 1960–2000.” Geographia Technica, vol. 15, no. 1, pp. 46–60, 2012.
[3] S. Solomon, K. H. Rosenlof, R. W. Portmann, J. S. Daniel, S. M. Davis, T. J. Sanford, and G.K. Plattner, “Contributions of stratospheric water vapor to decadal changes in the rate of global warming.” Science, 327: 1219–1223, 2010. [4] M. Rajeevan, J. Bhate, A. K. Jaswal, Analysis of
variability and trends of extreme rainfall events over India using 104 years of gridded daily rainfall data. Geophysical Research Letters. 35, 2008.
[5] G. Villarini, J. A. Smith, and G. A. Vecchi, “Changing frequency of heavy rainfall over the Central United States.” J. Clim., 26, 351–357, 2013.
[6] K. E. Trenberth, A. Dai, R. M. Rasmussen, and D. B. Parsons, “The changing character of precipitation, Bull. Am. Meteorol. Soc., 84, 1205–1217, 2003.
[7] İ. Dabanlı, A.K. Mishra, and Z. Şen, “Long-Term Spatio-temporal Drought Variability in Turkey.” Journal of Hydrology, 552, 779-792, 2017.
[8] U. Beyaztas, B. Bickici Arikan, B. H. Beyaztas, E. Kahya, “Construction of prediction intervals for Palmer Drought Severity Index using bootstrap.” Journal of Hydrology, 559, 461–470, 2018.
[9] J. M. Garcia-Ruiz, J. I. Lopez-Moreno, S. M. Vicente-Serrano, T. Lasanta-Martinez, and S. Begueria. “Mediterranean water resources in a global change scenario.” Earth-Science Reviews, 105(3–4): 121–139, 2011.
[10] Z. Şen, “Innovative trend analysis methodology.” J Hydrol Eng, 17(9):1042–1046, 2012.
[11] S. M. Vicente-Serrano, J. S. Gonzalez-Hidalgo, M. Luis, and J. Ravento ´s, “Drought patterns in the Mediterranean area: The Valencia region (eastern Spain).” Clim. Res., 26, 5–15, 2004.
[12] M. Piccarreta, D. Capolongo, and F. Boenzi. “Trend analysis of precipitation and drought in Basilicata from 1923 to 2000 within a southern Italy context.” International Journal of Climatology, 24: 907–922, 2004.
[13] P. M. Sousa, R. M. Trigo, P. Aizpurua, R. Nieto, L. Gimeno, and R. Garcia-Herrera. “Trends and extremes of drought indices throughout the 20th century in the Mediterra- nean.” Natural Hazards and Earth System Science 11: 33–51, 2011.
[14] A. Shabbar, W. Skinner, “Summer drought patterns in Canada and the relationship to global sea surface temperatures.” Journal of Climate. 17, 2866–2880, 2004.
[15] P. Berg, J. Haerter, P. Thejll, C. Piani, S. Hagemann, and J. Christensen, “Seasonal characteristics of the relationship between daily precipitation intensity and surface temperature.” J. Geophys. Res., 114(D18), D18102, 2009. [16] A. T. De Gaetano, “Time-dependent changes in
extreme- precipitation return-period amounts in the continental United States.” J. Appl. Meteor. Climatol., 48, 2086–2099, 2009.
[17] P. Ya. Groisman, R. W. Knight, D. R. Easterling, T. R. Karl, G. C. Hegerl, and V. N. Razuvaev, “Trends in intense pre- cipitation in the climate record.” J. Climate, 18, 1326–1350, 2005. [18] G. Lenderink, and E. Van Meijgaard, “Increase
in hourly precipitation extremes beyond expectations from temperature changes.” Nat. Geosci., 1, 511–514, 2008.
[19] S. B. Shaw, A. A. Royem, and S. J. Riha, “The relationship between extreme hourly precipitation and surface temperature in different hydroclimatic regions of the United States.” J. Hydrometeor., 12, 319–325, 2011.
[20] N., Utsumi, S. Seto, S. Kanae, E. E. Maeda, and T. Oki, “Does higher surface temperature intensify extreme precipitation?” Geophys. Res. Lett., 38, L16708, 2011.
[21] R. Wu, J. Chen, and Z. Wen, “Precipitation-surface temperature relationship in the IPCC CMIP5 models.” Advances in Atmospheric Sciences, 30(3), 766–778, 2013.
İsmail Dabanlı
A Climate Change Impact: Variation In Precipitation Patterns, And Increased Drought Risk In Turkey
[22] C. Lepore, J. T. Allen, and M. K. Tippett, “Relationships between hourly rainfall intensity and atmospheric variables over the contiguous United States.” Journal of Climate, 29(9), 3181– 3197, 2016.
[23] S. C. Liu, C. Fu, C.-J. Shiu, J.-P. Chen, and F. Wu, “Temperature dependence of global precipitation extremes.” Geophysical Research Letters, 36(17), 1–4, 2009.
[24] A. Mishra, S. C. Liu, “Changes in precipitation pattern and risk of drought over India in the context of global warming.” Journal of Geophysical Research. 119, 7833–7841, 2014. [25] M. A. O’Driscoll, and D. R. DeWalle,
“Stream-air temperature relations to classify stream-ground water interactions in a karst setting, central Pennsylvania, USA.” Journal of Hydrology, 329(1–2), 140–153, 2006.
[26] S. Sırdas, and Z. Sen, “Spatio-temporal drought analysis in the Trakya region, Turkey.” Hydrolo. Sci. J. 48 (5), 809–820, 2003.
[27] F. K. Sönmez, A. Ü. Kömüscü, A. Erkan, E. Turgu, “An analysis of spatial and temporal dimension of drought vulnerability in Turkey using the standardized precipitation index.” Natural Hazards. 35, 243–264, 2005.
[28] T.B. McKee, N.J. Doesken, J. Kleist, “The relationship of drought frequency and duration t time scales.” In: 8th Conference on Applied Climatology. American Meteorological Society, Anaheim, California, 1993.
[29] T. W. Kim, J. B. Valdés, B. Nijssen, D. Roncayolo,” Quantification of linkages between large-scale climatic patterns and precipitation in the Colorado River Basin.” Journal of Hydrology. 321, 173–186, 2006.
[30] E. Dutra, F. Wetterhall, F. Di Giuseppe, G. Naumann, P. Barbosa, J. Vogt, W. Pozzi, and F. Pappenberger, “Global meteorological drought-Part 1: Probabilistic monitoring.” Hydrology and Earth System Sciences. 18, 2657–2667 2014. [31] S.M. Vicente-Serrano, S. Begueria, J.I.
Lopez-Moreno, “A multiscalar drought index sensitive to global warming: the standardized precipitation evapotranspiration index.” J. Climate 23 (7), 1696–1718, 2010.
[32] A.K. Mishra, and V.P. Singh, “A review of drought concepts.” Journal of Hydrology, 391 (1–2), 202–216, 2010.
[33] R. Tareghian, P. F. Rasmussen, “Statistical downscaling of precipitation using quantile regression.” Journal of Hydrology. 487, 122– 135, 2013.
[34] I. Dabanli, I, “Temperature difference relationship among precipitation, dry days, and spells in Turkey”, Theor Appl Climatol, 2018. https://doi.org/10.1007/s00704-018-2649-4 [35] İ. Dabanlı, and Z. Şen, “Precipitation projections
under GCMs perspective and Turkish Water Foundation (TWF) statistical downscaling model procedures.” Theor Appl Climatol 132: 153, 2018.
![Figure 1 Observation gauges locations on Turkey mainland [34].](https://thumb-eu.123doks.com/thumbv2/9libnet/5429401.103646/4.892.60.829.335.852/figure-observation-gauges-locations-turkey-mainland.webp)