Automated Detection of Objects Using
Multiple Hierarchical Segmentations
H. G¨okhan Akc¸ay and Selim Aksoy
Department of Computer EngineeringBilkent University Bilkent, 06800, Ankara, Turkey {akcay,saksoy}@cs.bilkent.edu.tr
Abstract—We introduce an unsupervised method that com-bines both spectral and structural information for automatic object detection. First, a segmentation hierarchy is constructed by combining structural information extracted by morphological processing with spectral information summarized using principal components analysis. Then, segments that maximize a measure consisting of spectral homogeneity and neighborhood connectivity are selected as candidate structures for object detection. Given the observation that different structures appear more clearly in different principal components, we present an algorithm that is based on probabilistic Latent Semantic Analysis (PLSA) for grouping the candidate segments belonging to multiple segmen-tations and multiple principal components. The segments are modeled using their spectral content and the PLSA algorithm builds object models by learning the object-conditional probabil-ity distributions. Labeling of a segment is done by computing the similarity of its spectral distribution to the distribution of object models using Kullback-Leibler divergence. Experiments on two data sets show that our method is able to automatically detect, group, and label segments belonging to the same object classes.
I. INTRODUCTION
There is an extensive literature on classification of remotely sensed imagery where pixel level processing has been the common choice for remote sensing image analysis systems. However, even though high success rates have been published in the literature using limited ground truth data, visual inspec-tion of the results can show that most of the urban structures still cannot be delineated as accurately as expected in high resolution images.
We believe that spatial and structural information should also be used for more intuitive and accurate classification. However, image segmentation is still an unsolved problem. Even though several approaches such as region growing, Markov random field models, and energy minimization have been shown to be useful in small data sets with limited detail, no generally applicable segmentation algorithm exists.
Morphological processing has recently become a popular approach for remote sensing image analysis. For example, Pesaresi and Benediktsson [1] successfully applied opening and closing operations with increasing structuring element sizes to an image to generate morphological profiles for all pixels, and assigned a segment label to each pixel using the
This work was supported in part by the TUBITAK CAREER Grant 104E074 and European Commission Sixth Framework Programme Marie Curie International Reintegration Grant MIRG-CT-2005-017504.
structuring element size corresponding to the largest derivative of these profiles. Even though morphological profiles are sensitive to different pixel neighborhoods, the segmentation decision is performed by evaluating pixels individually without considering the neighborhood information, and the assumption that all pixels in a structure have only one significant derivative maximum occurring at the same structuring element size may not always hold.
In [2], we described a method that used the neighborhood and spectral information as well as the morphological infor-mation for segmentation. After principal components analysis (PCA), morphological profiles were generated for each PCA band separately. These operations produced a set of connected components forming a hierarchy of segments for each PCA band. Then, a measure that combined spectral homogeneity and neighborhood connectivity was designed to select mean-ingful segments at different levels of the hierarchy.
The experiments in [2] showed that the combined measure was able to detect structures in the image that were more precise and more meaningful than the structures detected by the approach in [1]. An important observation was that different structures appeared more clearly in different prin-cipal components. For example, buildings could be detected accurately in one component but roads, trees, fields and paths could be detected accurately in other components.
In this paper, we propose an unsupervised method for automatic selection of connected components corresponding to meaningful structures among a set of candidate segments from multiple hierarchical segmentations and multiple PCA bands. The input to the algorithm is a set of segmentations corresponding to different PCA bands. The goal is to find coherent groups of segments that correspond to meaningful structures. Given multiple objects/structures of interest, this setting can also be seen as a grouping problem within the space of a large number of candidate segments obtained from multiple segmentations. We use the probabilistic Latent Semantic Analysis (PLSA) algorithm [3] to solve the grouping problem.
The rest of the paper is organized as follows. Extraction of candidate segments in an image is described in Section II. The algorithm for grouping segments for object detection is presented in Section III. Experiments are discussed in Section IV and conclusions are given in Section V.
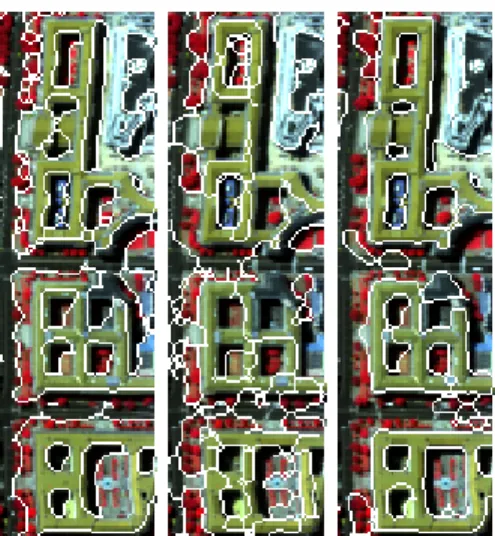
Fig. 1. Example segmentation results (overlaid as white on false color and zoomed) for the DC Mall data set. The left, middle and right images show the extracted segments in the first, second and third PCA bands, respectively.
II. HIERARCHICALSEGMENTEXTRACTION
In this section, we summarize the segmentation algorithm in [2] for completeness. Given a multi- or hyper-spectral image, first, principal components analysis (PCA) is performed to ex-tract the principal components that represent the 99% variance of the whole data. Next, morphological opening/closing by reconstruction operations are performed on each PCA band separately using structuring elements (SE) in increasing sizes. These operations produce a set of connected components forming a hierarchy of segments for each PCA band. Then, the components at different levels of the hierarchy, represented as a tree, are evaluated as candidates for meaningful structures.
Ideally, we expect a meaningful segment to be as homoge-neous as possible. However, in the extreme case, a single pixel is the most homogeneous. Hence, we also want a segment to be as large as possible. In general, a segment stays almost the same (both in homogeneity and size) for some number of SEs, and then faces a large change at a particular scale either because it merges with its surroundings to make a new structure or because it is completely lost. The size we are interested in corresponds to the scale right before this change. With this motivation, to check the meaningfulness of a node, we define a measure consisting of two factors: spectral homogeneity, which is calculated in terms of variances of multi-spectral features, and neighborhood connectivity, which is calculated using sizes of connected components. The com-ponents that optimize this measure are selected as meaningful structures in the image using a two-pass algorithm on the tree. After selecting the most meaningful structures in each principal component, an important observation is that dif-ferent structures appear more clearly in difdif-ferent principal components. For example, buildings can be detected accurately in one component but roads and vegetation can be detected accurately in other components (see Figures 1 and 2 for examples). Information from multiple PCA components must be combined for better overall detection.
Fig. 2. Example segmentation results (overloaded as white on false color and zoomed) for the Centre data set. The left, middle and right images show the extracted segments in the first, second and third PCA bands, respectively.
III. GROUPINGSEGMENTS FOROBJECTDETECTION
We present an unsupervised algorithm for automatic se-lection of segments from multiple segmentations and PCA bands in this section. The input to the algorithm is a set of hierarchical segmentations corresponding to different PCA bands. The goal is to find coherent groups of segments that correspond to meaningful structures. The assumption here is that, for a particular structure (e.g., building), the “good” seg-ments (i.e., the ones containing a building) will all have similar features whereas the “bad” segments (i.e., the ones containing multiple objects or corresponding to overlapping partial object boundaries) will be described by a random mixture of features. Therefore, the selection process is formulated as a grouping problem. The resulting groups correspond to different types of objects in the image.
A. Modeling segments
The grouping algorithm consists of three steps: extracting segment features, grouping segments, detecting objects. In the first step, each segment is modeled using the statistical summary of its pixel content. First, all pixels in the image are clustered by applying the k-means algorithm in the spectral (PCA) domain. This corresponds to quantization of the spectral values. Then, a histogram is constructed for each segment to approximate the distribution of the quantized spectral values belonging to the pixels in that segment. This histogram is used to represent the segment in the rest of the algorithm. (Note that any discrete model of the segment’s content can also be used by the grouping algorithm in the next section.)
B. Grouping segments
In this work, we use the probabilistic Latent Semantic Analysis (PLSA) algorithm [3] to solve the grouping problem. PLSA was originally developed for statistical text analysis to discover topics in a collection of documents that are represented using the frequencies of words from a vocabulary. In our case, the documents correspond to image segments, the word frequencies correspond to histograms of pixel-level
features, and the topics to be discovered correspond to the set of objects/structures of interest in the image. Russell et al. [4] used a different graphical model in a similar setting where multiple segmentations of natural images were obtained using the normalized cut algorithm by changing its parameters, and instances of segments corresponding to objects such as cars, bicycles, faces, sky, etc. were successfully grouped and retrieved from a large data set of images.
The PLSA technique uses a graphical model for the joint probability of the segments and their features in terms of the probability of observing a feature given an object and the probability of an object given the segment. Suppose there are N segments (documents) having content coming from a distribution (vocabulary) with M pixel spectral values (words). The collection of segments is summarized in an N -by-M co-occurrence table n where n(di, wj) stores the number of
occurrences of spectral value wj in segment di. In addition,
there is a latent object type (topic) variable zk associated with
each observation, an observation being the occurrence of a spectral value in a particular segment.
Let P (wj|zk) denote the object-conditional probability of
spectral value wj occurring in object zk, and P (zk|di) denote
the probability of object zk observed in segment di. The
generative model P (di, wj) = P (di)P (wj|di) for spectral
content of segments can be computed using the conditional probability P (wj|di) = K X k=1 P (wj|zk)P (zk|di). (1)
Then, the object specific spectral distribution P (wj|zk) and
the segment specific spectral distribution P (wj|di) can be used
to determine similarities between object types and segments (explained in the next section).
In PLSA, the goal is to identify the probabilities P (wj|zk)
and P (zk|di). These probabilities are learned using the
Expectation-Maximization (EM) algorithm [3]. In the E-step, the posterior probability of the latent variables are computed based on the current estimates of the parameters as
P (zk|di, wj) =
P (wj|zk)P (zk|di)
PK
l=1P (wj|zl)P (zl|di)
. (2)
In the M-step, the parameters are updated to maximize the expected complete data log-likelihood as
P (wj|zk) = PN i=1n(di, wj)P (zk|di, wj) PM m=1 PN i=1n(di, wm)P (zk|di, wm) , (3) P (zk|di) = PM j=1n(di, wj)P (zk|di, wj) n(di) . (4)
The E-step and the M-step are iterated until the difference between consecutive expected complete data log-likelihoods is less than a threshold or the number of iterations exceeds a threshold.
C. Detecting objects
After learning the parameters of the model, we want to find good segments belonging to each object type. This is done by comparing the spectral distribution within each segment, p(w|d), and the spectral distribution for a given object type, p(w|z). The similarity between two distributions can be measured using the Kullback-Leibler (KL) divergence D(p(w|d)kp(w|z)). Then, for each object type, the segments in an image can be sorted according to their KL divergence scores, and the most representative segments for that object type can be selected.
IV. EXPERIMENTS
We applied the proposed object detection algorithm to Purdue’s DC Mall and Pavia’s Centre data sets. The first step was hierarchical segment extraction. Disk structuring elements with radii from 3 to 15 were used for both opening and closing profiles for both data sets. The tree structure described in Section II was constructed for each PCA band separately, and the segments were selected from each tree independently. For the DC Mall data set, 359, 428 and 438 segments were found in the first, second, and third principal components, respectively. For the Centre data set, 767, 792 and 738 segments were found in the first, second, and third principal components, respectively.
The next step was to find coherent groups of segments that corresponded to different objects. First, all pixels in the image were clustered using their three spectral PCA values corresponding to the 99% variance. The k-means algorithm was used with k empirically selected as 20 for clustering. Then, for each segment, a histogram with 20 bins was constructed by counting the number of pixels belonging to each spectral cluster within that segment. Next, the PLSA algorithm was used to learn the spectral data distributions for the segments and the object types. The number (K) of latent object type variables (zk) was set to 50 in the experiments.
The parameters of the distribution models were learned using the EM algorithm.
In the final step, the KL divergence score between each segment and each object type was computed, and the segments were grouped as belonging to the object type where the KL score was the smallest. Segments within each group were further sorted according to these scores, and the most rep-resentative segments for each object type were selected. Since the segments were extracted from different PCA bands, some of the segments could overlap. When the overlap between two segments belonging to the same group was more than 30% of the area of one of the segments, the one with a larger KL divergence score was removed.
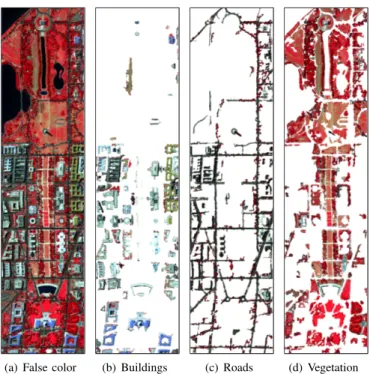
Figures 3 and 4 show example results for DC Mall and Centre data sets, respectively. Due to space limitations, the segments belonging to each of the 50 groups cannot be shown. Instead, the sub-figures b, c and d of 3 and 4 present the seg-ments belonging to the groups that mostly contain buildings, roads, and vegetation, respectively. Examination of individual groups showed that segments corresponding to objects (i.e.,
(a) False color (b) Buildings (c) Roads (d) Vegetation Fig. 3. Examples of object detection for the DC Mall data set.
“good” segments) were mostly placed into coherent groups. For example, man-made structures such as buildings placed in the same group also had very similar spectral characteristics (e.g., roofs with similar colors) and buildings in different groups had different spectral attributes. Similarly, most of the streets and paths (roads) were grouped correctly. However, there were also some minor confusion caused by shadows and small errors in the initial segmentations. We believe that including new features, in addition to the spectral bands, in the clustering of pixels for modeling the segments will eliminate most of these problems.
Overall, the results show that the proposed algorithm is able to merge the segmentation results from multiple PCA bands by grouping the segments and performing object detection by selecting the most representative segments corresponding to object classes in an unsupervised mode. Future work will include designing automatic methods for selecting the number of object types (topics) in the PLSA algorithm. We will also create object level ground truth for quantitative performance evaluation.
V. CONCLUSIONS
We described an unsupervised method for automatic se-lection of segments corresponding to meaningful structures among a set of candidate segments from multiple hierarchical segmentations. Segmentation was done by combining struc-tural information extracted by morphological processing with spectral information summarized using principal components analysis. Segments that maximized a measure consisting of spectral homogeneity and neighborhood connectivity were selected as candidate structures for object detection. The segments coming from multiple PCA bands were grouped
(a) False color (b) Buildings
(c) Roads (d) Vegetation
Fig. 4. Examples of object detection for the Centre data set.
using the probabilistic Latent Semantic Analysis algorithm where the resulting groups of coherent segments corresponded to different object types. We evaluated the proposed approach on two data sets. The experiments showed that our method is able to automatically detect and group structures belonging to the same object classes.
REFERENCES
[1] M. Pesaresi and J. A. Benediktsson, “A new approach for the morphologi-cal segmentation of high-resolution satellite imagery,” IEEE Transactions on Geoscience and Remote Sensing, vol. 39, no. 2, pp. 309–320, February 2001.
[2] H. G. Akcay and S. Aksoy, “Morphological segmentation of urban structures,” in Proceedings of 4th IEEE GRSS/ISPRS Joint Workshop on Remote Sensing and Data Fusion over Urban Areas, Paris, France, April 11–13, 2007.
[3] T. Hofmann, “Unsupervised learning by probabilistic latent semantic analysis,” Machine Learning, vol. 42, no. 1–2, pp. 177–196, January– February 2001.
[4] B. C. Russell, A. A. Efros, J. Sivic, W. T. Freeman, and A. Zisserman, “Using multiple segmentations to discover objects and their extent in image collections,” in Proceedings of IEEE Conference on Computer Vision and Pattern Recognition, vol. 2, New York, NY, June 17–22, 2006, pp. 1605–1614.