An Evaluative Study of Operation Grouping Policies
in an FMS
IHSAN SABUNCUO ˘GLU
Industrial Engineering Department, Bilkent University, 06533 Ankara, Turkey
MAHER LAHMAR
Department of Industrial Engineering, University of Houston, Houston, TX 77204, USA
Abstract. The increased use of flexible manufacturing systems to provide customers with diversified products efficiently has created a significant set of operational challenges for managers. This technology poses a number of decision problems that need to be solved by researchers and practitioners. In the literature, there have been a number of attempts to solve design and operational problems. Special attention has been given to machine loading problems, which involve the assignment of job operations and allocation of tools and resources to optimize specific measures of productivity. Most existing studies focus on modeling the problem and developing heuristics in order to optimize certain performance metrics rather than on understanding the problem and the interaction between the different factors in the system. The objective of this paper is to study the machine loading problem. More specifically, we compare operation aggregation and disaggregation policies in a random flexible manufacturing system (FMS) and analyze its interaction with other factors such as routing flexibility, sequencing flexibility, machine load, buffer capacity, and alternative processing-time ratio. For this purpose, a simulation study is conducted and the results are analyzed by statistical methods. The analysis of results highlights the important factors and their levels that could yield near-optimal system performance.
Key Words: aggregation and disaggregation policies, flexibility, flexible manufacturing systems, operation grouping
1. Introduction
A flexible manufacturing system (FMS) can be defined as a system composed of CNC machines, an automated material handling system, and a computer-controlled network that coordinates the activities of processing stations and the material-handling system. These systems are designed to process a variety of part types simultaneously. The flexibility of an FMS is primarily due to its capability of performing different operations at the same processing station combined with a material handling system, which is able to provide fast and flexible transfer of parts within the system. Since this technology entails high capi-tal investment, an effective management-and-control system is necessary for a successful implementation.
FMS management requires the optimization of several components that can be classi-fied into design and operational problems. Design problems deal with strategic decisions concerning the FMS hardware itself to meet the user goals and requirements. Operational problems deal with tactical and control decision problems such as process planning, machine
grouping, part type selection, resource allocation, and loading (Stecke, 1983). The loading problem, which is of particular interest to our study, deals with the assignment of various resources (machines, tools, fixtures, and pallets) to the operations of different part types that are already planned for production in a given planning horizon. Obviously the machine loading related problems form an important link between both strategic and operational decisions.
A vast body of literature has been dedicated to modeling and solving loading problems, more specifically to the integration of process planning and scheduling sub-problems. In process planning, design specifications are transformed into manufacturing instructions by selecting the operation sequences and assigning the processes to the appropriate machine tool, etc., whereas in scheduling, the assignment of operations to machine tools over the planning horizon is done. For instance, some researchers develop integrated models to handle the feedback information efficiently between these two functions (Zhang and Mallur, 1994; Sadeh, Laliberty, Bryant, and Smith, 1995).
Several studies consider a wide spectrum of single and mutli-objective loading problems and formulate them as mathematical programs. For instance, in a seminal paper, Stecke (1983) describes six objectives of loading problems and formulates the machine grouping and loading in FMSs as a nonlinear mixed integer program. Other studies that consider bi-objective criteria problems include Kim and Yano (1994), Tiwari, Hazarika, Vidyarthi, Jaggi, and Mukhopadhyay (1997), Sawik (1996, 1997, 1998), and Nayak and Acharya (1998). Although these studies provide analytical foundations to solve the machine loading problem, the inherent computational complexity of these mathematical models (nonlinear integer programs) makes it extremely difficult to solve these problems to optimality for reasonable size instances (Stecke, 1983). Another stream of research focuses on developing efficient heuristics to solve the loading problem for medium and large size FMSs (Berrada and Stecke, 1986; Shanker and Srinivasulu, 1989; Tiwari et al., 1997; Mukhopadhyay, Midha, and Krishna, 1992; Mukhopadhyay, Singh, and Srivastava, 1998; Kumar and Shanker, 2000; Tiwari and Vidyarthi, 2000; Vidyarthi and Tiwari, 2001).
More importantly, most models investigate the effect of operation-machine assignment on system performance independently of the degree of system flexibility, specifically rout-ing and sequencrout-ing flexibility. In general, routrout-ing flexibility is manifested in the hardware of the system and offers alternative machines to process the operations, whereas sequence flexibility primarily depends on the parts to be manufactured and offers alternative se-quences of operations to process the parts. Both flexibilities are of considerable importance for FMSs as they result in more efficient system utilization and can compensate for the negative effects of congestion and other interruptions (e.g., machine breakdown) on system performance.
Several studies focused on investigating and quantifying the impact of flexibility on system performance: Lin and Solberg (1991), Gupta and Goyal (1992), Benjaafar et al. (1995); Benjaafar and Ramakrishnan (1996a, 1996b), and Sabuncuoglu and Karabuk (1999). In all of these studies, the authors agree that flexibility improves FMS performance. More specifically, flexibility has a significant impact on system performance when the capacity of the resources is tight. However, its marginal benefit diminishes as the level of flexibility increases. Caprihan and Wadhwa (1997) assert that routing flexibility, when made available
at the cost of associated penalty on processing time, is not always beneficial. Attempts to incorporate routing flexibility into analytical models include the work of Bretthauer and Venkataramanan (1990) and Nasr and Elsayed (1990).
Another major shortcoming of most mathematical models is the inherent assumption of static deterministic manufacturing environments. In fact, these models fail to capture the congestion effect due to variability in material handling availability and processing times and ignore the effects of control policies and scheduling rules. To capture the effect of stochasticity in FMS operation, several researchers conduct simulation studies to evaluate the performance of the system under a variety of tool allocation procedures and scheduling schemes. Examples of such simulation studies include those of Hutchinson and Pflughoeft (1994), Lin and Solberg (1991), Kim and Kim (1994), Gympah and Meredith (1996), and Caprihan and Wadhwa (1997). However, these studies fall short of providing general guidelines to approach the machine loading problem.
To the best of our knowledge, there is no study to date that systematically compares operation assignment policies within an FMS. One relevant work (Kusiak, 1986), claims that the general tendency in process planning within automated systems is to take benefits from machine versatility, by assigning as many operations to one set-up as possible (i.e, aggregation). Further, no attempt has been made to examine the relative performance of FMSs under different operation grouping policies when combined with other operational factors.
In this study, we address the operation grouping aspect of machine loading. We refer to operation grouping as the degree to which the operations required to process a single part are aggregated on the same machine. In general it is more desirable to assign more operations to a versatile machine to reduce set-up times. However, the degree to which operations are aggregated on the same machine may depend significantly on other fac-tors, such as flexibility and buffer capacities. Our primary objective is not to trade-off set-ups with aggregation levels, but rather to compare relative performance of aggrega-tion levels by isolating the effect of set-ups. We believe that investigating the effect of operation grouping on the performance of an FMS is a necessary step towards the devel-opment of a general framework for identifying desirable aggregation levels for efficient manufacturing.
The organization of this paper is as follows: In Section 2 we describe the model character-istics, system considerations, experimental design, and performance measures. In Section 3 we present the simulation results. In Section 4 we relax some of the prior model assump-tions and discuss the sensitivity of the system flow-time to the introduction of set up times, machine breakdowns, and other scheduling rules. Finally, in Section 5 we discuss the major findings of this study and identify future research directions.
2. Proposed study
We examine the performance of operation grouping approaches, sequence and routing flexibilities, and their interaction with other factors such as: system load, buffer capacity, and alternative processing ratios via simulation. The experiments are conducted under various operating conditions as detailed below:
Figure 1. Layout of a hypothetical FMS.
2.1. FMS structure and model characteristics
In our study, we consider a system composed of six multi-purpose machines and a central buffer area: The system comprises a loading/unloading (L/U) station that contains a central-buffer storage area of infinite capacity and six machines. Each machine has an input and an output local buffer of finite capacity. The material handling system is composed of three identical AGVs that follow a unidirectional path with velocity of 30 unit distances per time unit and the layout configuration is composed of four squared areas, each has a length of 5 distance units (Figure 1). The same FMS has been also used in previous studies (Sabuncuoglu and Karabuk, 1998, 1999).
In our experiments, we consider four main models. The first, the base model, corresponds to the system with no flexibility (i.e., similar to a classical job shop with an automated material handling system). The second model adds sequence flexibility to the base model. The third model is an extension of the base model by including routing flexibility. The last model allows for both sequence and routing flexibility.
In general, FMSs can be classified into dedicated and flexible systems (Denzler and Boe, 1987). A dedicated system uses part specific fixtures and dedicated tool magazines. Thus, it produces a small family of similar part types with a known and limited variety of processing requirements. On the other hand, a flexible system may use a set of modular fixtures and an automated tool loading system and therefore is capable of producing a large variety of different part types. The FMS considered in this paper falls in the second category where we assume that each part requires six operations.
We consider two main operation grouping policies: aggregation and disaggregation. Ag-gregation is the process of assigning all operations of a part type to a single machine (or a single set-up). The machine does not release a part until all operations are completed. Dis-aggregation is the process of assigning operations of a part to various machines. In general, the first approach reduces set-up and transportation times, whereas the second approach aims at reducing capital investment in multi-purpose equipment and large tool magazines
to facilitate scheduling of parts and maximize processing efficiency. In Section 4.4, we introduce an intermediate policy, that we call medium aggregation, where half of the oper-ations are processed sequentially on the same machine and the other half is processed on a second machine.
In the disaggregation case, all operations are sequentially processed on each of the six machines, whereas in the aggregation case, all operations are processed in series on a single randomly selected machine for each part. In the disaggregation case, each part is assigned an operation sequence and a machine routing selected from amongst the 6! possible random combinations. Identical independent discrete uniform distributions are used to generate the required random selections. For the assumed system, machines are allowed to process only one part at a time and the loading and unloading times are assumed to be negligible. Further no scrap or rework part is considered and the machines and AGVs are assumed to be completely reliable. In Section 4.2, we relax this assumption and study the effect of machine reliability on system performance.
The parts arrive at the L/U station according to a Poisson process with a mean inter-arrival time of 10 and are then dispatched to the assigned machines. Whenever the machine is busy, the part waits in a local input buffer. The processing time for each operation on each machine is generated from an exponential distribution with mean 6, 7.5, or 8.5 depending on the machine load level. In Section 4.4, we relax this assumption by considering a truncated Normally distributed processing time. On completion, the part waits for an AGV in a local output buffer to be transported to the next machine. After each move, the AGVs park at the last visited machine until a new request is initiated. After the part visits all of the assigned machines, it leaves the system from the L/U station. The L/U station also serves as a central buffer with infinite capacity. To reduce blockings and avoid deadlocks, which can be caused by limited local buffer capacity, the part is redirected to the central buffer where it waits until a vacant place is available in the input queues. In the presence of flexibility, the initial sequence and/or routings may be altered, in which case the part can be rerouted to another machine if the dedicated local input buffer is full.
Parts waiting in local buffer areas are ranked according to the shortest processing time (SPT) rule (Egbelu and Tanchoco, 1984) and AGVs are dispatched using the shortest travel distance (STD) rule (Sabuncuoglu and Hommertzheim, 1992). Thus, whenever more than one AGV is available, the nearest transporter to the requesting machine is selected.
2.2. Experimental factors and performance metrics
In this study, we focus on six experimental factors: operation grouping (OG) (described in Section 2.1), machine load (ML), alternative processing time ratio (APTR), local buffer size (Q), sequence flexibility (SF), and routing flexibility (RF).
We test the system under three levels of ML: low, medium, and high (60%, 75%, and 85% utilization, respectively). The utilization levels are set by adjusting the mean of the pro-cessing time distributions. The alternative propro-cessing time ratio (APTR) is used to indicate whether the machines are identical or not. For the identical machine case, operations are pro-cessed on any machine with identical processing time. In the non-identical machines case, each operation can be processed efficiently on an assigned machine. The other alternative
Table 1. Experimental factor levels.
Factor Low Medium High
Operation Grouping (OG) Disaggregation – Aggregation
Machine Load (ML) 60% 75% 85%
Machine type (APTR) Identical (0%) Non-identical (15%) Non-identical (25%)
Buffer size (Q) 3 – 6
Sequence Flexibility (SF) 0 – 1
Routing Flexibility (RF) 1 – 6
machines are also capable of performing the same operation though less efficiently. The APTR levels that are set to 0%, 15%, and 25%, stand for the percentage increase in process-ing time when an operation is performed on an alternative machine. The local-buffer-size (Q) factor is simply altered by changing the local input and output queue capacities from 3 to 6 for the low and high levels, respectively.
We consider two types of flexibility: sequence and routing flexibility. Sequence flexibil-ity (SF) allows operations to have more than one predecessor or successor (i.e., different process plans for the same part), which implies that operations can be performed accord-ing to alternative sequences. The SF measure is set to 0 for no flexibility and 1 for total sequence flexibility (Rachamadugu and Nandkeolyar, 1992). Routing flexibility (RF) al-lows operations to be performed on alternative machines. It is assumed that the dedicated machine is the most efficient machine with the shortest operation time. The RF measure is defined in terms of the average number of machines on which a particular operation can be processed (Chang, Sullivan, and Bagchi, 1985). Thus, RF takes a value of 1 for the no alternative machine case and 6 for the total routing flexibility case (see Table 1). This exper-imental set up yields a 32× 24 full factorial experiment. In Section 4, we relax some of the above assumptions and measure the sensitivity of the results to other factors such as set up time, machine breakdown, different processing time distributions, and different scheduling rules. We also consider a partial grouping policy that we refer to as medium aggregation, where each part’s operations are divided into two groups and processed sequentially on two different machines.
In this study, we are primarily interested in the mean flow time of parts in the system. The mean flow time is of particular importance because it reflects the work-in-progress inventory in the system. In our model the flow time in the system is composed of eight components: waiting time in local input buffers, waiting time in local output buffers, waiting time in the central buffer, processing time, blocking time, set up time, failure time, and transportation time. In addition, we consider the flow time coefficient of variation (CV) as a second performance measure. This measure calculates the ratio of the standard deviation to the mean of flow time and reflects the magnitude of variability of part flow time in the system. In general, a highly congested system results in high variability in flow time and is therefore less desirable than a low variable system.
The simulation models are developed using SIMAN (Pegden, 1991) in a Unix environ-ment. We use Welch’s procedure (Law and Kelton, 1999) to determine the warm-up period
and then use the batch means approach to collect steady-state performance measures of the system. Common random numbers are used to provide the same experimental condition across the runs for each factor combination. To insure the independence of the randomly generated numbers, different seeds are used for different processes through the simulation models.
3. Results
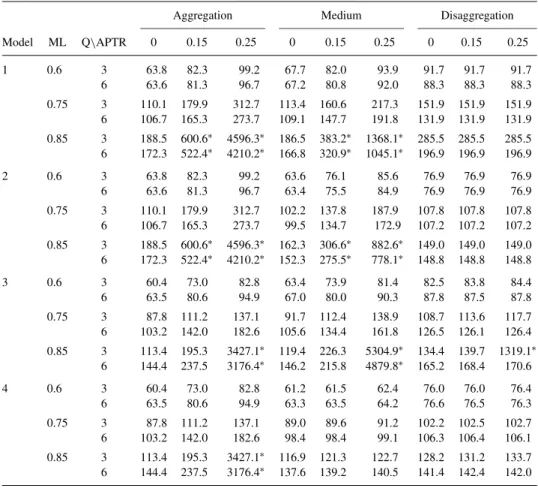
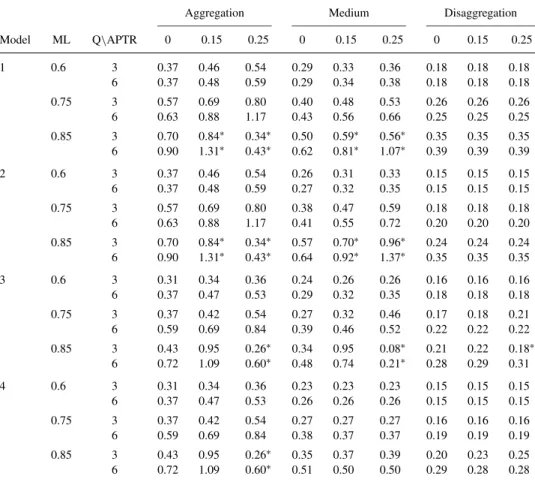
In this section, we present the results of the simulation experiments conducted for ag-gregation, disagag-gregation, and medium aggregation approaches under various operating conditions (Table 2). Representative statistical comparisons between the results for aggre-gation and disaggreaggre-gation approaches using Paired-t tests are shown in Table 3(a) and 3(b). (We note that data corresponding to the unstable systems are not considered in the analysis,
Table 2. Mean flow-time performance of the four models.
Aggregation Medium Disaggregation
Model ML Q\APTR 0 0.15 0.25 0 0.15 0.25 0 0.15 0.25 1 0.6 3 63.8 82.3 99.2 67.7 82.0 93.9 91.7 91.7 91.7 6 63.6 81.3 96.7 67.2 80.8 92.0 88.3 88.3 88.3 0.75 3 110.1 179.9 312.7 113.4 160.6 217.3 151.9 151.9 151.9 6 106.7 165.3 273.7 109.1 147.7 191.8 131.9 131.9 131.9 0.85 3 188.5 600.6∗ 4596.3∗ 186.5 383.2∗ 1368.1∗ 285.5 285.5 285.5 6 172.3 522.4∗ 4210.2∗ 166.8 320.9∗ 1045.1∗ 196.9 196.9 196.9 2 0.6 3 63.8 82.3 99.2 63.6 76.1 85.6 76.9 76.9 76.9 6 63.6 81.3 96.7 63.4 75.5 84.9 76.9 76.9 76.9 0.75 3 110.1 179.9 312.7 102.2 137.8 187.9 107.8 107.8 107.8 6 106.7 165.3 273.7 99.5 134.7 172.9 107.2 107.2 107.2 0.85 3 188.5 600.6∗ 4596.3∗ 162.3 306.6∗ 882.6∗ 149.0 149.0 149.0 6 172.3 522.4∗ 4210.2∗ 152.3 275.5∗ 778.1∗ 148.8 148.8 148.8 3 0.6 3 60.4 73.0 82.8 63.4 73.9 81.4 82.5 83.8 84.4 6 63.5 80.6 94.9 67.0 80.0 90.3 87.8 87.5 87.8 0.75 3 87.8 111.2 137.1 91.7 112.4 138.9 108.7 113.6 117.7 6 103.2 142.0 182.6 105.6 134.4 161.8 126.5 126.1 126.4 0.85 3 113.4 195.3 3427.1∗ 119.4 226.3 5304.9∗ 134.4 139.7 1319.1∗ 6 144.4 237.5 3176.4∗ 146.2 215.8 4879.8∗ 165.2 168.4 170.6 4 0.6 3 60.4 73.0 82.8 61.2 61.5 62.4 76.0 76.0 76.4 6 63.5 80.6 94.9 63.3 63.5 64.2 76.6 76.5 76.3 0.75 3 87.8 111.2 137.1 89.0 89.6 91.2 102.2 102.5 102.7 6 103.2 142.0 182.6 98.4 98.4 99.1 106.3 106.4 106.1 0.85 3 113.4 195.3 3427.1∗ 116.9 121.3 122.7 128.2 131.2 133.7 6 144.4 237.5 3176.4∗ 137.6 139.2 140.5 141.4 142.4 142.0
Table 3(a). Paired t test for model with ML= 60, APTR = 0.15, Q = 3, RF = 6, SF = 1.
Variable Obs Mean Std. dev. 95% conf. interval
Aggregation 10 73.0332 1.283226 72.1161 73.9503
Disaggregation 10 83.7764 2.187483 82.2130 85.3397
Difference 10 −10.7432 2.7882 −11.9695 −9.5169
Ho: mean (Aggregation− Disaggregation) = mean(difference) = 0
Ha: mean(difference)< 0 Ha: mean(difference)∼= 0 Ha: mean(difference)> 0
t= −12.1847 t= −12.1847 t= −12.1847
P< t = 0.0000 P> |t| = 0.0001 P> t = 1.0000
Table 3(b). Paired t test for nodel with ML = 75, APTR= 0.15, Q = 3, RF = 6, SF = 1.
Variable Obs Mean Std. dev. 95% conf. interval
Aggregation 10 142.034 6.8823 137.1154 146.9526
Disaggregation 10 126.054 5.8344 121.8843 130.2237
Difference 10 15.98 0.7837 11.2413 20.5587
Ho: mean (Aggregation 31− Disaggregation 31) = mean(difference) = 0
Ha: mean(difference)< 0 Ha: mean(difference)∼= 0 Ha: mean(difference)> 0
t= 64.1569 t= 64.1569 t= 64.1569
P< t = 0.9987 P> |t| = 0.0025 P> t = 0.0013
but are shown for illustration purpose only.) As stated earlier, we focus on four distinct models:
3.1. Model 1 (basic model)
In this model, the sequence of machines to be visited and the route of the parts are pre-assigned (i.e., classical job shop). If a part cannot find a vacant place in a machine’s input queue, it waits in the output or central buffer depending on its actual location until a place becomes available. If the machine is blocked because its output buffer is full, the part is removed from the buffer and directed towards the central buffer.
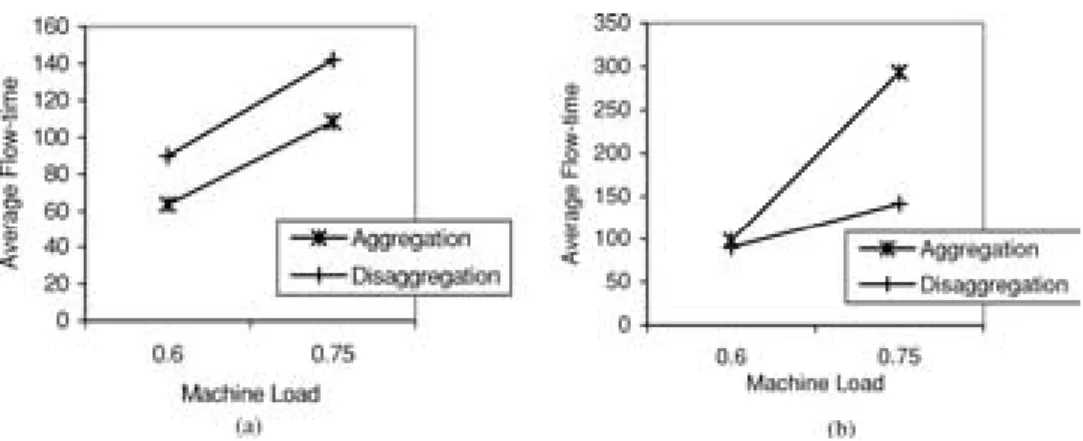
In the identical machine case, the aggregation approach performs better than the disag-gregation approach under all conditions (Figure 2(a)). This is mainly due to the increase in waiting and material handling times in the disaggregation approach. Specifically, the latter approach requires at least seven moves between stations, whereas the aggregation approach requires only two. As the machine load increases, the flow time increases under both approaches. However, the deterioration in system performance is more significant in the aggregation case, especially under low buffer-size. At high system load, longer pro-cessing times result in longer waiting times in local input buffers. Parts in the local output buffer are blocked more frequently from being transferred to the next station resulting in
Figure 2. Model 1 average flow-time for (a) APTR= 0 and (b) APTR = 0.25.
higher waiting times in output buffers, more rerouting and consequently higher central buffer waiting times.
For the non-identical machine cases, again higher machine loads result in higher flow times; however, this increase is more significant in the aggregation case (Figure 2(b)). In fact, the total processing times under aggregation are greater than that under disaggregation due to the increase in processing times on alternative machines. The system becomes overloaded at high machine load and APTR levels (i.e., the arrival rate of parts is larger than the processing rate of the system which causes queue sizes to increase indefinitely). In contrast, in the disaggregation case, part operations are dispatched to all pre-assigned machines instead of being processed on a single machine as in the aggregation case and the system does not get overloaded. Larger buffer capacities reduce the number of reroutings and therefore decrease the waiting times in the central buffer. It is interesting to note that in the aggregation case, no blocking is observed as the system does not get congested because of the continuous availability of AGVs. In the disaggregation case, however, greater blocking is observed as the system gets increasingly congested and AGVs highly utilized. However, the impact on the system flow time is minimal because of sufficient central buffer capacity.
3.2. Model 2 (sequence flexibility model)
In Model 2, the assumption of fixed operation sequence is relaxed and multiple process plans are allowed for each part (i.e., precedence constraints are relaxed). Each part is processed according to its initial sequence of operations unless the input buffer of the machine to be visited next is full. In such a case the part is rerouted to another machine with a non-full buffer.
Given that for the aggregation approach all operations required by each part are per-formed on the same machine, sequence flexibility provides the ability to change the order of operations on the same machine. Therefore, the presence of sequence flexibility does not affect the performance of the aggregation approach. In this case, the aggregation results obtained from the base model are still valid for Model 2 (see Table 2). On the contrary,
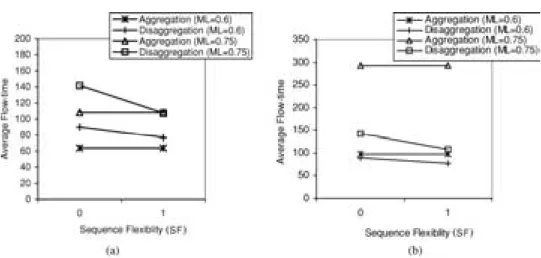
Figure 3. Model 2 average flow-time for (a) APTR= 0 and (b) APTR = 0.25.
under the disaggregation approach, SF provides a greater degree of freedom for operation sequencing which in turn reduces the number of reroutings as well as the waiting time in the central buffer. Accordingly, parts are rerouted to other designated available machines for completion of the remaining operations and therefore the mean flow time decreases.
For the identical machines case with low load level, SF improves the performance of the disaggregation approach; however, the aggregation approach continues to be a better policy under the current setting. At high system load, the disaggregation approach begins to perform better than the aggregation approach (Figure 3(a)). For the non-identical machines case, the disaggregation approach always performs better than the aggregation approach. The improved performance of disaggregation over aggregation is primarily because of the significant reduction in the local input buffers and central buffer waiting times due to sequence flexibility. The difference between the mean flow times observed under both operation grouping policies widens as the ML and APTR levels increase (Figure 3(b)).
3.3. Model 3 (routing-flexibility model)
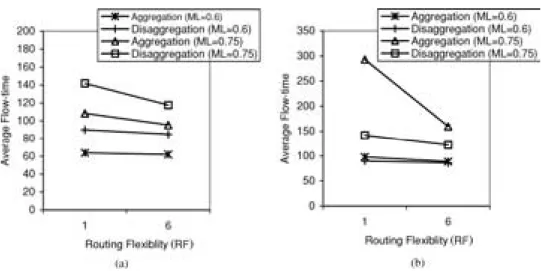
In Model 3, we relax the assumption of fixed routings and allow each part to change its routing without altering its operation sequence. Each part follows its initial routing until the next machine to be visited has a full input buffer. In such a case the operation is processed on an alternative machine with a non-full buffer. In contrast to sequence flexibility, routing-flexibility is beneficial for both the aggregation and disaggregation approaches because it permits the processing of the operations on alternative machines, thus reducing the mean waiting time for both approaches (Figure 4).
For the identical machine case, routing flexibility improves the performance of the dis-aggregation policy, although not to the extent of outperforming the dis-aggregation policy (Figure 4(a)). For the non-identical machine cases, the aggregation approach continues to outperform the disaggregation approach at some low ML level instances; however, the
Figure 4. Model 3 average flow-time for (a) APTR= 0 and (b) APTR = 0.25.
disaggregation approach becomes a better policy at high ML levels (Figure 4(b)). Since at the low load level, the local input queues tend to be shorter, the need to dispatch parts to an alternative machine is virtually absent and therefore the benefit from routing flexibility is marginal. On the contrary, as the system gets loaded, parts resort to alternative machines more frequently (i.e., make more use of the routing flexibility) because of fewer vacant buffer spaces and this in turn contributes to a larger reduction in the mean flow time under both approaches. In conclusion, as in the sequence flexibility case, routing flexibility is more effective in the highly loaded systems.
It is worth noting that the disaggregation approach in this model can perform worse than that in the basic model at the high ML and APTR levels. In fact rerouting parts to alternative machines results in longer processing times. Consequently, when the system is highly loaded, the system performance starts to deteriorate more under routing flexibility and becomes overloaded. This suggests that unlike the identical machine case, the routing flexibility in a non-identical machine system can result in longer mean flow times especially when coupled with low buffer sizes.
In Models 1 and 2, larger buffer sizes are generally more beneficial, especially for the disaggregation case. However, in Model 3 small buffer size systems turn out to have shorter mean flow times (Figure 5). This implies that small buffer size models perform better than the large buffer size models under routing flexibility. Such a result is mainly due to the machine dispatching rule that gives priority to the pre-assigned machine regardless of the number of parts in other queues (even if the queues of other alternative machines are empty). This dispatching rule initially aims at minimizing the rerouting to alternative machines and therefore reduces extra processing time. By increasing the buffer size, we allow more operations to be dispatched to their pre-assigned machine rather than to alternative machines and therefore do not contribute to balancing queue lengths. This eventually increases waiting time in the machine buffers, which can lead to poorer performance. After conducting some test runs for different buffer sizes, we found that under such operating conditions larger
Figure 5. Comparison of the performance of each model under different buffer size.
buffer size results in longer flow time. Such a result suggests that operating a system of non-identical machines under routing flexibility and high machine load can be sensitive to the dispatching policies and buffer sizes.
3.4. Model 4 (routing and sequence flexibility model)
In Model 4, parts can be processed on alternative machines and operations for the same part can have different sequences according to the machine availability and local queue lengths in the system (i.e., similar to an open shop model). Under all conditions, the combination of both routing and sequence flexibility yields better results when compared to the models under each type of flexibility alone (Table 2). As sequence flexibility does not affect the aggregation approach, the results of aggregation in Model 4 are similar to those of Model 3. Also, similar to Model 3, the small buffer size models still outperform the high buffer size models confirming our earlier observation that routing flexibility can deteriorate system performance if used with arbitrary machine dispatching rules.
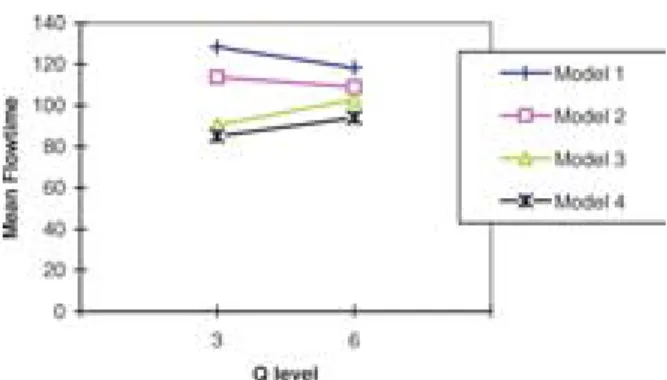
For the identical machines case, the aggregation approach performs better than disag-gregation, whereas for non-identical machines disaggregation is better than aggregation (Figure 6(a)). The difference between these two approaches widens in favor of disaggre-gation as the level of ML increases. As expected, the flow times in Model 4 are shorter than those observed in Models 2 and 3. However, the marginal effect of SF(RF) under the presence of RF(SF) is not as significant as their individual effects. In other words, flexibility has a diminishing effect on the flow time performance of the system and most benefits are realized with the introduction of one type of flexibility (Figure 6(b)).
3.5. Flow time variation
The second performance measure that we study is the flow time coefficient of variation (CV). Table 4 presents the results for the four models. (Note that only results correspond-ing to stable systems are considered in the analysis.) In general, the experimental fac-tors have similar impacts on both aggregation and disaggregation approaches. However,
Table 4. Coefficient of variation of flow time for the four models.
Aggregation Medium Disaggregation
Model ML Q\APTR 0 0.15 0.25 0 0.15 0.25 0 0.15 0.25 1 0.6 3 0.37 0.46 0.54 0.29 0.33 0.36 0.18 0.18 0.18 6 0.37 0.48 0.59 0.29 0.34 0.38 0.18 0.18 0.18 0.75 3 0.57 0.69 0.80 0.40 0.48 0.53 0.26 0.26 0.26 6 0.63 0.88 1.17 0.43 0.56 0.66 0.25 0.25 0.25 0.85 3 0.70 0.84∗ 0.34∗ 0.50 0.59∗ 0.56∗ 0.35 0.35 0.35 6 0.90 1.31∗ 0.43∗ 0.62 0.81∗ 1.07∗ 0.39 0.39 0.39 2 0.6 3 0.37 0.46 0.54 0.26 0.31 0.33 0.15 0.15 0.15 6 0.37 0.48 0.59 0.27 0.32 0.35 0.15 0.15 0.15 0.75 3 0.57 0.69 0.80 0.38 0.47 0.59 0.18 0.18 0.18 6 0.63 0.88 1.17 0.41 0.55 0.72 0.20 0.20 0.20 0.85 3 0.70 0.84∗ 0.34∗ 0.57 0.70∗ 0.96∗ 0.24 0.24 0.24 6 0.90 1.31∗ 0.43∗ 0.64 0.92∗ 1.37∗ 0.35 0.35 0.35 3 0.6 3 0.31 0.34 0.36 0.24 0.26 0.26 0.16 0.16 0.16 6 0.37 0.47 0.53 0.29 0.32 0.35 0.18 0.18 0.18 0.75 3 0.37 0.42 0.54 0.27 0.32 0.46 0.17 0.18 0.21 6 0.59 0.69 0.84 0.39 0.46 0.52 0.22 0.22 0.22 0.85 3 0.43 0.95 0.26∗ 0.34 0.95 0.08∗ 0.21 0.22 0.18∗ 6 0.72 1.09 0.60∗ 0.48 0.74 0.21∗ 0.28 0.29 0.31 4 0.6 3 0.31 0.34 0.36 0.23 0.23 0.23 0.15 0.15 0.15 6 0.37 0.47 0.53 0.26 0.26 0.26 0.15 0.15 0.15 0.75 3 0.37 0.42 0.54 0.27 0.27 0.27 0.16 0.16 0.16 6 0.59 0.69 0.84 0.38 0.37 0.37 0.19 0.19 0.19 0.85 3 0.43 0.95 0.26∗ 0.35 0.37 0.39 0.20 0.23 0.25 6 0.72 1.09 0.60∗ 0.51 0.50 0.50 0.29 0.28 0.28
∗Stands for overloaded system results.
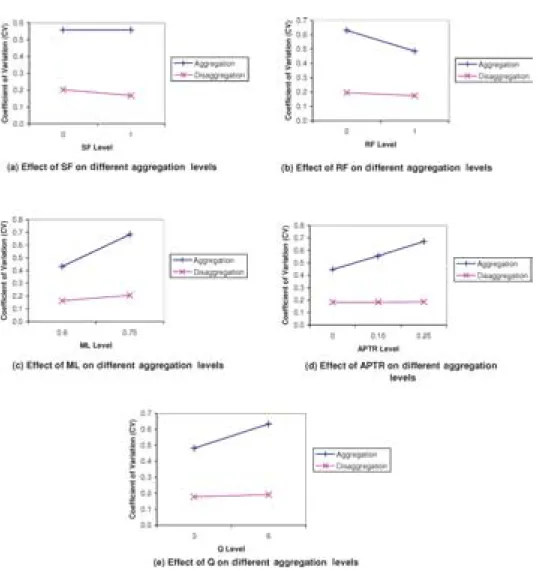
flow time variation is significantly lower for the disaggregation approach, mainly be-cause of the distribution of the operations of each part on different machines. In fact, although the mean and variation of the total processing time for all required operations is the same, the variation of total waiting times in consecutive input buffers (which con-stitutes a main component of flow time) is less than the variation of waiting time in a single input buffer. In addition, we observe that the CV under the aggregation approach is more sensitive to changes in experimental factors (other than SF) than that under the disaggregation approach (Figure 7). It appears that the pooling of all operations on a sin-gle machine makes the variation in the flow time more vulnerable to any change in the system.
As in the case of the mean flow time measure, both routing and sequencing flexibility affect the system flow time CV positively. Figure 7(b) shows that RF reduces CV more significantly under the aggregation approach. As mentioned earlier, when the initially assigned machine is not available, RF enables the part to be processed by an alternative machine. This does not only reduce the buffer waiting times, but also balances the number of parts in buffers and therefore decreases the flow time variation. Since at any observed time, machines receive more distributed load under the disaggregation approach than under the aggregation approach, machine buffers tend to be more balanced. Thus, the variability in the flow time decreases more for the aggregation approach than for the disaggregation approach. As expected, SF does not affect CV under aggregation, while the CV decreases with sequencing flexibility under the disaggregation approach (Figure 7(a)). Figures 7(c) and 7(d) shows that under the aggregation approach, the CV increases significantly with the increase in ML and APTR, whereas under the disaggregation approach, the CV is more robust to changes in system load (ML and APTR). This explains why the disaggergation approach is better suited to withstand high system loads, while the system becomes quickly unstable under the aggregation approach at similar load levels. In Figure 7(e), the CV under the aggregation approach increases more significantly with the increase in buffer size. Larger buffer sizes provide more space for parts to wait, which decreases the need for frequent resequencing and alternative rerouting. This implies that under the current machine dispatching rule, systems with large buffer sizes take less advantage of flexibility than those with small buffer sizes, and consequently have more variable flow time.
3.6. Medium aggregation level results
So far we considered only two operation grouping policies: total aggregation and total disaggregation. In this section, we further consider a medium aggregation approach such that half the operations for a part is assigned randomly to one machine and the other half is assigned to another machine. The first half of the operations is processed on the first machine and then the part waits in the local output buffer awaiting transfer to the second machine to process the remaining operations. The reader can refer to Table 2 for results.
In the medium aggregation case, sequence flexibility refers to the ability of exchanging the sequence of the two groups of operations of the same part. Routing flexibility refers to the ability to process one group of operations on an alternative machine instead of the dedicated one.
In Model 1, the medium aggregation approach performs better than the aggregation approach for high system load, while it is outperformed by the disaggregation approach for high system load. In Model 2, the medium aggregation approach performs better than the other two policies, and is only outperformed by the disaggregation approach for high system load. In Model 3, even though the performance of the medium aggregation approach is very close to that of the aggregation approach, especially at low and medium ML, it does not yield significantly better performance than the two extremes (i.e., total aggregation and disaggregation). In Model 4, the medium aggregation approach shows similar or better performance than the two grouping policies under most factor combinations.
In fact, since each part is processed on two machines, the medium aggregation approach benefits from routing and sequencing flexibility more than the aggregation approach but less than the disaggregation approach. Consequently, the APTR and ML factors affect the medium aggregation approach more than the disaggregation approach and less than the aggregation approach. On the other hand, material handling time under the medium aggregation approach is less than that under the disaggregation approach but higher than that of aggregation. The trade-off between the above effects is the main reason behind the patterns observed in our results. This implies that the most efficient grouping policy may not be total aggregation or disaggregation of operations but rather a medium aggregation level that lies between both extremes.
4. Sensitivity analysis
In Section 3, we analyzed system performance for both total aggregation and disaggregation approaches under various experimental conditions. In this section, we relax some earlier assumptions and analyze the sensitivity of the mean flow-time results to variations in system conditions.
4.1. Setup time consideration
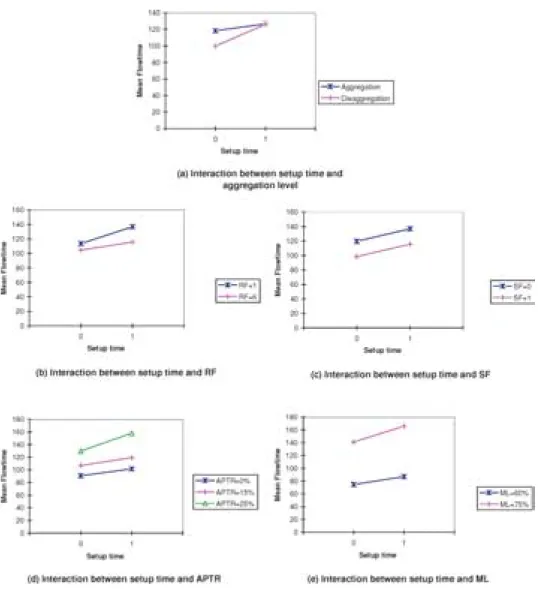
The main argument behind the effectiveness of the aggregation approach is that it requires considerably less setup time than does the disaggregation approach. In this section, we include setup times (ST) in our model to investigate the extent to which it affects the relative performances of the aggregation and disaggregation approaches. We consider a setup time that is equivalent to 25% of a part processing time. The aggregation approach requires a single setup, while the disaggregation approach requires a setup for each machine visited (six in our case).
The results of the simulation experiments indicate that the setup time factor interacts significantly with the other factors (Figure 8). As expected, the effect of setup time on system performance is more significant in the disaggregation case than in the aggregation case (Figure 8(a)). However, due to routing flexibility, there are still conditions under which the disaggregation approach outperforms the aggregation approach. Further, the system performance is less affected by setup time when it operates with both sequence and routing flexibility (Figures 8(b) and 8(c)). On the other hand, the introduction of set up times results in a larger increase in mean flow time with higher ML and APTR levels (Figures 8(d) and 8(e)).
4.2. Machine breakdowns
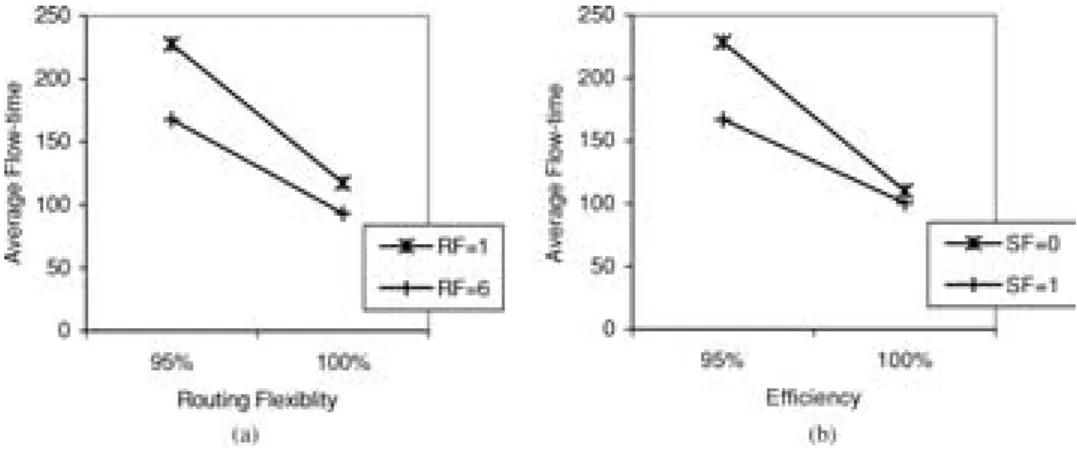
In this section, we relax the assumption of having fully reliable machines. We use the busy time distribution approach (Law and Kelton, 1999) to model machine breakdowns. In the absence of real data, Law and Kelton (1999) recommend a Gamma distribution with a shape parameter of 0.7 for the busy time distribution and 1.4 for down time distribution. The scale parameter is determined based on the desired reliability level, which is inversely
Figure 8. Interaction between set up time factor and other experimental factors.
proportional to the breakdown time ratio. Reliability e is defined as
e= µB
µB+ µD,
whereµB is the long-run mean time between failures andµDis the long run mean down
time. We consider two levels of reliability, e= 1.0 (fully reliable) and 0.95.
In Model 1, in the absence of flexibility, parts have no alternative other than waiting in queues during machine breakdowns. If a machine is down, all parts dedicated to that machine wait in the queue and therefore all remaining operations are postponed until the machine is repaired. As depicted in Figure 9, the disaggregation approach outperforms
Figure 9. Effect of efficiency on average flow time for different aggregation levels.
the aggregation approach even in the non-identical machine case. In Model 2, sequence flexibility allows the exchange of the order of operations, but not the machines. For this reason, SF does not help the aggregation approach whenever a machine is down because for each remaining operation, the assigned part must wait until it is up again. With the disaggregation approach, however, the operations may change sequence, which negates the adverse impact of machine breakdowns (Figure 10(b)). Similarly, in Model 3, routing flexibility reduces the impact of machine breakdowns for both the operation grouping approaches (Figure 10(a)). It is clear that the least effect of machine breakdowns occurs in Model 4 since parts can effectively select alternative sequences and routings to overcome the negative impact of machine breakdowns.
In summary, the impact of experimental factors on grouping policies under machine breakdowns is similar to that in the fully reliable case. However the aggregation approach is more sensitive to breakdowns than the disaggregation approach.
4.3. Sensitivity to machine scheduling rules
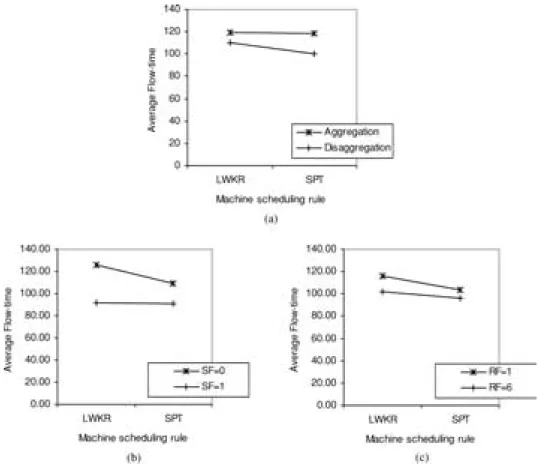
Throughout this study, we used SPT as the default machine scheduling rule (SCH) in the system. In fact, it is generally agreed that SPT minimizes the mean flow time in a system (Egbelu and Tanchoco, 1984). In this section, we test the system with LWKR, a rule that gives priority to the part with the least remaining processing time.
Recall that in the aggregation approach, all of the operations are aggregated into one operation on a single machine; i.e., the processing time on that machine is equivalent to the remaining processing time. Therefore, both rules give similar results. For the disaggre-gation case, however, SPT performs better than LWKR under all experimental conditions (Figure 11(a)). This is mainly due to the larger number of local buffers that are visited by each part under this approach. The disaggregation approach seems to be more sensitive to the changes in the machine scheduling rules under all conditions. It is interesting to note that the presence of routing and sequence flexibility reduces the sensitivity of the system to
Figure 11. (a) Machine scheduling rule vs. aggregation level. (b) Scheduling rule vs. SF. (c) Scheduling rule vs. RF.
scheduling rules (Figure 11(b) and (c)). This implies that in the presence of flexibility, the machine scheduling rules play a minor role in affecting flow time.
5. Discussion and conclusion
This study is one of the first attempts at understanding the effect of operation grouping policies in the context of machine loading problems. Our simulation results showed that the aggregation approach is not always the best policy in an FMS environment and that the tendency of manufacturing managers advocating an aggregation approach is simply based on the reduction of the number of set ups rather than on the capabilities inherent in FMSs. In addition, we showed that complete disaggregation is not always the best policy and that an intermediate grouping policy that lies between both extremes needs to be determined via simulation for best results. In general, if an FMS has identical machines and operates under low load levels and no flexibility, it is preferable to use the aggregation approach, as it is simpler to implement and schedule. However, its performance deteriorates faster than the disaggregation approach with an increase in system load level. Thus, a disaggregation approach can be well justified for FMSs composed of non-identical machines and that operate under high system load in a flexible environment.
In general, routing and sequence flexibilities do not have a significant effect on the system performance at low system loads. However, at high system loads the effect of flexibility becomes more significant and the disaggregation approach outperforms the aggregation approach. In the absence of flexibility, parts wait longer in local buffers and/or are redirected to the central buffer to wait until space is available in the input buffer of the dedicated machine. This mechanism aims to avoid blockings and deadlocks, but incurs higher waiting times in central buffers and longer material handling times, which are significant components of the flow time. Flexibility itself embeds the ability to reduce the number of blockings and therefore reduces the flow time. Thus, in the presence of flexibility, the possibility of alternative routings and sequences result in fewer parts waiting in the central buffer and in turn in the decrease of the mean flow time.
More importantly, variation in flow time for the disaggregation approach is found to be less significant than that for the aggregation approach and less sensitive to changes in other factors. This explains why the disaggregation approach better resists high machine loads when compared to the aggregation approach under similar conditions. In fact, flexibility plays a major role in stabilizing the system and avoiding overload, especially in the disag-gregation case. As a result, we can observe instances where the system is able to process all parts without being overloaded in the presence of flexibility, while it ceases to be stable in the absence of flexibility.
However, in the non-identical machine case, if appropriate control policies are not chosen, routing flexibility may contribute to the deterioration of the disaggregation approach perfor-mance. For instance, in this study we considered a machine dispatching rule that prioritizes the pre-assigned machine regardless of the length of its input queue and reroutes a part to an alternative machine only when the input buffer is full. Although, this rule minimizes processing times, when combined with routing flexibility, it can result in the deterioration of system performance for higher system loads and lower buffer size. The buffer size, a
factor that most studies usually ignore or assume to be infinite can be an important factor in improving the system performance by selecting the appropriate size for the correspond-ing system conditions. Obviously, an arbitrary machine dispatchcorrespond-ing rule cannot minimize the processing times and the waiting time simultaneously. Thus, it would be interesting to investigate the effect of a more customized dispatching heuristic on the routing flexibility in an FMS that can take both objectives into account.
In addition, our sensitivity analysis showed that system performance with the disaggre-gation approach can deteriorate with an increase in setup times. However, due to flexibility, it continues to outperform the aggregation approach for highly loaded systems. We also observed that the disaggregation approach is more robust to breakdowns, especially when coupled with flexibility. On the other hand, results revealed that the performance of the disaggregation approach is more sensitive to machine scheduling rules, although its effect becomes less significant in the presence of both routing and sequence flexibility.
Even though this work provides us with interesting observations and insights about the impact of operation grouping policies on FMS performance, the results of this study should be interpreted with respect to the considered assumptions and experimental conditions. Hence, there is definitely need for further research to test the effect of other factors. For instance, an analysis of the impact of FMS layout configuration and material handling utilization on flow time performance can be of great importance towards the design of more efficient FMSs.
In conclusion, factors such as flexibility level, buffer size, reliability, and scheduling and dispatching rules should be taken into consideration when deciding on an appropriate operation grouping policy. It is also necessary to conduct further research to determine the best factor combinations that can optimize the performance of an FMS in order to develop a general framework of the operation grouping policies.
References
Benjaafar, S., Talvage, J. J., and Ramakrishnan, R., “The Effect of Routing and Machine Flexibility on Perfor-mance of Manufacturing Systems,” International Journal of Computer Integrated Manufacturing, Vol. 8, No. 4, pp. 265–276 (1995).
Benjaafar, S. and Ramakrishnan, R., “Modeling, Measurement, and Evaluation of Sequencing, Flexibility in Manufacturing Systems,” International Journal of Production Research, Vol. 34, No. 5, pp. 1195–1220 (1996a). Benjaafar, S. and Ramakrishnan, R., “Sequence Flexibility and Performance of Manufacturing Systems,” Technical
Report, University of Minnesota (1996b).
Berrada, M. and Stecke, K. E., “A Branch and Bound Approach for Machine Load Balancing in Flexible Manu-facturing Systems,” Management Science, Vol. 32, No. 10, pp. 1316–1335 (1986).
Bretthauer, K. M. and Venkatramanan, M. A., “Machine Loading and Alternate Routing in a Flexible Manufacturing System,” Computers and Industrial Engineering, Vol. 18, No. 3, pp. 341–350 (1990).
Caprihan, R. and Wadhwa, S., “Impact of Routing Flexibility on the Performance of an FMS-A Simulation Study,”
International Journal of Flexible Manufacturing Systems, Vol. 9, pp. 273–298 (1997).
Chang, Y. L., Sullivan, R. S., and Bagchi, U., “A Bottleneck Based Beam Search for Job Scheduling in Flexible Manufacturing Systems,” Annals of Operation Research, Vol. 3, pp. 355–377 (1985).
Denzler, D. R. and Boe, W. J., “Experimental Investigation of Flexible Manufacturing System Scheduling Decision Rule,” International Journal of Production Research, Vol. 25, No. 7, pp. 979–994 (1987).
Egbelu, P. J. and Tanchoco, J. M. A., “Characterization of Automatic Guided Vehicle Dispatching Rules,”
Gupta, Y. P. and Goyal, S., “Flexibility Trade-offs in a Random Flexible Manufacturing System,” International
Journal of Production Research, Vol. 30, No. 3, pp. 527–557 (1992).
Gympah, K. A. and Meredith, J. R., “A Simulation Study of FMS Tool Allocation Procedures,” Journal of
Manufacturing System, Vol. 15, pp. 419–431 (1996).
Hutchinson, G. K. and Pflughoeft, K. A., “Flexible Process Plans: Their Value in Flexible Automation Systems,”
International Journal of Production Research, Vol. 32, No. 3, pp. 707–719 (1994).
Jaikumar, R., “Postindustrial Manufacturing,” Harvard Business Review, pp. 69–76 (November–December 1986). Kim, M. M. and Kim, Y. D., “Simulation Based Real Time Scheduling in a FMS,” Journal of Manufacturing
Systems, Vol. 13, pp. 85–93 (1994).
Kim, Y. D. and Yano, C. A., “Heuristic Approaches for Loading Problems in Flexible Manufacturing System,”
IIE Transactions, Vol. 25, No. 1, pp. 26–39 (1994).
Kumar, H. and Shanker, K., “A Genetic Algorithm for FMS Part Type Selection and Machine Loading,”
Interna-tional Journal of Production Research, Vol. 38, No. 16, pp. 3861–3887 (2000).
Kusiak, A., “Flexible Manufacturing Systems: A Structural Approach,” International Journal of Production
Re-search, Vol. 23, No. 6, pp. 1057–1073 (1985).
Kusiak, A., “Design and Management of Computer Integrated Manufacturing Systems,” Fall Industrial
Engineer-ing Conference ProceedEngineer-ings (1986).
Law, A. and Kelton, W., Simulation Modeling and Analysis, 3rd edition, McGraw-Hill, New York (1999). Lin, G. Y. and Solberg, J. J., “Effectiveness of Flexible Routing Control,” International Journal of Flexible
Manufacturing Systems, Vol. 3, Nos. 3/4, pp. 189–211 (1991).
Mukhopadhyay, S. K., Midha, S., and Krishna, V. A., “A Heuristic Procedure for Loading Problem in Flexible Manufacturing System,” International Journal of Production Research, Vol. 30, No. 9, pp. 2213–2228 (1992). Mukhopadhyay, S. K., Singh, M. K., and Srivastava, R., “FMS Machine Loading: A Simulated Annealing
Ap-proach,” International Journal of Production Research, Vol. 36, No. 6, pp. 1526–1547 (1998).
Nasr, N. and Elsayed, E. A., “Job Shop Scheduling with Alternative Machines,” International Journal of Production
Research, Vol. 28, No. 9, pp. 1595–1609 (1990).
Nayak, G. K. and Acharya, D., “Part Type Selection and Machine Loading and Part Type Volume Determination Problem in FMS Planning,” International Journal of Production Research, Vol. 36, No. 7, pp. 1801–1824 (1998).
Pegden, C. D., Shannon, R. E., and Sadowski, R. P., Introduction to Simulation Using SIMAN, 3rd edition, McGraw-Hill, New York (1991).
Rachamadugu, R. and Nandkeolyar, U., “Scheduling with Sequencing Flexibility,” Decision Sciences, Vol. 24, No. 2, pp. 315–341 (1992).
Sabuncuoglu, I. and Hommertzheim, D. L., “Experimental Investigation of FMS Machine and AGV Scheduling Rules Against the Mean Flow-Time Criterion,” International Journal of Production Research, Vol. 30, No. 7, pp. 1617–1653 (1992).
Sabuncuoglu, I. and Karabuk, S., “A Beam Search-Based Algorithm and Evaluation of Scheduling Approaches,”
IIE Transactions, Vol. 30, No. 2, pp. 179–191 (1998).
Sabuncuoglu, I. and Karabuk, S., “Rescheduling Frequency in an FMS with Uncertain Processing Times and Unreliable Machines,” Journal of Manufacturing Systems, Vol. 18, No. 4, pp. 268–283 (1999).
Sadeh, N. M., Laliberty, T. J., Bryant, R. V. E., and Smith, S. E., “Development of an Integrated Process Plan-ning/Production Scheduling Shell for Agile Manufacturing,” in Proceedings of the IJCAI-95 Workshop on
Intelligent Manufacturing (1995).
Sawik, T. J., “A Multi-Level Machine and Vehicle Scheduling in a Flexible Manufacturing System,” Mathematical
and Computer Modeling, Vol. 23, No. 7, pp. 45–57 (1996).
Sawik, T. J., “An Interactive Approach to Bi-Criterion Loading of a Flexible Assembly System,” Mathematical
and Computer Modeling, Vol. 25, No. 6, pp. 71–83 (1997).
Sawik, T. J., “A Lexicographic Approach to Bi-objective Loading of a Flexible Assembly System,” European
Journal of Operational Research, Vol. 107, No. 3, pp. 656–668 (1998).
Shanker, K. and Srinivasulu, R., “Some Solution Methodologies for Loading Problems in a Flexible Manufacturing System,” International Journal of Production Research, Vol. 27, No. 6, pp. 1019–1034 (1989).
Stecke, K. E., “Formulation and Solution of Nonlinear Integer Production Planning Problems for Flexible Manu-facturing Systems,” Management Science, Vol. 29, No. 3, pp. 446–468 (1983).
Stecke, K. E., “A Hierarchical Approach to Solving Machine Grouping and Loading Problems of Flexible Manu-facturing Systems,” European Journal of Operational Research, Vol. 24, No. 3, pp. 369–378 (1986). Tiwari, M. K., Hazarika, B., Vidyarthi, N. K., Jaggi, P., and Mukhopadhyay, S. K., “A Heuristic Solution Approach
to the Machine Loading Problem of FMS and its Petrinet Model,” International Journal of Production Research, Vol. 35, No. 8, pp. 2269–2284 (1997).
Tiwari, M. K. and Vidyarthi, N. K., “Solving Machine Loading Problem in a Flexible Manufacturing System Using a Genetic Algorithm Based Heuristic Approach,” International Journal of Production Research, Vol. 38, No. 14, pp. 3375–3384 (2000).
Vidyarthi, N. K. and Tiwari, M. K., “Machine Loading Problem of FMS: A Fuzzy-Based Heuristic Approach,”
International Journal of Production Research, Vol. 39, No. 5, pp. 953–979 (2001).
Zhang, H. and Mallur, S., “An Integrated Model of Process Planning and Production Scheduling,” International