COST-EFFECTIVE PRODUCTION OF BIOLOGICAL MATERIALS FOR FOOD APPLICATIONS
A THESIS
SUBMITTED TO THE MATERIALS SCIENCE AND NANOTECHNOLOGY
PROGRAM OF GRADUATE SCHOOL OF ENGINEERING AND SCIENCE OF BILKENT UNIVERSITY
IN PARTIAL FULFILLMENT OF THE REQUIREMENTS
FOR THE DEGREE OF
MASTER OF SCIENCE
By DİREN HAN
I certify that I have read this thesis and that in my opinion it is fully adequate, in scope and in quality, as a thesis of the degree of Master of Science.
………
Assist. Prof. Dr. Turgay Tekinay (Advisor)
I certify that I have read this thesis and that in my opinion it is fully adequate, in scope and in quality, as a thesis of the degree of Master of Science.
……….
Assist. Prof. Dr. Turgay Çakmak
I certify that I have read this thesis and that in my opinion it is fully adequate, in scope and in quality, as a thesis of the degree of Master of Science.
……….
Prof. Dr. İsmail Hakkı Boyacı
Approved for the Graduate School of Engineering and Science: ……….
Prof. Dr. Levent Onural
iii
ABSTRACT
COST-EFFECTIVE PRODUCTION OF BIOLOGICAL MATERIALS FOR FOOD APPLICATIONS
Diren Han
M.S. in Materials Science and Nanotechnology
August, 2012
This thesis consists of two chapters; in the first chapter response surface optimization of the production of a potential probiotic strain was studied by using bioreactors and in the second chapter screening of biosurfactant producing microorganisms was carried out followed by the purification and characterization of the biosurfactant produced.
Probiotics are live microorganisms that when administered in adequate amounts are favorable to their host. They are used on livestock to enhance the growth of animals, improve the efficiency of feed conversion and to decrease mortality rate. Therefore, it is important to produce these microorganisms in high amounts. However, process economics is a problem in large scale production of the microorganisms. Main factors that affect the process economics are the growth medium of the organism and the process conditions. Therefore, optimizing the composition of the growth media and cultivation conditions are of crucial importance in large scale production. In this study, optimization of
iv
growth media composition and cultivation conditions of a novel probiotic strain, Bacillus pumilus STF26, was done. Factors optimized were temperature, pH and the concentrations of dextrose as carbon source, yeast extract as nitrogen source, KH2PO4 and MgSO4.7H2O. Response surface methodology was used to
optimize the parameter and the optimum values are found to be 30.9 °C, 6.9, 20 % (w/v), 1.526 % (w/v), 0.1 % (w/v) and 0.5 % (w/v) for temperature, pH and the concentrations of dextrose, yeast extract, KH2PO4 and MgSO4.7H2O,
respectively. Maximum biomass at optimum conditions was 10.42 g/L which is nearly 2.5 times higher when compared to the one obtained by using LB medium at optimized temperature and pH values.
In the second chapter, production and characterization of a biosurfactant produced by a novel strain of Staphylococcus xylosus, STF1, was studied. Biosurfactants are surface active agents that have a broad range of applications in different industries and they have several advantages over their chemically synthesized counterparts. However, they cannot compete economically with synthetic surfactants due to their high production cost, the difficulties in downstream processing and the lack of overproducing strains. In this study a novel strain that produces biosurfactant, STF1, was isolated and the biosurfactant was characterized by using mass spectrometry and Fourier transform infrared (FTIR) spectroscopy. FTIR results indicated the lipopeptide nature of the biosurfactant produced by this strain. Moreover, the mass of the purified biosurfactant was 931.9550 (m/z).
v
Keywords: probiotics, optimization, Response surface methodology, Bacillus pumilus, biosurfactants, lipopeptides, Staphylococcus xylosus
vi
ÖZET
GIDA UYGULAMALARI İÇİN UYGUN MALİYETLİ BİYOLOJİK MALZEME ÜRETİMİ
Diren Han
Malzeme Bilimi ve Nanoteknoloji Programı, Yüksek Lisans
Ağustos, 2012
Bu tez çalışması iki bölümden oluşmaktadır; ilk bölümde biyoreaktörler kullanılarak yeni bir probiyotik bakteri suşu üretiminin tepki yüzey optimizasyonu çalışılmış ve ikinci bölümde de biyosürfaktan üreten mikrooraganizma taraması yapılmış, daha sonra da bu biyosürfaktanın saflaştırılması ve karaterizasyonu çalışılmıştır.
Probiyotikler, gerekli miktarda uygulandığında konaklarına yararlı olan canlı mikroorganizmalardır. Bu mikroorganizmalar çiftlik hayvanlarında büyümeyi artırmak, yemin verime dönüşümünü artırmak ve ölüm oranını azaltmak amacıyla kullanılmaktadır. Bu nedenle, bu mikrooragnizmaların yüksek miktarda üretimi önemlidir; fakat bu aşamada üretim maliyetinin yüksek olması bir sorun olmaktadır. Üretim maliyetine etki eden başlıca faktörler mikroorganizmaların büyümesi için gerekli olan besi yeri ve üretim koşullarıdır. Bu nedenle yüksek miktarda üretim yaparken, kullanılan besi yerinin içeriğinin ve üretim koşullarının optimizasyonun yapılması çok önemlidir. Bu çalışmada, yeni bir Bacillus pumilus probiyotik suşu olan STF26 mikroorganizmasının besi yeri içeriğinin ve büyüme koşullarının optimizasyonu yapılmıştır.
vii
Optimizasyonu yapılan faktörler; sıcaklık, pH ve karbon kaynağı olarak kullanılan dekstroz, azot kaynağı olarak kullanılan maya özütü, KH2PO4 ve
MgSO4.7H2O konsantrasyonlarıdır. Bu faktörlerin optimizasyonun yapılmasında
tepki yüzey yöntemi kullanılmış ve optimum değerler sırasıyla sıcaklık, pH ve dekstroz, maya özütü, KH2PO4 ve MgSO4.7H2O konsantrasyonları için 30.9 °C,
6.9, 20 % (ağırlık/hacim), 1.526 % (ağırlık/hacim), 0.1 % (ağırlık/hacim) and 0.5 % (ağırlık/hacim) olarak bulunmuştur. Optimum koşullar kullanıldığında elde edilen en yüksek biyokütle 10.42 g/L olarak bulunmuştur ve bu değer optimum sıcaklık ve pH kullanılıp besi yeri olarak LB kullanıldığında elde edilen değerin yaklaşık 2.5 katıdır.
Tez çalışmasının ikinci bölümünde ise yeni bir Staphylococcus xylosus suşu olan STF1 tarafından üretilen biyosürfaktanın saflaştırılması ve karaterizasyonu çalışılmıştır.
Biyosürfaktanlar yüzey aktif malzemeler olup farklı endüstrilerde geniş bir kullanım alanına sahiptirler. Ayrıca biyosürfaktanların kimyasal yöntemlerle sentezlenmiş benzerlerine göre pek çok avantajları vardır. Ancak üretimlerinin yüksek maliyetli, saflaştırma işlemlerinin zor ve yüksek miktarda biyosürfaktan üreten suşların kısıtlı olması nedenleriyle biyolojik sürfaktanlar ekonomik olarak kimyasal sürfaktanlarla yarışamamaktadırlar. Bu çalışmada biyosürfaktan üreten yeni bir bakteri suşu olan STF1 ile çalışılmış ve üretilen bu biyosürfaktanın kütle spektrometresi ve FTIR kullanılarak karaterizasyonu yapılmıştır. Sonuçlara göre elde edilen biyosürfaktan bir lipopeptit yapısındadır ve kütlesi 931.9550 (kütle/yük) olarak bulunmuştur.
viii
Anahtar Kelimeler: probiyotikler, optimizasyon, tepki yüzey metodu, Bacillus pumilus, biyosürfaktanlar, lipopeptitler, Staphylococcus xylosus
ix
ACKNOWLEDGEMENT
I would like to express my deep gratitude to my supervisor Assist. Prof. Dr. Turgay Tekinay for his guidance, support and encouragement during the course of this research.
I would like to thank to my dear friends Özgün Candan Onarman Umu and Pınar Angün for all their support during this study and for their generous and unfailing friendship.
I would like to thank to Selma Bulut for her support in SEM imaging, Nalan Uysal Yazıcıoğlu for her guidance in the use of Minitab program, Zeynep Erdoğan for her help in HPLC studies and Zeynep Ergül Ülger for her guidance and support in the laboratory of sustainable technologies.
I would like to thank to my group members Turgay Çakmak, Pınar Angün, Özgün Candan Onarman Umu, Burcu Gümüşçü, Ömer Faruk Sarıoğlu, Berna Şentürk, Ebuzer Kalyoncu, Ahmet Emin Topal, Alper Devrim Özkan, Tolga Tarkan Ölmez, Pelin Tören and Ayşe Özdemir. It was wonderful to work with them.
I would also like to thank to UNAM (National Nanotechnology Research Center) for its financial support.
Finally, I would like to thank to my parents and my sister for their endless love, support and understanding. I cannot thank you enough.
x
TABLE OF CONTENTS
ABSTRACT ... iii ÖZET ... vi ACKNOWLEDGEMENT ... ix TABLE OF CONTENTS ... xLIST OF FIGURES ... xiii
LIST OF TABLES ... xvi
CHAPTER 1 ... 1
Response Surface Optimization of the Cultivation Conditions and the Composition of Growth Medium of a Novel Potential Probiotic Strain Bacillus pumilus STF26 ... 1
1.1. INTRODUCTION ... 1
1.1.1. Probiotics ... 1
1.1.2. Experimental Design and Optimization by Response Surface Methodology ... 4
1.1.3. Aim of the Present Study ... 9
1.2. MATERIALS AND METHODS ... 11
1.2.1. Microorganism ... 11
xi
1.2.3. Experimental Design and Optimization by Response Surface
Methodology ... 14
1.2.4. Experimental Validation of the Optimized Conditions ... 17
1.2.5. Analysis ... 18
1.3. RESULTS AND DISCUSSION ... 20
1.3.1. Optimization of Temperature, pH and Carbon Source Concentration by Response Surface Methodology ... 20
1.3.2. Optimization of Nitrogen Source, KH2PO4 and MgSO4.7H2O Concentrations by Response Surface Methodology ... 32
1.4. CONCLUSION AND FUTURE ASPECTS ... 46
CHAPTER 2 ... 47
Production and Characterization of a Biosurfactant Produced by a Novel Staphylococcus xylosus Strain ... 47
2.1. INTRODUCTION ... 47
2.1.1. Surfactants ... 47
2.1.2. Biosurfactants ... 49
2.1.3. Aim of the Study ... 54
2.2. MATERIALS AND METHODS ... 55
2.2.1. Microorganism and Growth Conditions ... 55
2.2.2. Drop Collapse Oil Assay ... 55
xii
2.2.4. Biosurfactant Recovery and Purification ... 56
2.2.5. Characterization of the Purified Biosurfactant ... 57
2.3. RESULTS AND DISCUSSION ... 58
2.3.1. Drop Collapse Oil Assay ... 58
2.3.2. Hemolysis ... 60
2.3.3. Biosurfactant Recovery and Purification ... 61
2.3.4. Characterization of the Purified Biosurfactant ... 62
2.4. CONCLUSION AND FUTURE ASPECTS ... 66
xiii
LIST OF FIGURES
Figure 1. Three factor Box-Behnken design with coded units ... 8 Figure 2. Response surface plots of (a) temperature and pH, (b) pH and carbon
source concentration, and (c) temperature and carbon source concentration on biomass production of Bacillus pumilus STF26 by holding other factors constant at middle point of the Box-Behnken design ... 25
Figure 3. Contour plots of (a) temperature and pH, (b) pH and carbon source
concentration, and (c) temperature and carbon source concentration on biomass production of Bacillus pumilus STF26 by holding other factors constant at middle point of the Box-Behnken design ... 27
Figure 4. (a) Normal probability plot, (b) residual plot, (c) residual frequency
plot, (d) distribution plot of the residuals throughout the experiments of first optimization ... 29
Figure 5. Optimization plot of Equation 3 ... 31 Figure 6. Time course of STF26 cultivation using optimized dextrose
concentration, temperature and pH ... 32
Figure 7. Response surface plots of (a) nitrogen source concentration and
KH2PO4 concentration (b) KH2PO4 concentration and MgSO4.7H2O
concentration, and (c) nitrogen source concentration and and carbon source concentration on biomass production of Bacillus pumilus STF26 by holding other factors constant at middle point of the Box-Behnken design ... 38
xiv
Figure 8. Contour plots of (a) nitrogen source concentration and KH2PO4
concentration (b) KH2PO4 concentration and MgSO4.7H2O concentration, and
(c) nitrogen source concentration and and carbon source concentration on biomass production of Bacillus pumilus STF26 by holding other factors constant at middle point of the Box-Behnken design ... 40
Figure 9. (a) Normal probability plot, (b) residual plot, (c) residual frequency
plot, (d) distribution plot of the residuals throughout the experiments of second optimization ... 42
Figure 10. Optimization plot of Equation 4 ... 43 Figure 11. Time course of STF26 cultivation using optimized yeast extract
concentration (%, w/v), KH2PO4 concentration (%, w/v), MgSO4.7H2O
concentration (%, w/v) together with optimized dextrose concentration, temperature and pH ... 44
Figure 12. Time course of STF26 cultivation using LB broth (Sigma) at
optimized temperature and pH ... 45
Figure 13. Commonly used surfactants ... 49 Figure 14. Chemical structure of most studied biosurfactants ... 51 Figure 15. Drop collapse oil assay result of STF1. (a) supernatant of E.coli as
negative control, (b) supernatant of STF1, (c) 1 % SDS as positive control ... 58
Figure 16. Phylogenetic tree of STF1 ... 59 Figure 17. SEM image of STF1 ... 59
xv
Figure 18. Side views of the droplets from (a) supernatant of E. coli (negative
control), (b) supernatant of STF1 on motorine ... 60
Figure 19. Hemolytic activity result of STF1 ... 60
Figure 20. Preparative HPLC peaks of the foam sample ... 61
Figure 21. Preparative HPLC peak of the sample carrying biosurfactant ... 62
Figure 22. MS spectrum of the purified biosurfactant sample ... 63
xvi
LIST OF TABLES
Table 1. Commercial Bacillus probiotic products ... 3
Table 2. Useful Box-Behnken Designs ... 7
Table 3. Experimental design for biomass production of STF26 ... 13
Table 4. Box- Behnken response surface method design parameters ... 16
Table 5. Box-Behnken design matrix of the first optimization with three variables in coded and uncoded units and with the response, biomass ... 21
Table 6. Response surface regression results for first optimization ... 23
Table 7. Box-Behnken design matrix of the second optimization with three variables in coded and uncoded units and with the response, biomass ... 34
Table 8. Response surface regression results for first optimization ... 36
1
CHAPTER 1
Response Surface Optimization of the Cultivation Conditions
and the Composition of Growth Medium of a Novel Potential
Probiotic Strain Bacillus pumilus STF26
1.1. INTRODUCTION
1.1.1. Probiotics
The widespread and intense use of antibiotics for therapeutic purposes has led to a considerable increase in the number of antibiotic-resistant bacteria, resulting in occurrence of serious and hard-to-treat infections in both humans and livestock (4, 5, 10). Therefore, there has been an increasing concern about the use of antibiotics and they are not permitted to be used as feed additives in livestock (1, 38, 48). European Parliament and the Council of the European Union encourage the development of alternative products to replace antibiotics as feed supplements for growth promotion (1, 48). Thus, researchers and feed companies have started a search for alternative products to prevent and control infectious diseases (10, 48). An effective and safe alternative to antibiotic implementation is the use of probiotics which protect the animal from pathogens by improving the microbial balance in the gastrointestinal tract to exclude potentially harmful bacteria (10, 31, 38, 48).
Probiotics are live microorganisms which when administered in adequate amounts are favorable to their host (11, 27). They influence the health of host
2
organisms by preventing the growth of pathogenic microorganisms, improving the intestinal microbial balance thereby leading to improved nutritional absorption, promoting digestion and feed intake and inducing the immune system (16, 23, 27). Therefore, the use of probiotics on livestock enhances the growth of animals, improves efficiency of feed conversion and decreases the rate of mortality (1, 4).
Ideal probiotic microorganisms should posses some characteristics. They should be non-pathogenic and non-toxic, should improve growth of the host animal, and should be stable and active during processing and storage. In addition, probiotic microorganisms should be able to survive and continue their metabolic activities in gastrointestinal conditions and they should produce compounds that inhibit the growth of pathogenic microorganisms (23, 38).
Bacteria from different genera are currently used as probiotics, including Bacillus, Bifidobacterium, Enterococcus, Escherichia, Lactobacillus, Lactococcus and Streptococcus species (38). Moreover, some yeast species such as S. cerevisiae are used as probiotics (27).
The most common probiotic species used in humans are Lactobacillus and Bifidobacterium species, while Bacillus, Enterococcus, and Saccharomyces species are mostly used in livestock (38). Among those, Bacillus species are more preferable because they are spore-formers, have extreme resistances to heat, chemicals and other stresses (9, 10, 36, 50), Bacillus spores can survive in harsh pH conditions of the gastric fluids (11) and reach the small intestine, making them better suitable for use as feed supplements. In addition, they can be kept for a long time in desiccated form without any loss of viability (16, 30).
3
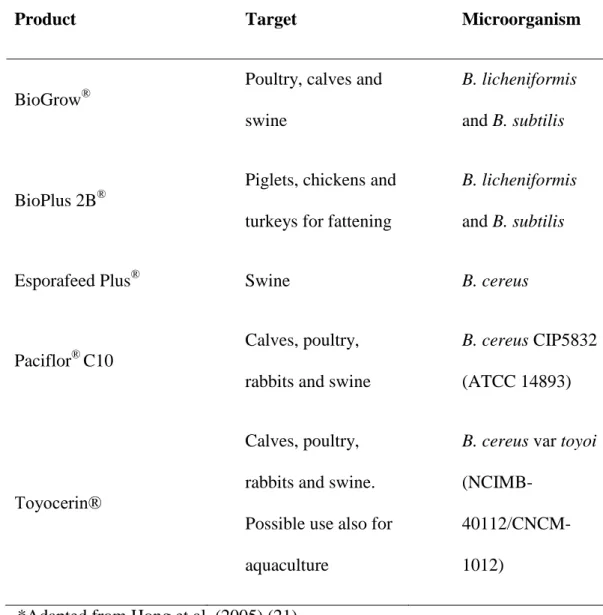
Among the genus Bacillus the most widely researched and used species with respect to potential probiotics for animals are B. subtilis, B. clausii, B. cereus, B. coagulans and B. licheniformis (11). A number of Bacillus probiotics are commercially available on the market such as BioPlus 2B® and Toyocerin® (21) (Table 1); however, there is always a need for effective and novel probiotic strains with high antimicrobial activity.
Table 1. Commercial Bacillus probiotic products*
Product Target Microorganism
BioGrow®
Poultry, calves and swine
B. licheniformis and B. subtilis
BioPlus 2B®
Piglets, chickens and turkeys for fattening
B. licheniformis and B. subtilis
Esporafeed Plus® Swine B. cereus
Paciflor® C10
Calves, poultry, rabbits and swine
B. cereus CIP5832 (ATCC 14893)
Toyocerin®
Calves, poultry, rabbits and swine. Possible use also for aquaculture
B. cereus var toyoi
(NCIMB- 40112/CNCM-1012)
4
In this study, a B. pumilus strain isolated from bovine chyme, STF26, was used. STF26 has high antimicrobial activity besides its other probiotic characteristics and therefore is a good candidate of probiotics to be used in animal feed supplements.
1.1.2. Experimental Design and Optimization by Response
Surface Methodology
In many types of experiments, the common objective is to determine the relationship between a response and a set of factors of interest to the researcher. This goal is accomplished by constructing a model that describes the response over the applicable ranges of the factors affecting to the response (29).
Response surface methodology (RSM) is a group of mathematical and statistical techniques which is used to build an empirical model relating a response and the factors that affect it (7, 13, 32). The ultimate goal of the RSM is to optimize the operating conditions of a system or to determine the region where operating conditions are satisfied (32).
When statistical techniques are not used in the design of experiments, the test results are often inconclusive or misleading (29). Some of the potential problems that might occur when statistical considerations are not incorporated with the design of experiments are listed in Mason et al. (1989) (29):
masking of factor effects due to experimental variations,
misleading in the experimental conclusions due to the uncontrolled factors,
5
wasteful or inconclusive results due to false principles of efficiency, and
insufficiency in achievement to scientific objectives with one-factor-at-a-time designs.
In many industrial applications the fitted model is referred to as a response surface. A response surface is the geometric representation of a response as a function of factors affecting it (29). According to Mason et al. (1989) (29), designing experiments in order to study or fit response surfaces is important for several reasons, including the following:
The response function is defined in a region that the experimenter is interested in,
sensitivity of the response to the factors of interest could be determined by using statistical analysis,
factor levels could be determined for optimum response (maximum or minimum), and
factor levels could be determined for simultaneously optimizing several responses.
There are several different types of designs to fit a response surface. Complete and fractional factorial designs are extremely useful to determine the location of the optimum response (29). However, all factorial designs do not have the property of being rotatable. 2k complete factorial designs are all rotatable, but 3k factorials are not. In order a design to be rotatable, the design points should construct a regular geometric figure such as a cube. Rotatable designs have the property of equal precision regardless of distance, which means that the standard
6
deviation of the fitted value is the same for any distance from the center of the design. This is a desirable property since it is not usually known which direction from the center point will be of the later interest. Rotatable designs make the fitted values precise without being affected by the direction, only by the distance from the center point (35). Fortunately, there are classes of designs to be used as alternatives to 3k factorial designs which do not have the property of being rotatable.
Two special classes of designs serving as alternatives to 3k factorial designs are central composite designs and Box-Behnken designs. Both of these designs are fractions of the 3k factorials, but they can be made rotatable and they make more efficient use of the experimental runs than 3k factorials. Efficiency is achieved by reducing the number of factor-level combinations from the one required using complete or fractional factorial experiments.
In this study, Box-Behnken experimental design was used to determine experimental runs.
1.1.2.1. Box-Behnken Designs
The Box-Behnken design is an alternative to the 3k factorials and since it is the composition of 2k factorials with incomplete block designs, this design makes efficient use of the experimental units. Moreover, Box-Behnken designs are rotatable which makes the fitted values precise without being affected by the direction (29, 35). Useful Box-Behnken designs are listed in Table 2.
7
Table 2. Useful Box-Behnken Designs*
No. of Factors
Coded Factor Levels No. of
Points 1 2 3 4 5 3 ±1 ±1 0 4 ±1 0 ±1 4 0 ±1 ±1 4 0 0 0 3 15 4 ±1 ±1 0 0 4 ±1 0 ±1 0 4 ±1 0 0 ±1 4 0 ±1 ±1 0 4 0 ±1 0 ±1 4 0 0 ±1 ±1 4 0 0 0 0 3 27 5 ±1 ±1 0 0 0 4 ±1 0 ±1 0 0 4 ±1 0 0 ±1 0 4 ±1 0 0 0 ±1 4 0 ±1 ±1 0 0 4 0 ±1 0 ±1 0 4 0 ±1 0 0 ±1 4 0 0 ±1 ±1 0 4 0 0 ±1 0 ±1 4 0 0 0 ±1 ±1 4 0 0 0 0 0 6 46 *Adapted from Mason et al. (1989) (29)
8
The schematic illustration of the three-factor Box-Behnken design is shown in Figure 1. Box-Behnken designs are more preferable to the face-centered central composite designs since they require fewer experimental runs and they are rotatable. The total number of experimental runs required for this design is 15, while this number is 17 for a central composite design with the same number of repeats at the center of the design and 27 for a 33 factorial design without repeats (29).
Figure 1. Three factor Box-Behnken design with coded units
As shown in Figure 1, the design points of a Box-Behnken design are either on a sphere or at the center of the sphere not on the extremes of the cubic region. This property of the design makes it more advantageous when the points on one
9
or more corners of the cube are expensive or impossible to test due to physical restrictions on the experimentation (29).
1.1.3. Aim of the Present Study
Our earlier studies suggest that STF26, a strain of Bacillus pumilus isolated from bovine chyme, is a potential probiotic strain with high antimicrobial activity. This isolate could be used in animal feed supplements to improve the health of animals. Therefore, it is important to produce the biomass of this bacterium in high amounts.
The main concern in scaling up is the process economics. Growth media and process conditions are of crucial importance in microbial production since they considerably affect overall process economics. Therefore, optimizing the composition of the growth media and cultivation conditions has gained increasing attention.
Response surface methodology (RSM) is widely used in optimization of media composition and process parameters for microorganism growth (19, 39, 46). It is based on fitting a polynomial equation to the experimental data and is an effective method to analyze the responses affected by many factors and their interactions (14, 19). It accurately describes the overall process by generating the mathematical method (20). Moreover, RSM is more advantageous than the conventional one-factor-at-a-time method, since it is less time-consuming and it also analyzes the interactive affects among the variables tested (19, 20, 41, 42, 46).
10
In this study, RSM technique was used to maximize the biomass of STF26 and the factors optimized were concentrations of nitrogen source, KH2PO4, MgSO4.7H2O, carbon source, pH and temperature.
11
1.2. MATERIALS AND METHODS
1.2.1. Microorganism
A potential probiotic microorganism, STF26, was used in this study. STF26 is a strain of Bacillus pumilus which was isolated from bovine chyme and it has high antimicrobial activity against a number of bacteria including S. enterica, K. pneumoniae, P. aeruginosa and S. aureus.
The strain was streaked on LB agar and stored at 4 ºC to maintain viability. The plates were renewed monthly. For long term storage, the microorganism was maintained at -80 °C in 30% (v/v) glycerol. When fresh samples are required, stock culture was sub-cultured into 50-mL Erlenmeyer flasks containing 10 mL LB broth and incubated overnight at 37 °C, 125 rpm.
For bioreactor studies, 200 μL of fresh sample was inoculated into 100-mL Erlenmeyer flask containing 20 mL LB broth and incubated overnight at 37 °C, 125 rpm. Then this culture was transferred into 2-L growth medium in 5-L bioreactor (Sartorius Stedim Biotech.).
1.2.2. Medium Composition and Cultivation Conditions
The cultivation medium used in this study consisted of dextrose (Roquette Frères), yeast extract (Sigma-Aldrich), KH2PO4 (Sigma-Aldrich) and
MgSO4.7H2O (Sigma-Aldrich).
In the first optimization, concentration of dextrose was varied according to the experimental design (Table 3). The amount of yeast extract, KH2PO4 and
12
MgSO4.7H2O were constant for the first optimization as 20 g/L, 2 g/L and 1 g/L
respectively. pH and temperature of the process were also varied according to the requirement of each experimental run (Table 3). pH was measured by using a pH electrode (Hamilton) and adjusted by adding 4 N NaOH and 1N HCl solutions by using peristaltic pumps.
13
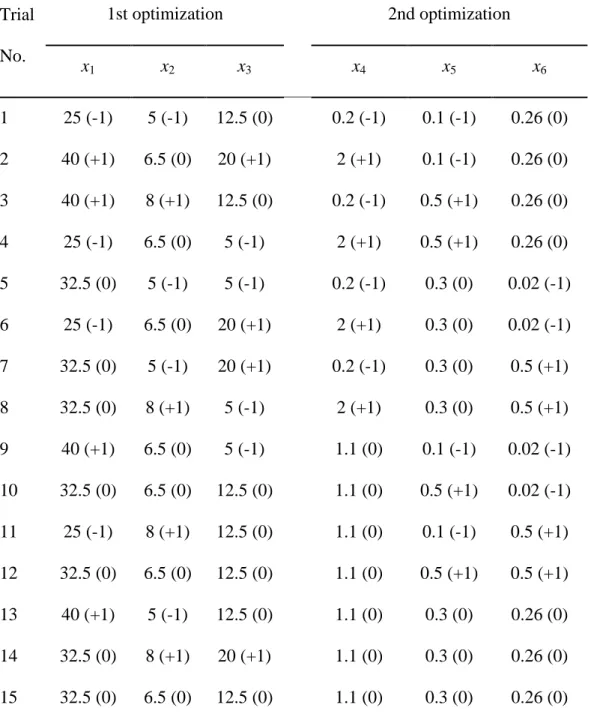
Table 3. Experimental design for biomass production of STF26*
Trial No. 1st optimization 2nd optimization x1 x2 x3 x4 x5 x6 1 25 (-1) 5 (-1) 12.5 (0) 0.2 (-1) 0.1 (-1) 0.26 (0) 2 40 (+1) 6.5 (0) 20 (+1) 2 (+1) 0.1 (-1) 0.26 (0) 3 40 (+1) 8 (+1) 12.5 (0) 0.2 (-1) 0.5 (+1) 0.26 (0) 4 25 (-1) 6.5 (0) 5 (-1) 2 (+1) 0.5 (+1) 0.26 (0) 5 32.5 (0) 5 (-1) 5 (-1) 0.2 (-1) 0.3 (0) 0.02 (-1) 6 25 (-1) 6.5 (0) 20 (+1) 2 (+1) 0.3 (0) 0.02 (-1) 7 32.5 (0) 5 (-1) 20 (+1) 0.2 (-1) 0.3 (0) 0.5 (+1) 8 32.5 (0) 8 (+1) 5 (-1) 2 (+1) 0.3 (0) 0.5 (+1) 9 40 (+1) 6.5 (0) 5 (-1) 1.1 (0) 0.1 (-1) 0.02 (-1) 10 32.5 (0) 6.5 (0) 12.5 (0) 1.1 (0) 0.5 (+1) 0.02 (-1) 11 25 (-1) 8 (+1) 12.5 (0) 1.1 (0) 0.1 (-1) 0.5 (+1) 12 32.5 (0) 6.5 (0) 12.5 (0) 1.1 (0) 0.5 (+1) 0.5 (+1) 13 40 (+1) 5 (-1) 12.5 (0) 1.1 (0) 0.3 (0) 0.26 (0) 14 32.5 (0) 8 (+1) 20 (+1) 1.1 (0) 0.3 (0) 0.26 (0) 15 32.5 (0) 6.5 (0) 12.5 (0) 1.1 (0) 0.3 (0) 0.26 (0) * x1 is temperature (°C), x2 is pH, x3 is dextrose concentration (%, w/v), x4 is
yeast extract concentration (%, w/v), x5 is KH2PO4 concentration (%, w/v) and
14
In the second optimization, concentration of dextrose was determined constant at the optimum value obtained from the first optimization while the concentrations of yeast extract, KH2PO4 and MgSO4.7H2O were varied
according to the experimental design (Table 3). pH and temperature of the process were also set to the optimum values obtained from the first optimization.
For both the first and second optimizations, agitation speed was adjusted to 200 rpm throughout the experiments. Aeration was performed by using sterile air and the flow rate was set at 2 vvm by using a rotameter (Q-flow, Vögtlin Instruments). Dissolved oxygen concentration (DO) was first adjusted to 100% saturation before inoculation and then cascaded to O2 enrichment to prevent the
drop of DO to value less than 50% saturation. DO was measured by using a dissolved oxygen sensor (Hamilton). A silicone-based antifoam agent (Antifoam A concentrate, Sigma-Aldrich) was used to prevent foaming during the process.
The experiments were carried out in 5-L bioreactors (Sartorius Stedim Biotech.) containing 2-L volume of medium. Fresh cultures were inoculated into the cultivation medium with an inoculums size of 1% (v/v). During the biomass production, approximately 12 mL of samples were collected from the medium at time intervals for analysis.
1.2.3. Experimental Design and Optimization by Response
Surface Methodology
In literature it is found out that for the growth of Bacillus pumilus microorganism, growth media should contain some essential nutrients and salts.
15
Among the salts KH2PO4 and MgSO4.7H2O are commonly used in growth
medium (17, 18, 22, 26, 41, 42, 44, 45). Moreover, studies show that carbon and nitrogen concentrations, pH and temperature together with the salts have significant effects on the growth of microorganisms (8, 12, 19, 20, 25, 39, 45, 46, 49). Therefore, in this study the aim is to maximize the biomass by optimizing concentrations of KH2PO4, MgSO4.7H2O, glucose and nitrogen
sources, pH and temperature.
Box-Behnken response surface method was used in the optimization of key factors to maximize the growth of the probiotic strain. The advantage of this method is the reduced number of experiments with reduced replicates (53). Minitab (Version 16; Inova ltd. Co.) statistical software was used to design the conditions for biomass production by giving the minimum and maximum values of determined factors (Table 4).
16
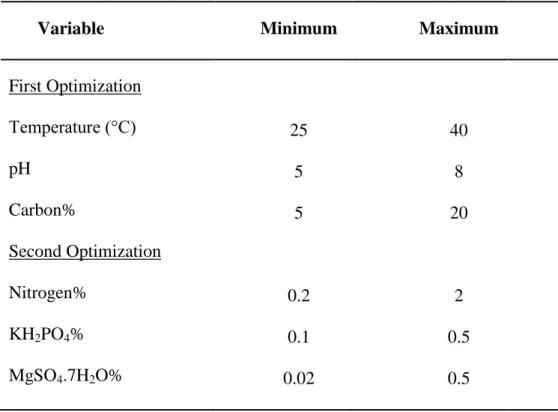
Table 4. Box- Behnken response surface method design parameters
Variable Minimum Maximum
First Optimization Temperature (°C) pH Carbon% Second Optimization Nitrogen% KH2PO4% MgSO4.7H2O% 25 5 5 0.2 0.1 0.02 40 8 20 2 0.5 0.5
In first optimization, fifteen experiments were generated for three factors namely, temperature, pH and concentration of the carbon source. Fifteen more runs were generated for the second optimization for the concentrations of nitrogen source, KH2PO4 and MgSO4.7H2O. The variables for two optimizations
and the coded and uncoded values of the variables are given in Table 3.
The test variables were coded according to the following regression equation:
(1)
,where xi is the coded value, Xi is the actual value of the independent variable,
17
In our regression models for both of the optimizations, the response was the biomass (g/L) and the α-level at which every term in the selected model should be significant was set as 5%. Full quadratic models, used to fit the response in Box-Behnken design, were expressed as follows:
(2)
where is the predicted response, is the constant, is the coefficient for the linear effect, is the coefficient for the quadratic effect and is the coefficient for the interaction effect.
The Minitab (Version 16; Inova ltd. Co.) statistical software was used for the regression analysis of the experimental results and to determine the coefficients of the model equations. The quality of the fit of the regression model equations was given by the coefficients of determination (R2). The quadratic model equation was maximized by using the same software to determine the optimum levels of the variables for maximum biomass (g/L).
Moreover, response surface and contour plots were constructed to describe the individual and cumulative effects of the significant variables and their interactions on the response (biomass).
1.2.4. Experimental Validation of the Optimized Conditions
In order to verify the validity of the model, experiments were conducted in 5-L bioreactors and parameters were set at the optimum conditions. For the validation of the model constructed after first optimization, the parameters
18
namely temperature, pH and concentration of carbon source (dextrose) were set at optimum levels found after statistical analyses. Likewise, in order to confirm the validity of the model generated after second optimization, concentrations of nitrogen source (yeast extract), KH2PO4 and MgSO4.7H2O were set at optimum
values. Biomass obtained after these experiments was compared with the one estimated by using the model equations.
1.2.5. Analysis
Approximately 12 mL of samples were withdrawn from the bioreactors every 2 h during the cultivation period (30 h). These samples were analyzed for optical density and cell dry weight to determine biomass, and residual sugar.
1.2.5.1. Biomass
The optical density of cells was measured at 620 nm by using a spectrometer Gnesys 10 Bio (thermo Scientific). Uninoculated cultivation medium was used as blank in the spectrometric analysis (53). During measurements, samples were diluted to an extent that the optical density values do not exceed 0.6 (49).
For cell dry weight determination, 10 ml of samples were centrifuged in pre-weighed falcon tubes and pellets were left drying at 37 °C to constant weight. A calibration curve was also constructed to relate OD620 values and cell dry weight (41, 53).
19
1.2.5.2. Residual Sugar
Residual sugar content of the cultivation medium was determined by using 3,5-dinitrosalicylic acid (DNS) method (8, 41, 53). Briefly, 0.1 ml of each sample was mixed with 3.9 ml of distilled water and 0.08 ml of HCl in a glass tube for hydrolysis of sugars. The solution was mixed and then heated in a water bath at 90 °C. After neutralization with 0.2 ml of 5 N KOH, 3 ml of solution was transferred into a clean test tube. Then 3 ml of DNSA solution (10 g/L dinitrosalicylic acid, 0.5 g/L sodium sulfite and 10 g/L sodium hydroxide) was added to the solution. 3 ml of distilled water was also mixed with 3-ml DNSA solution to be used as blank in the spectrophotometric measurements. The solution was mixed well and heated in a water bath at 90 °C for 10 min. A color change was observed during heat treatment based on the sugar concentration and in order to stabilize the color in the solution, 1 ml of 40% potassium-sodium tartrate solution was added to each tube. The test tubes were mixed and cooled to room temperature in a water bath. Absorbance measurements were done at 575 nm and recorded.
A standard curve was also constructed for each experimental run by using uninoculated cultivation medium. The medium was serially diluted and the same procedure of DNS method was performed.
20
1.3. RESULTS AND DISCUSSION
Two experimental designs were constructed by using Box-Behnken response surface method to investigate the effects of temperature, pH, carbon source concentration, nitrogen source concentration, KH2PO4 concentration and
MgSO4.7H2O concentration together with the effects of their interactions on
biomass production.
1.3.1. Optimization of Temperature, pH and Carbon Source
Concentration by Response Surface Methodology
In order to enhance biomass production of STF26, firstly three variables namely temperature, pH and carbon concentration were optimized by using response surface methodology. Temperature in the range of 25 °C to 40 °C, pH from 5.0 to 8.0, and dextrose concentration from 5.0 % to 20.0 % (w/v) were analyzed. Table 5 shows the coded and uncoded values of the variables tested and the experimental values of the response.
21
Table 5. Box-Behnken design matrix of the first optimization with three
variables in coded and uncoded units and with the response, biomass*
Trial No. 1st optimization x1 x2 x3 Biomass (g/L) 1 25 (-1) 5 (-1) 12.5 (0) 2.92 2 40 (+1) 6.5 (0) 20 (+1) 4.61 3 40 (+1) 8 (+1) 12.5 (0) 2.27 4 25 (-1) 6.5 (0) 5 (-1) 6.82 5 32.5 (0) 5 (-1) 5 (-1) 4.26 6 25 (-1) 6.5 (0) 20 (+1) 7.44 7 32.5 (0) 5 (-1) 20 (+1) 5.33 8 32.5 (0) 8 (+1) 5 (-1) 8.20 9 40 (+1) 6.5 (0) 5 (-1) 2.10 10 32.5 (0) 6.5 (0) 12.5 (0) 7.03 11 25 (-1) 8 (+1) 12.5 (0) 5.48 12 32.5 (0) 6.5 (0) 12.5 (0) 7.20 13 40 (+1) 5 (-1) 12.5 (0) 1.78 14 32.5 (0) 8 (+1) 20 (+1) 7.59 15 32.5 (0) 6.5 (0) 12.5 (0) 7.45
22
A full quadratic response surface model was constructed by using Minitab with coded units, and the following equation relating the biomass and the test variables was obtained:
Y (biomass) = 7.2267 – 1.4875x1 + 1.1562x2 + 0.4487x3 – 2.6083x1 2 – 1.5058x2 2 + 0.6242x3 2 – 0.5175x1x2+ 0.4725x1x3 – 0.4200x2x3 (3)
where Y is the response value which is biomass, x1, x2 and x3 are coded values of
the factors tested which are temperature, pH and dextrose concentration respectively.
Coefficient of determination (R2) was used to test the goodness of fit of the equation. The value of R2 was 0.95 which shows that the model explains 95% of the sample variations. The adjusted coefficient of determination (R2 (adj)) was 0.86 and confirms the R2 value in terms of the sample size and the number of terms in the model. The adjusted R2 value would be considerably smaller than the R2 value if the number of terms in the model is high while the sample is not very large (41).
The significance of the coefficients in the model was determined by p values Table 6. Smaller magnitude of p values indicates higher significance of the corresponding coefficient (46, 49). According to the present model, temperature, pH and quadratic effects of them were significant for biomass production.
In spite of the fact that only the coefficients of temperature, pH and their quadratic effects were significant, statistical analysis revealed that the model including all the coefficients was very reliable with an R2 value of 0.95. Therefore, none of the terms was excluded from Equation 3. Moreover, the lack
23
of fit was not significant and therefore the fitted model was appropriate for describing of the response surface.
Table 6. Response surface regression results for first optimization**
Term Coefficient Standard error of coefficient t value p value
Constant x1 x2 x3 x1·x1 x2·x2 x3·x3 x1·x2 x1·x3 x2·x3 7.2267 -1.4875 1.1562 0.4487 -2.6083 -1.5058 0.6242 -0.5175 0.4725 -0.4200 0.4831 0.2958 0.2958 0.2958 0.4355 0.4355 0.4355 0.4184 0.4184 0.4184 14.959 -5.028 3.908 1.517 -5.990 -3.458 1.433 -1.237 1.129 -1.004 0.000 0.004* 0.011* 0.190 0.002* 0.018* 0.211 0.271 0.310 0.362 R2 = 95.05 %, R2 (adj) = 86.15 %, p (lack of fit) = 0.38
* p < 0.05 is significant.
** x1, x2, and x3 represents temperature (°C), pH, and dextrose concentration (%,
w/v) respectively.
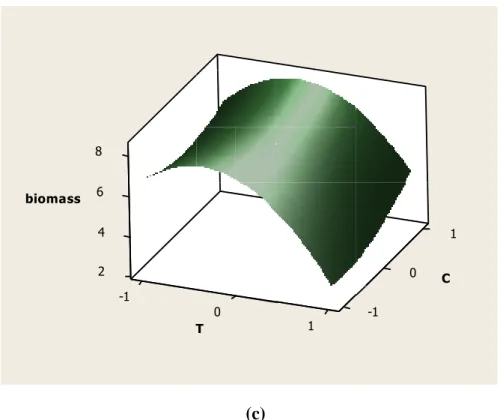
The graphical representations of the model were generated as contour and surface plots by using Minitab software and shown in Figure 2 and Figure 3. Response surface and contour plots show the effects of interactions between two of the variables on biomass with the other variable held constant at its zero level.
24 (a) (b) 0,0 2,5 5,0 -1 0 5,0 7,5 1 0 -1 1 biomass pH T C 0 Hold Values biomass vs T,pH 5 6 7 -1 0 -1 7 8 1 0 -1 1 biomass C pH T 0 Hold Values
biomass vs pH,C%
25 (c)
Figure 2. Response surface plots of (a) temperature and pH, (b) pH and carbon
source concentration, and (c) temperature and carbon source concentration on biomass production of Bacillus pumilus STF26 by holding other factors constant at middle point of the Box-Behnken design
“T” and “C” refer to temperature and carbon source concentration, respectively.
2 4 6 -1 0 8 -1 1 0 1 biomass C T pH 0 Hold Values
biomass vs T,C%
26 (a) (b) T p H 1,0 0,5 0,0 -0,5 -1,0 1,0 0,5 0,0 -0,5 -1,0 C 0 Hold Values > – – – – – – < 1 1 2 2 3 3 4 4 5 5 6 6 7 7 biomass biomass vs T,pH pH C 1,0 0,5 0,0 -0,5 -1,0 1,0 0,5 0,0 -0,5 -1,0 T 0 Hold Values > – – – < 5 5 6 6 7 7 8 8 biomass biomass vs pH,C%
27
(c)
Figure 3. Contour plots of (a) temperature and pH, (b) pH and carbon source
concentration, and (c) temperature and carbon source concentration on biomass production of Bacillus pumilus STF26 by holding other factors constant at middle point of the Box-Behnken design
“T” and “C” refer to temperature and carbon source concentration respectively.
Residual plots that give information about the lack of fit of the model were also plotted. According to the normal probability plot of the residuals shown in Figure 4a, errors were normally distributed and independent of each other. Moreover, as shown in Figure 4b, residual data scatter equally above and below the x-axis, indicating that the variance was independent of the biomass value. The frequency of the residuals and their observation order were also shown in Figure 4c and 4d. As can be seen, most of the residuals in the model were around 0 indicating the goodness of the fit of the model.
T C 1,0 0,5 0,0 -0,5 -1,0 1,0 0,5 0,0 -0,5 -1,0 pH 0 Hold Values > – – – – – < 3 3 4 4 5 5 6 6 7 7 8 8 biomass biomass vs T,C%
28 (a) (b) 1,0 0,5 0,0 -0,5 -1,0 -1,5 99 95 90 80 70 60 50 40 30 20 10 5 1 Residual P e rc e n t
Normal Probability Plot
(response is biomass) 8 7 6 5 4 3 2 1 1,0 0,5 0,0 -0,5 -1,0 Fitted Value R e si d u a l Versus Fits (response is biomass)
29 (c)
(d)
Figure 4. (a) Normal probability plot, (b) residual plot, (c) residual frequency
plot, (d) distribution plot of the residuals throughout the experiments of first optimization 0,8 0,4 0,0 -0,4 -0,8 7 6 5 4 3 2 1 0 Residual Fr e q u e n cy Histogram (response is biomass) 15 14 13 12 11 10 9 8 7 6 5 4 3 2 1 1,0 0,5 0,0 -0,5 -1,0 Observation Order R e si d u a l Versus Order (response is biomass)
30
The regression equation (Equation 3) was optimized by using Minitab program and the optimum values for the test variables were found as X1 = 30.9 °C, X2 =
6.9 and X3 = 20 % (w/v) giving a maximum biomass of 8.52 g/L. Optimization
plot of the model was shown in Figure 5.
Although results show that the maximum biomass was obtained at the highest dextrose concentration, according to the results of DNS assay all of the sugar in the cultivation medium was not consumed. When only the consumed amount of dextrose was put into the growth medium, biomass production decreased. The reason for this might be that while dextrose at high concentrations triggers the growth of the microorganism, the organism cannot consume it completely. However, it is still recommended to keep the carbon source concentration at the optimum value since the price of carbon source used in this study is very cheap when compared to that of the product which is biomass itself. Moreover, residual sugar that remains after cultivation could be used in another study after sterilization.
31
Figure 5. Optimization plot of Equation 3
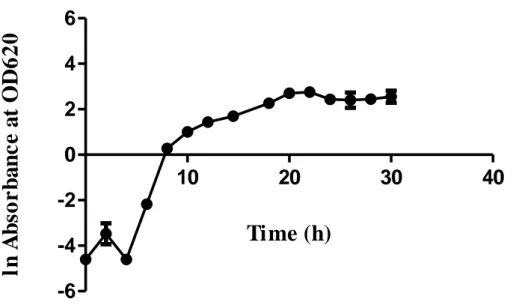
In order to verify the optimum values of the variables obtained by response surface methodology, an experiment was conducted with the optimum values of the test variables and the maximum biomass was obtained as 8.35 g/L, very close to the predicted value. Growth of STF26 in the optimized dextrose concentration, temperature and pH was shown in Figure 6. Other medium components were constant at the concentrations of yeast extract, 20 g/L; KH2PO4, 2 g/L and MgSO4.7H2O, 1 g/L. Agitation speed and air flow rate were
also fixed at 200 rpm and 2 vvm, respectively. Maximum biomass concentration of 8.35 g/L was obtained at 22 h, beginning of the stationary phase.
Cur High Low 1,0000D Optimal d = 1,0000 Maximumbiomass y = 8,5163 1,0000 DesirabilityComposite -1,0 1,0 -1,0 1,0 -1,0 1,0T pH C [-0,2121] [0,2727] [1,0]
32
Time (h)
ln
A
b
so
r
b
a
n
c
e
a
t
OD6
2
0
10
20
30
40
-6
-4
-2
0
2
4
6
Figure 6. Time course of STF26 cultivation using optimized dextrose
concentration, temperature and pH
The process was performed in a 5-L bioreactor.
1.3.2. Optimization
of
Nitrogen
Source,
KH
2PO
4and
MgSO
4.7H
2O Concentrations by Response Surface
Methodology
After optimizing temperature, pH and dextrose concentration, three more factors affecting on biomass were tested to further increase the biomass of STF26. Three variables namely the concentrations of yeast extract, KH2PO4 and
MgSO4.7H2O were optimized using response surface methodology.
Concentrations of yeast extract in the range of 2 to 20 g/L, KH2PO4 from 1 to 5
g/L and MgSO4.7H2O from 0.2 to 5 g/L were tested. Temperature, pH and
33
30.9 °C, 6.9 and 20% (w/v) respectively. Test variables with coded and uncoded units and the response values are given in Table 7.
34
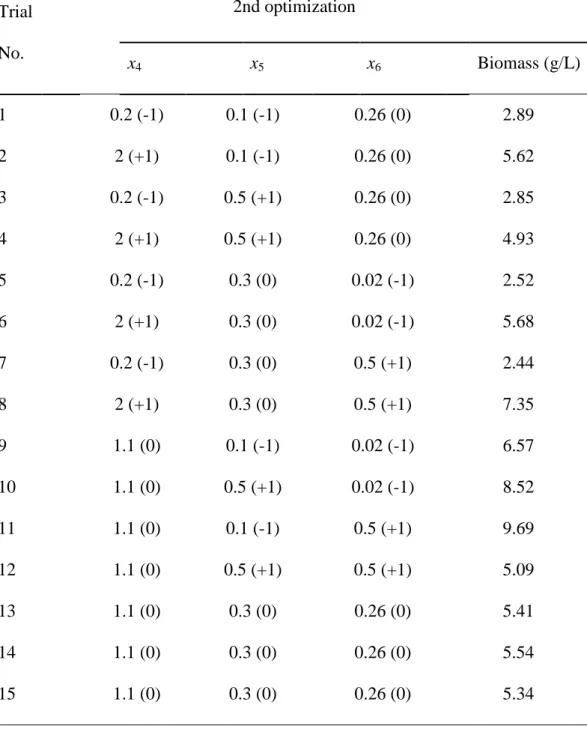
Table 7. Box-Behnken design matrix of the second optimization with three
variables in coded and uncoded units and with the response, biomass
Trial No. 2nd optimization x4 x5 x6 Biomass (g/L) 1 0.2 (-1) 0.1 (-1) 0.26 (0) 2.89 2 2 (+1) 0.1 (-1) 0.26 (0) 5.62 3 0.2 (-1) 0.5 (+1) 0.26 (0) 2.85 4 2 (+1) 0.5 (+1) 0.26 (0) 4.93 5 0.2 (-1) 0.3 (0) 0.02 (-1) 2.52 6 2 (+1) 0.3 (0) 0.02 (-1) 5.68 7 0.2 (-1) 0.3 (0) 0.5 (+1) 2.44 8 2 (+1) 0.3 (0) 0.5 (+1) 7.35 9 1.1 (0) 0.1 (-1) 0.02 (-1) 6.57 10 1.1 (0) 0.5 (+1) 0.02 (-1) 8.52 11 1.1 (0) 0.1 (-1) 0.5 (+1) 9.69 12 1.1 (0) 0.5 (+1) 0.5 (+1) 5.09 13 1.1 (0) 0.3 (0) 0.26 (0) 5.41 14 1.1 (0) 0.3 (0) 0.26 (0) 5.54 15 1.1 (0) 0.3 (0) 0.26 (0) 5.34
*x4 is yeast extract concentration (%, w/v), x5 is KH2PO4 concentration (%, w/v)
35
Regression analysis of the experimental data was done by using Minitab software with coded units, and the following equation was obtained that relates biomass and the factors tested:
Y (biomass) = 5.4300 + 1.6100x4 – 0.4225x5 + 0.1600x6 – 2.1638x4 2 + 0.8063x5 2 + 1.2312x6 2 – 0.1625x4x5+ 0.4375x4x6 – 1.6375x5x6 (4)
where Y is the biomass concentration, x4, x5 and x6 are coded values of the
concentrations of yeast extract, KH2PO4 and MgSO4.7H2O respectively.
R2 value used to test the fit of the model was 0.96, suggesting 96% of the total variation is explained by the equation. R2 (adj) value was 0.90, which is very close to the R2 value as in the first optimization.
Table 8 shows the regression coefficients of the 2nd optimization model and the p values. According to the p values of the present model, concentration of yeast extract, quadratic effects of yeast extract concentration and MgSO4.7H2O
concentration and the interaction of KH2PO4 and MgSO4.7H2O concentrations
have significant effects on the biomass production. Although other coefficients in the model do not affect significantly on biomass, all terms were included in Equation 4 since the R2 value, 0.96, was showing that the model was very reliable. Moreover, the lack of fit was not significant and therefore the fitted model was appropriate for describing of the response surface.
36
Table 8. Response surface regression results for first optimization**
Term Coefficient Standard error of coefficient t value p value
Constant x4 x5 x6 x4·x4 x5·x5 x6·x6 x4·x5 x4·x6 x5·x6 5.4300 1.6100 -0.4225 0.1600 -2.2638 0.8063 1.2312 -0.1625 0.4375 -1.6375 0.3883 0.2378 0.2378 0.2378 0.3500 0.3500 0.3500 0.3362 0.3362 0.3362 13.986 6.772 -1.777 0.673 -6.183 2.304 3.518 -0.483 1.301 -4.870 0.000 0.001* 0.136 0.531 0.002* 0.069 0.017* 0.649 0.250 0.005* R2 = 96.45 %, R2 (adj) = 90.05 %, p (lack of fit) = 0.14
* p < 0.05 is significant.
** x4, x5, and x6 represents the concentrations of yeast extract, KH2PO4 and
MgSO4.7H2O respectively.
Response surface and contour plots were constructed for the second optimization in order to observe the effects of interactions between two factors tested Figure 7 and Figure 8. The elliptical shape of the response surface showing the interaction between KH2PO4 and MgSO4.7H2O indicate that this
37 (a) (b) 2 4 0 -1 6 1 0 -1 1 biomass KH 2 P O4 % N % MgSO4.7H2O% 0 Hold Values
Surface Plot of biomass vs KH2PO4%; N %
6 7 8 -1 0 -1 9 -1 1 0 1 biomass MgSO4 .7 H 2 O% KH 2 PO4 % N % 0 Hold Values
38
(c)
Figure 7. Response surface plots of (a) nitrogen source concentration and
KH2PO4 concentration (b) KH2PO4 concentration and MgSO4.7H2O
concentration, and (c) nitrogen source concentration and and carbon source concentration on biomass production of Bacillus pumilus STF26 by holding other factors constant at middle point of the Box-Behnken design
“N%”, “KH2PO4%” and “MgSO4.7H2O%” refer to nitrogen source, KH2PO4 and
MgSO4.7H2O concentrations respectively. 2 4 6 -1 0 -1 6 8 1 0 -1 1 biomass MgSO4 .7 H 2 O% N % KH2PO4% 0 Hold Values
39 (a) (b) N % K H 2 P O 4 % 1,0 0,5 0,0 -0,5 -1,0 1,0 0,5 0,0 -0,5 -1,0 MgSO4.7H2O% 0 Hold Values > – – – – < 2 2 3 3 4 4 5 5 6 6 biomass
Contour Plot of biomass vs KH2PO4%; N %
KH2PO4% M g S O 4 .7 H 2 O % 1,0 0,5 0,0 -0,5 -1,0 1,0 0,5 0,0 -0,5 -1,0 N % 0 Hold Values > – – – < 6 6 7 7 8 8 9 9 biomass
40
(c)
Figure 8. Contour plots of (a) nitrogen source concentration and KH2PO4
concentration (b) KH2PO4 concentration and MgSO4.7H2O concentration, and
(c) nitrogen source concentration and and carbon source concentration on biomass production of Bacillus pumilus STF26 by holding other factors constant at middle point of the Box-Behnken design
“N%”, “KH2PO4%” and “MgSO4.7H2O%” refer to nitrogen source, KH2PO4 and
MgSO4.7H2O concentrations respectively.
Normal probability plot (Figure 9a), residual plot (Figure 9b), residual frequency plot (Figure 9c), and distribution plot of the residuals throughout the experiments of second optimization (Figure 9d) were also graphed to check lack of fit of the model. Residual plots show that the errors were normally distributed and the variance was independent of the response.
N % M g S O 4 .7 H 2 O % 1,0 0,5 0,0 -0,5 -1,0 1,0 0,5 0,0 -0,5 -1,0 KH2PO4% 0 Hold Values > – – – – – < 2 2 3 3 4 4 5 5 6 6 7 7 biomass
41 (a) (b) 1,0 0,5 0,0 -0,5 -1,0 99 95 90 80 70 60 50 40 30 20 10 5 1 Residual P e rc e n t
Normal Probability Plot
(response is biomass) 10 9 8 7 6 5 4 3 2 0,50 0,25 0,00 -0,25 -0,50 -0,75 Fitted Value R e si d u a l Versus Fits (response is biomass)
42
(c)
(d)
Figure 9. (a) Normal probability plot, (b) residual plot, (c) residual frequency
plot, (d) distribution plot of the residuals throughout the experiments of second optimization 0,6 0,4 0,2 0,0 -0,2 -0,4 -0,6 4 3 2 1 0 Residual Fr e q u e n cy Histogram (response is biomass) 15 14 13 12 11 10 9 8 7 6 5 4 3 2 1 0,50 0,25 0,00 -0,25 -0,50 -0,75 Observation Order R e si d u a l Versus Order (response is biomass)
43
Optimum values of the test variables were determined by optimizing the regression equation (Equation 4) using Minitab program and the optimum values were found as X4 = 1.526 % (w/v), X5 = 0.1 % (w/v) and X6 = 0.5 %
(w/v) giving a maximum biomass of 10.17 g/L. Optimization plot of the model was shown in Figure 10.
Figure 10. Optimization plot of Equation 4
Optimization results were confirmed by conducting an experiment with the optimum values of the test variables obtained by response surface methodology. Maximum biomass was measured as 10.42 g/L which is close to the predicted value found by the optimization of the regression equation (Equation 4). Growth of STF26 was observed at optimum levels of the variables and the growth curve was plotted Figure 11. Other variables (temperature, pH and dextrose concentration) were constant at their optimum values that were found out in first
Cur High Low 1,0000D Optimal d = 1,0000 Maximumbiomass y = 10,1719 1,0000 DesirabilityComposite -1,0 1,0 -1,0 1,0 -1,0 1,0 KH2PO4% MgSO4.7H N % [0,4747] [-1,0] [1,0]
44
optimization. Agitation speed and air flow rate were again set to 200 rpm and 2 vvm respectively. Maximum biomass concentration was obtained as 10.42 g/L at 24 h, beginning of the stationary phase.
Time (h)
ln
A
b
so
r
b
a
n
c
e
a
t
O
D
6
2
0
10
20
30
40
50
-6
-4
-2
0
2
4
6
Figure 11. Time course of STF26 cultivation using optimized yeast extract
concentration (%, w/v), KH2PO4 concentration (%, w/v), MgSO4.7H2O
concentration (%, w/v) together with optimized dextrose concentration, temperature and pH
The process was performed in a 5-L bioreactor.
After two steps of optimization, it is determined that optimum concentrations of the medium components were 20% dextrose (w/v), 1.526 % yeast extract (w/v), 0.1 % KH2PO4 (w/v) and 0.5 % MgSO4.7H2O (w/v) to obtain maximum
45
concentration of STF26 biomass and optimum cultivation conditions were 30.9 °C and 6.9 pH.
Finding out the optimum concentrations of the medium components, growth of STF26 in optimized medium was compared with the one in LB medium. Other cultivation conditions were the same in both media where temperature and pH were at their optimized values. Maximum biomass concentration obtained when the culture was grown in LB was 4.23 g/L, nearly 2.5 times lower than the value obtained when the culture was grown in optimized medium.
Time (h)
ln
A
b
so
r
b
a
n
c
e
a
t
OD6
2
0
10 20 30 40 -6 -4 -2 0 2 4 6Figure 12. Time course of STF26 cultivation using LB broth (Sigma) at
optimized temperature and pH
46
1.4. CONCLUSION AND FUTURE PERSPECTIVES
Optimization of the cultivation conditions and the medium composition are of crucial importance since they considerably affect overall process economics. In this study, in order to maximize the biomass of a potential probiotic strain, concentrations of four main medium components (dextrose, yeast extract, KH2PO4, MgSO4.7H2O), temperature and the pH values were optimized by
using response surface methodology (RSM). RSM is a more advantageous technique than the conventional one-factor-at-a-time method, since it is less time-consuming and it also analyzes the interactive effects among the variables tested. The results demonstrate that optimum values of temperature, pH, dextrose concentration, yeast extract concentration, KH2PO4 concentration and
MgSO4.7H2O concentration are 30.9 °C, 6.9, 20 % (w/v), 1.526 % (w/v), 0.1 %
(w/v) and 0.5 % (w/v) respectively to obtain maximum biomass. Maximum biomass obtained at optimized conditions was 10.42 g/L and this value was considerably higher when it was compared with the value obtained by using LB medium. After second optimization studies, first optimization can be repeated by using the optimized values of yeast extract concentration, KH2PO4
concentration and MgSO4.7H2O concentration in order to check the goodness of
the optimum temperature, pH and dextrose concentration values. Biomass of this microorganism can be further increased by optimizing other cultivation conditions such as air flow rate and agitation speed.
47
CHAPTER 2
Production and Characterization of a Biosurfactant Produced
by a Novel Staphylococcus xylosus Strain
2.1. INTRODUCTION
2.1.1. Surfactants
Surfactants (surface active agents) are amphipathic molecules that reduce the interfacial tensions between liquids, solids and gases (3, 15, 37, 47). All surfactants have two ends one of which is hydrophobic and the other is hydrophilic. Hydrophobic end is a hydrocarbon part and is less soluble in water. This part of the surfactants is a long chain of fatty acids, hydroxy fatty acids, hydroxyl fatty acids or α-alkyl-β-hydroxy fatty acids. Hydrophilic end is water soluble and could be a carbohydrate, amino acid, cyclic peptide, phosphate, carboxylic acid or alcohol (40). Surfactants can be classified based on their dissociation in water as; anionic surfactants, nonionic surfactants, cationic surfactants, and amphoteric surfactants. Anionic surfactants are the most commonly used ones and they are dissociated in water (47). These surfactants are negatively charged usually because of a sulphonate or sulphur group (40). Alkylbenzene sulfonates (detergents), soaps (fatty acid), lauryl sulfate (foaming agent), di-alkyl sulfosuccinate (wetting agent), lignosulfonates (dispersants) are some examples of anionic surfactants. Nonionic surfactants are the second commonly used surfactants. Since their hydrophilic group is a non-dissociable type, (such as alcohol, phenol, ester, ether, or amide) they do not ionize in
48
aqueous solutions (47). Cationic surfactants are dissociated in water and they are characterized by a positively charged quaternary ammonium group (40, 47). Finally, amphoteric surfactants are the ones that have both anionic and cationic properties in the same molecule (40, 47). Examples of a few most commonly used surfactants are shown in Figure 13.
49
Figure 13. Commonly used surfactants (47)
2.1.2. Biosurfactants
Biosurfactants are the surface active agents that are produced by microorganisms as bacteria, yeast and filamentous fungi (40). Biosurfactants can be classified due to their molecular weight as low-molecular-weight molecules and high-molecular-weight polymers. Lipopeptides, also called as surfactin, and
50
glycolipids are the examples of low-molecular-weight biosurfactants. These compounds lower the surface and interfacial tension while high-molecular-weight polymers do not reduce the surface tension as much but usually stabilize emulsions of oil-in-water (2). Food emulsifiers and biodispersan are the examples of high-molecular-weight polymers (40). The most commonly studied biosurfactants are glycolipids including rhamnolipids, sophorolipids and trehalolipids. Other examples of commonly studied biosurfactants are lipoproteins and lipopeptides, fatty acids, phospholipids and the polymeric ones such as emulsan and liposan (2, 15). Chemical structures of some biosurfactants are shown in Figure 14.
51
Figure 14. Chemical structure of most studied biosurfactants (2)
There are various microorganisms that produce different types of biosurfactants. Most known biosurfactants and the microorganisms produce them are given in Table 9.
52
Table 9. Major types of biosurfactants produced by microorganisms (3, 40)
Biosurfactant Type Microorganism
Trehalose lipids Rhodococcus sp.
Norcardia sp.
Corynebacterium sp. Arthrobacter paraffineus
Rhamnolipids Pseudomonas aeruginosa
Serratia rubidea
Glycolipids Alcanivorax borkumensis
Tsukamurella sp. Serratia marcescens
Sophorolipids Candida bombicola
Candida apicola Candida lipolytica
Surfactin Bacillus subtilis
Bacillus pumilus
Viscosin Pseudomonas fluorescens
Fatty acids Capnocytophaga sp.
Penicillium spiculisporum Corynebacterium lepus Arthrobacter paraffineus Norcadia erythropolis Alasan Acinetobacter radioresistens