Published online 2018 October 3. Research Article
Evaluation of a Healthy Pregnant Placenta with Shear Wave
Elastography
Ay¸segül Altunkeser
1, *, Ender Alkan
2, O˘guzhan Günenç
3, ˙Ismet Tolu
1and Muslu Kazım Körez
41Department of Radiology, Konya Training and Research Hospital, University of Health Sciences, Konya, Turkey 2Department of Radiology, Aksaray Training and Research Hospital, Aksaray, Turkey
3Department of Obstetrics and Gynecology, Konya Trainning and Research Hospital, University of Health Sciences, Konya, Turkey 4Department of Statistics, Faculty of Science, Selcuk University, Konya, Turkey
*Corresponding author: Department of Radiology, Konya Training and Research Hospital, University of Health Sciences, Hacı ¸Saban Mah, Yeni Meram Cd. No:97, 42090 Meram,
Konya, Turkey. Tel: +90-5335507400, Email: [email protected].
Received2018 March 04; Revised 2018 August 08; Accepted 2018 August 18. Abstract
Background:The placenta is a soft organ with vital importance. Increased placental stiffness was reported in pathological condi-tions emerging during pregnancy, such as diabetes mellitus and hypertension. Nowadays, placental stiffness can be quantitatively measured using the shear wave elastography (SWE) technique.
Objectives:We aimed to assess the factors affecting elasticity by finding the normal elastogram values of healthy pregnancy pla-centas using the SWE technique due to the importance of early diagnosis in risky pregnancies.
Patients and Methods:In total, 288 healthy pregnant women in the second or third trimester were included in our prospective study. The pregnant women who had pathology in their fetus and its appendices or a posteriorly located placenta were excluded from the study. Obstetric ultrasonography and a placental elasticity assessment were performed in all the pregnant women. Speed values were obtained from five different locations of the placenta, including the central S1, S2, S3, S4 and peripheral P regions. The elasticity of the regions were compared, and the factors affecting elasticity were investigated.
Results:There were significant differences among the velocity values obtained from five different areas of the placenta. The mean velocity values obtained from the central region were higher than those of the peripheral region (P < 0.001). There was also a signifi-cant difference in the mean velocity measurements obtained from the central region (P < 0.001). The hardest region of the placenta was the maternal surface, while the softest region was the peripheral surface. The elastographic velocity values of the placenta were found to correlate with maternal age, body mass index, placental localization, thickness, and grade, whereas it did not correlate with gravidity, parity, gestational week, and amniotic fluid index .
Conclusion:The elasticity of the placenta varied according to the region and surface, whereas it did not change according to gesta-tional week. It may be convenient to use the elasticity values obtained by SWE from specified regions in the follow-up of placentas in high-risk pregnancies. However, considering the affecting factors and contradictory study results, a large number of large-scale studies is required to strengthen the efficiency of SWE in the placental assessment.
Keywords:Shear Wave Elastography, Placental Elasticity, Placental Morphology, Obstetric Ultrasonography
1. Background
Elasticity is a condition that manifests as tissue stiff-ness indicating the biological and mechanical properties of the tissue (1). Shear wave elastography (SWE) is a novel In
vivoimaging technique based on the principle that shear waves move faster in hard tissue and their velocities can be measured (2). The short acoustic pushing pulse gener-ated by SWE produces a displacement and measurable ve-locity (m/sec) at the target organ (3). The pushing pulse leads to a high velocity by causing less displacement in hard tissues, whereas it causes a low velocity in soft tis-sues; therefore, tissue stiffness can be measured quantita-tively with SWE (4). The most important advantages of SWE
are that it is a non-invasive technique, as it allows for the simultaneous evaluation of the ultrasonography (US) de-vice, which performs a B-mode and Doppler examination and is not operator-dependent, as dynamic compression is not required (5-7). The studies investigating the pathology of the liver and pancreas reported that it was significant to assess elasticity with SWE (6,8,9). Today, the elasticity of the placenta can be measured by the SWE technique.
The placenta is a soft organ rich in vessels with a unique significance, providing a biological connection between the mother and fetus (10,11). It is known that pathologi-cal developments in the placenta cause poor prognoses by affecting fetal growth. Placental elasticity was reported to
be decreased and hardened in preeclamptic pregnancies, and it was emphasised in previous studies that SWE helps in placental assessment and can be used as a support in the prediction of preeclampsia (12,13). It was reported that the decreased elasticity in the placentas of pregnant women having preeclampsia or fetuses with intrauterine growth retardation, in combination with fibrosis and inflamma-tion, might have been associated with ischemic changes and infarcts, and it was emphasised that an elasticity as-sessment could be useful for assessing placental status (14). 2. Objectives
There are few studies on placental assessment with SWE in normal pregnant women and on their normal val-ues. We aimed to determine the normal elastogram values of the placentas of healthy pregnant women and to exam-ine the factors affecting their elasticities due to the impor-tance of placental assessment and early diagnosis in risky pregnancies.
3. Patients and Methods
Of the 368 pregnant women who were examined with obstetric US between January 1 and March 15, 288 pregnant women in the second or third trimester were included. Ethical committee approval and local institutional com-mittee permission were obtained from Necmettin Erbakan University for this study. Informed consent forms were also obtained from the participating pregnant women. The pregnant women whose fetuses were detected to have congenital anomalies and intrauterine growth retardation and/or the pregnant women with complicated patholo-gies, such as developmental abnormalities, diffuse calci-fication, masses or hematoma in the placenta; the preg-nant women with a posteriorly located placenta, as the de-vice could not perform the measurement; and the preg-nant women with an abnormal amount of amniotic fluid were excluded from the study. In addition, the pregnant women with diabetes mellitus, severe anemia, hyperten-sion, heart disease or any other disease were also excluded from the study. The pregnant women with normal physical examinations, laboratory tests and US examinations were included in the study. All patients underwent obstetric US in the supine position with the Toshiba Aplio 500 (Toshiba Medical Systems Corporation, Tokyo, Japan) device using a 1-6-MHz convex transducer. In the B-mode examination, fetal biometric measurements, including biparietal diam-eter (BPD), femur length (FL), abdominal circumference (AC) and estimated fetal weight; amniotic fluid index (AFI); and the placental data, including its localization, thickness and echo structure, were obtained and their B-mode im-ages were recorded. Subsequently, an SWE examination not exceeding 5 seconds was conducted on the placenta. At this time, the patient was instructed to breath slowly and stand still for 5 seconds, and imaging was carried out with the adjustable trapezoid-shaped imaging box in the period
when the fetus was at rest. The measurement was per-formed via the round and free region of interest (ROI) after colouring, and images were frozen with the color scale, re-flecting the stiffness in the imaging box and ranging from blue to red.
The central region of the placenta, which is the thick-est part, was divided into three parts, including the ma-ternal surface, central part and fetal surface. Three mea-surements were carried out and coded as S1, S2, and S3, re-spectively. Afterwards, a fourth measurement was taken from the thickest part of the central placental area to en-compass the previous three measurements and coded as S4. Subsequently, a fifth measurement was obtained from the centre of the peripheral placenta and coded as P. The velocity values from coded zones as m/sec via the ROI were obtained (Figure 1AandB). The ROI’s volume was not stan-dardized, as the placental thicknesses were different. The placentas with anterior, anterolateral, posterolateral and fundus localizations whose depth did not exceed 10 cm and that could be penetrated were preferred for measurement. It was examined whether there was any difference in elas-ticity in the placental regions. The factors affecting elastic-ity were analyzed by investigating gestational age, parelastic-ity, gravidity, AFI, placental location, thickness, and grade, and the ideal measurement area was determined.
3.1. Statistical Analysis
The statistical analysis was performed with the SPSS 22 software (Released 2013, SPSS Statistics for Windows, Ver-sion 22.0 Armonk, NY: IBM Corp) (Copyright IBM Corpo-ration and its licensors 1989, 2012). The results of the de-scriptive statistics were given as mean±standard devia-tion (SD) and min - max. The normality of the data was ana-lyzed using the Shapiro-Wilk normality test. The Kruskal-Wallis test, analysis of variance (ANOVA) and student’s t-test were performed for examining the differences among groups. Multiple comparisons among groups were carried out using the Conover-Iman test of multiple comparisons and Tukey’s honest significant difference multiple compar-ison test with Bonferroni correction. The relationship be-tween continuous variables was examined by Spearman’s Rho and Pearson’s correlation coefficient, and P < 0.05 was considered statistically significant.
4. Results
The mean age of the 288 participating pregnant women with a gestational age range of 14 - 41 weeks was 26 years (18 - 46 years). The descriptive characteristics of the pregnant women, including age, gravidity, parity, ges-tational week (GW) and body mass index (BMI), are shown inTable 1. There were significant differences among the ve-locity values obtained from five different sites of the pla-centa. The mean S1 and S4 zone velocity values were higher than the mean P zone (P < 0.001). The central region of the placenta was harder than the peripheral region, and
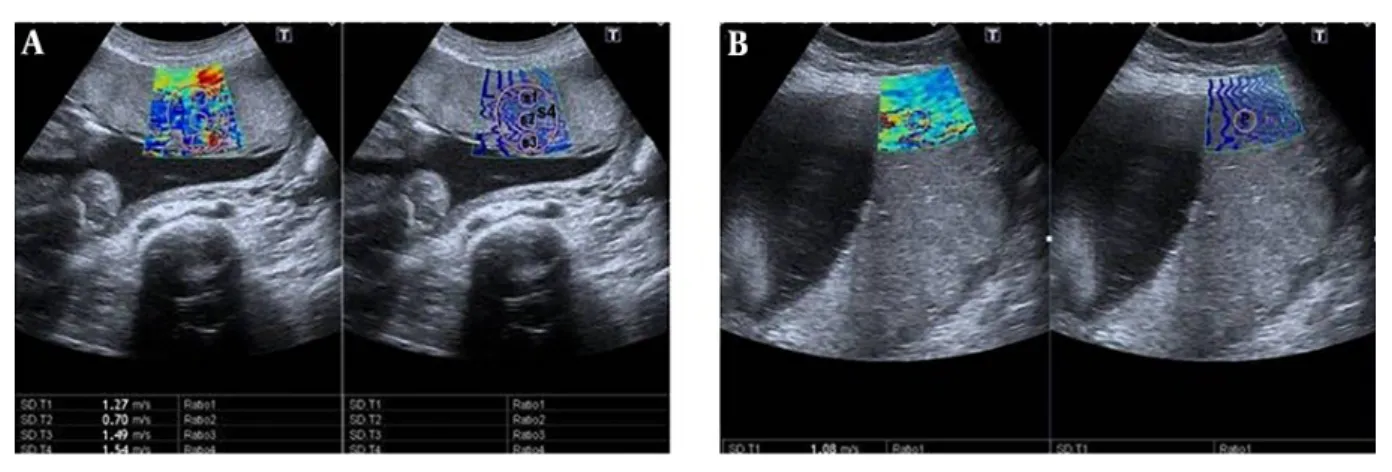
Figure 1.Shear wave elastography (SWE) images of the placenta in pregnant women. Two split shear wave elastography images are at the same level. The rectangular box represents the stiffness spectrum in blue to red. A, SWE images of the central placenta of a 21-year-old pregnant woman in the 27th week of gestation. Round and free regions of interests (ROI) are placed in the colour area. SWE velocity values were measured as 1.27 m/s, 0.70 m/s, 1.49 m/s, and 1.54 m/s, from S1, S2, S3 and S4, respectively. B, SWE images of the peripheral placenta of a 28-year-old pregnant woman in the 37th week of gestation. ROI is placed in the center of the colour area. SWE velocity value was measured as 1.08 m/s, from P area (P,centre of the peripheral placenta ;S1, maternal surface of central placenta; S2, central part of central placenta; S3, fetal surface of central placenta; S4, central placental area).
there was a significant difference between the mean veloc-ity measurements obtained from the S1, S2 and S3 zones (P < 0.001). The mean S1 zone velocity values were higher than S2 and S3 zones. The hardest region of the placenta was the maternal surface of the central region, whereas the softest regions were the peripheral region and the centre of the central region (Table 2andFigure 2).
4 3 2 1 0 SW V, m /sec S1 S2 S3 S4 P P < 0.001 P < 0.001 P < 0.001 P < 0.001
Figure 2.Multiple comparison and distribution of velocity values obtained from placenta measurement regions
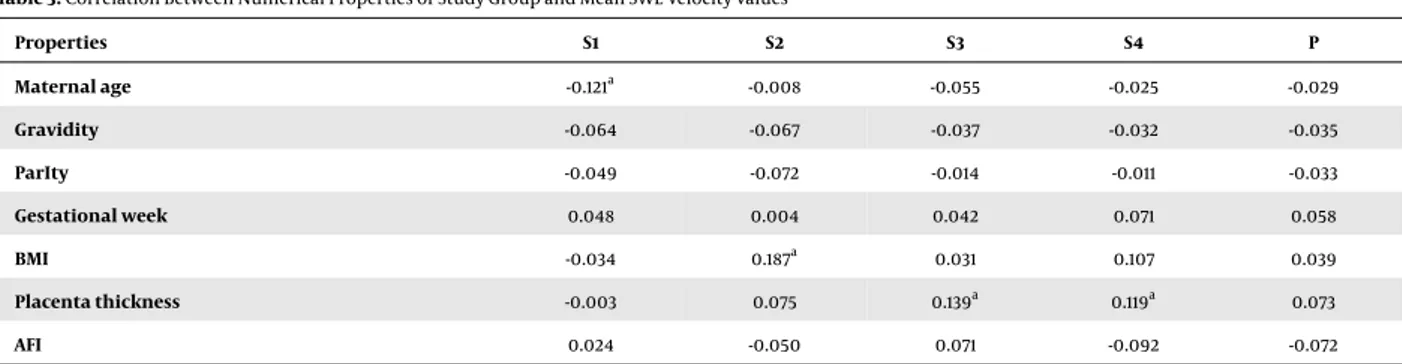
Although there was a correlation between the elasto-graphic velocity values of the placenta and age, BMI and placental localization, thickness, and grade, there was no association with gravidity, parity, GW, and AFI. There was a negative correlation between the mean S1 elastography ve-locity value and age, and there was a positive correlation between the S2 value and BMI, as well as between the S3 and S4 values and placental thickness (P < 0.05) (Table 3). In
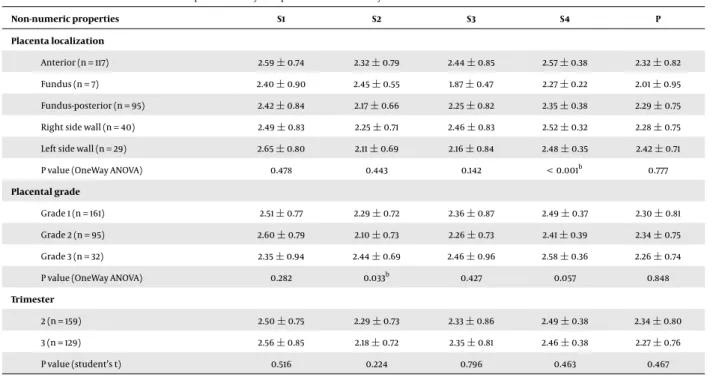
addition, a positive correlation was found between the S4 value and placental localization (P < 0.001) and between the S2 value and placental grade (P < 0.03) (Table 4). There was no relationship between P zone velocities and numeric and non-numeric properties of the study group (Tables 3 and4). There was a positive correlation between placental thickness and GW and BMI (P < 0.001) (Table 5).
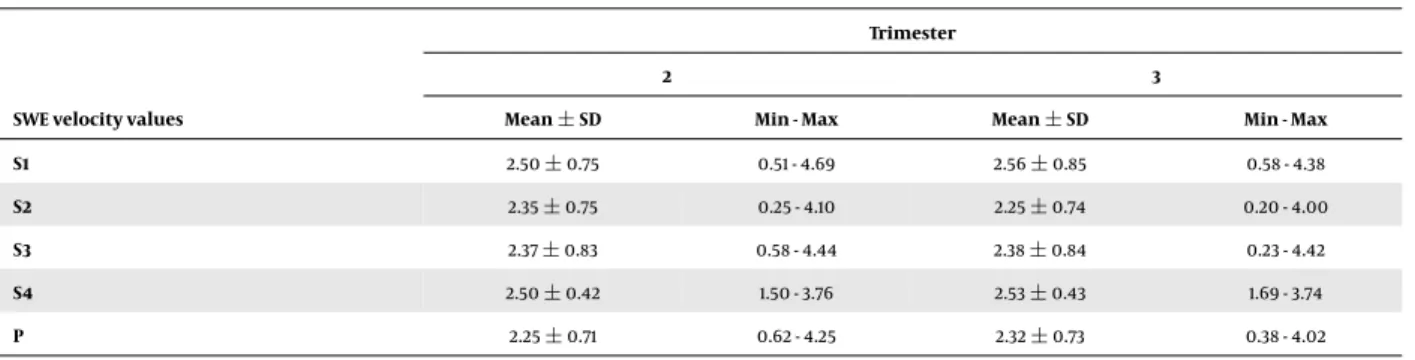
The nomogram table according to trimester was gen-erated with the velocities obtained from the placenta mea-surement regions (Table 6).
5. Discussion
Today, SWE contributes to measuring placental elastic-ity and assessing the placenta. The studies investigating and comparing the elasticity characteristics of normal and pathological tissues emphasize the diagnostic importance of this technique (5,6,8,9,15-17). The SWE velocities of the placenta were found to be lower than those of the breast (18), the liver of a child (19), the endometrium, and the my-ometrium (10,20). This is an indication of the fact that the placenta is normally a soft organ. In a study examin-ing placental elasticity Ex vivo, it was found that the pla-centas of preeclamptic pregnant women were stiffer than the normal placentas of pregnant women (21). Also, pla-cental infarction, sclerotic narrowing of the arteries and villous inflammation in preeclamptic and diabetic preg-nant women’s placentas were demonstrated histologically (22-24). Higher placental thicknesses in diabetic pregnan-cies (24) and high SWE values (25) suggest that histolog-ical changes in diabetes may lead to an increase in elas-ticity values. In our study, we did not have any diabetic patients, but we observed that the placentas of pregnant women with high BMI values were thicker and harder. Pla-cental thickness increased along with GW, whereas its
stiff-Table 1.Descriptive Characteristics of the Study Group
Maternal age Gravidity Parity Gestational
week BMI Trimester 2 (%) 3 (%) n 288 288 288 288 288 159 (55.21) 129 (44.79) Mean±SD 26.16±5.84 2.64±1.66 1.30±1.38 26.40±6.98 27.50±5.29 Min - Max 18.00 - 44.00 1.00 - 11.00 0.00 - 10.00 14.00 - 39.00 17.70 - 48.40 Abbreviations: BMI, body mass index; SD, standard deviation.
Table 2.Multiple Comparison Between Velocity Values Obtained from Placenta Measurement Regions
SWE (m/sec) Mean SD Min 1Q Med 3Q Max P value Pairwise comparison
(a) S1 2.52 0.79 0.51 1.96 2.41 3.02 4.69 (b) (e)
(b) S2 2.30 0.75 0.20 1.78 2.23 2.82 4.10 (a) (d)
(c) S3 2.37 0.83 0.23 1.78 2.28 2.92 4.44 < 0.001a
-(d) S4 2.51 0.43 1.50 2.22 2.50 2.82 3.76 (b) (e)
(e) P 2.28 0.72 0.38 1.78 2.19 2.75 4.25 (a) (d)
Abbreviations: SWE, shear wave elastography; 1Q, first quantile; 3Q, third quantile; S1, maternal surface of central placenta; S2, central part of central placenta; S3, fetal surface of central placenta; S4, central placental area;P,centre of the peripheral placenta SD, standard deviation.
aStatistically significant.
Table 3.Correlation Between Numerical Properties of Study Group and Mean SWE Velocity Values
Properties S1 S2 S3 S4 P Maternal age -0.121a -0.008 -0.055 -0.025 -0.029 Gravidity -0.064 -0.067 -0.037 -0.032 -0.035 ParIty -0.049 -0.072 -0.014 -0.011 -0.033 Gestational week 0.048 0.004 0.042 0.071 0.058 BMI -0.034 0.187a 0.031 0.107 0.039 Placenta thickness -0.003 0.075 0.139a 0.119a 0.073 AFI 0.024 -0.050 0.071 -0.092 -0.072
Abbreviations: AFI, amniotic fluid index; S1, maternal surface of central placenta; BMI, body mass index; S2, central part of central placenta; S3, fetal surface of central placenta; S4, central placental area.
aValues are different from 0 with a significance level alpha = 0.05.
ness did not change significantly with the GW. Increased stiffness in pregnant women with a high BMI and a thick placenta leads to the thought that obesity can cause an in-crease in velocity values by affecting placental histology, as with diabetes, and it increases the importance of an elas-ticity assessment.
Different velocity values were obtained from placental regions or maternal and fetal surfaces in the studies evalu-ating placental elasticity. When the ROI was placed at the initiation of cord insertion, elasticity was reported to in-crease in a study assessing placental elasticity (21). In our study, we observed that the fetal surface close to cord inser-tion showed a higher velocity value compared to the cen-tral placenta, whereas it had a lower velocity value com-pared to the maternal surface. In another study examin-ing the placental elasticity of pregnant women at GW 20 to 23, no significant difference was found between the
ve-locities measured from the peripheral or central parts of the placenta (12, 13). However, the maternal surface ve-locity values in the placentas of both preeclamptic and normal pregnant women were higher compared to those in other regions (13). In our study, the values obtained from the central placenta were higher than the periph-ery values, indicating the central region was harder, but this may be associated with the fact that the central region was thicker. A recent research study predicting the impor-tance of SWE in placental invasion has revealed that elastic-ity scores are different among the fetal side, maternal side and central portion of placenta, and the elasticity score is higher in invasive placentas (26). In our measurements performed within the central region itself, consistent with previous studies, the higher velocity of the maternal side may be attributed to the neighborhood surrounding the myometrium, which is harder than the placenta
Table 4.Correlation between Non-numeric Properties of Study Group and Mean SWE Velocity Valuesa Non-numeric properties S1 S2 S3 S4 P Placenta localization Anterior (n = 117) 2.59±0.74 2.32±0.79 2.44±0.85 2.57±0.38 2.32±0.82 Fundus (n = 7) 2.40±0.90 2.45±0.55 1.87±0.47 2.27±0.22 2.01±0.95 Fundus-posterior (n = 95) 2.42±0.84 2.17±0.66 2.25±0.82 2.35±0.38 2.29±0.75 Right side wall (n = 40) 2.49±0.83 2.25±0.71 2.46±0.83 2.52±0.32 2.28±0.75 Left side wall (n = 29) 2.65±0.80 2.11±0.69 2.16±0.84 2.48±0.35 2.42±0.71
P value (OneWay ANOVA) 0.478 0.443 0.142 < 0.001b 0.777
Placental grade
Grade 1 (n = 161) 2.51±0.77 2.29±0.72 2.36±0.87 2.49±0.37 2.30±0.81 Grade 2 (n = 95) 2.60±0.79 2.10±0.73 2.26±0.73 2.41±0.39 2.34±0.75 Grade 3 (n = 32) 2.35±0.94 2.44±0.69 2.46±0.96 2.58±0.36 2.26±0.74
P value (OneWay ANOVA) 0.282 0.033b 0.427 0.057 0.848
Trimester
2 (n = 159) 2.50±0.75 2.29±0.73 2.33±0.86 2.49±0.38 2.34±0.80 3 (n = 129) 2.56±0.85 2.18±0.72 2.35±0.81 2.46±0.38 2.27±0.76
P value (student’s t) 0.516 0.224 0.796 0.463 0.467
Abbreviations: S1, maternal surface of central placenta; S2, central part of central placenta; S3, fetal surface of central placenta; S4, central placental area.
aValues are expressed as mean±SD. bStatistically significant.
Table 5.Correlation between the Thickness of the Placenta with BMI and Gestational Week
Placenta thickness
r (95% CI) P value
Gestational week 0.584 (0.502 - 0.655) < 0.001a
BMI 0.382 (0.279 - 0.476) < 0.001a
Abbreviation: BMI, body mass index.
aStatistically significant.
The moderate and high-reliability values of SWE, with inter and intra-observer velocity measurements, are in-dicative of the fact that it is not a user-dependent test (14). However, because biological tissues are not homogeneous, knowing the fact that the tissue structure and side charac-teristics will affect the velocity of SWE by the operator, it is important to minimize measurement errors (6). Due to the non-homogeneous structure of the placenta, composed of decidua and chorionic layers rich in vessels, it is recom-mended to place the ROI on vessel-free homogeneous ar-eas and to leave some placental tissue between the ROI and side in the side samplings (27). To minimize the margin of error, we performed velocity measurements from homo-geneous areas. Although the measurement was reported to be affected by depth in previous studies (2,28), no sig-nificant difference was found, even at a depth of 1.5 - 7 cm in the study by Wu et al. (10). Ohmaru et al. also detected
no significant relationship between SWE velocity and a ROI depth up to 8 cm. However, they stated that the measure-ment became difficult if the depth exceeded 8 cm (14). In our study, we preferred the placental regions with anterior, lateral wall and fundus localizations, where we could mea-sure reliably closer than 10 cm.
Theoretically, the hardness of the placenta is expected to increase as the GW progresses. However, no significant relationship was found between trimester and SWE values in the studies conducted (10,14). It was noted that little change occurred in placental stiffness with gestation pro-gression and placental maturation, even if echogenicity, thickness and volume changed (29). In our study, the ve-locities obtained from the central part of the central pla-cental region with grade 3 appearances were found to be higher than those of the grade 2 placenta. In the study by Wu et al. (10), no association of SWE velocities was found with trimester, maternal age, placental localizations and sampling depth after examining the placentas of pregnant women in the second and third trimester. Furthermore, no relationship was detected between SWE velocities and GW in our study. SWE was also not associated with gravid-ity, parity and AFI. However, as the patient age decreased, we noted an increase in the mean velocity value in the S1 region. We also obtained higher values in the anteri-orly located placentas compared to the fundal, posterianteri-orly located placentas in the S4 zone velocity measurements. We did not observe different values in other regions and
Table 6.SWE Velocity Values according to Trimester from Placenta Measurement Regions
Trimester
2 3
SWE velocity values Mean±SD Min - Max Mean±SD Min - Max
S1 2.50±0.75 0.51 - 4.69 2.56±0.85 0.58 - 4.38
S2 2.35±0.75 0.25 - 4.10 2.25±0.74 0.20 - 4.00
S3 2.37±0.83 0.58 - 4.44 2.38±0.84 0.23 - 4.42
S4 2.50±0.42 1.50 - 3.76 2.53±0.43 1.69 - 3.74
P 2.25±0.71 0.62 - 4.25 2.32±0.73 0.38 - 4.02
Abbreviations: S1, maternal surface of central placenta; S2, central part of central placenta; S3, fetal surface of central placenta; S4, central placental area; SD, standard deviation.
placental localizations. The fundus-posterior localization may be the cause of the low velocity, which is the furthest localization in terms of sampling depth compared to the anterior localization. We did not detect any relationship between P zone velocity values and maternal and placen-tal characteristics. It can be resulted from thinness of pla-centa’s peripheral region.
Studies on the use and safety of the SWE technique have been carried out, and no histological evidence suggestive of thermal or mechanic damage has been found (21). The mechanical pushing index created by SWE is lower than the limits allowed by the US Food and Drug Administra-tion, and it is compatible with color Doppler US. Based on these results, it seems safe to be used in pregnancy (6,21, 30). The acoustic output settings used during the elasto-graphic examination were less than the limit set by the FDA.
Our study had limitations. An assessment could not be performed, as maximum penetration could not be pro-vided in the posteriorly located placentas, which led to a decrease in our total patient numbers. However, this can be considered a technical factor limiting its use in each pregnancy.
In conclusion, there was a difference in elasticity that was unaffected by GW between the regions and surfaces of the placenta. While the centre of the central region had the lowest velocity values, the maternal surface had the highest values. It may be convenient to use the SWE tech-nique with low user dependence in the follow-up of the pla-centas of high-risk pregnancies. However, considering the factors affecting placental pathology and the controversial study results, a significant number of large-scale studies is needed to strengthen the role of SWE in assessing placental pathologies.
Footnotes
Authors’ Contributions:Ay¸segül Altunkeser planned the study, and participated in its design and coordination and collected of data, performed US examinations and drafted
the manuscript. Ender Alkan collected of data and per-formed US examinations and design of figures. O˘guzhan Günenç and ˙Ismet Tolu collected of data and participated in its design. Muslu Kazım Körez performed the statistical analysis and tables and interpreted the data.
Financial Disclosure:None declared.
Funding/Support:This study was not funded by any orga-nization.
References
1. Wells PN, Liang HD. Medical ultrasound: Imaging of soft tis-sue strain and elasticity. J R Soc Interface. 2011;8(64):1521–49. doi: 10.1098/rsif.2011.0054. [PubMed: 21680780]. [PubMed Central: PMC3177611].
2. Shiina T, Nightingale KR, Palmeri ML, Hall TJ, Bamber JC, Barr RG, et al. WFUMB guidelines and recommendations for clin-ical use of ultrasound elastography: Part 1: Basic principles and terminology. Ultrasound Med Biol. 2015;41(5):1126–47. doi: 10.1016/j.ultrasmedbio.2015.03.009. [PubMed:25805059].
3. Palmeri ML, McAleavey SA, Fong KL, Trahey GE, Nightingale KR. Dy-namic mechanical response of elastic spherical inclusions to im-pulsive acoustic radiation force excitation. IEEE Trans Ultrason
Ferro-electr Freq Control. 2006;53(11):2065–79. doi: 10.1109/TUFFC.2006.146. [PubMed:17091842]. [PubMed Central:PMC1815395].
4. Nightingale K, Bentley R, Trahey G. Observations of tissue response to acoustic radiation force: Opportunities for imaging. Ultrason
Imag-ing. 2002;24(3):129–38. doi: 10.1177/016173460202400301. [PubMed: 12503770].
5. Athanasiou A, Tardivon A, Tanter M, Sigal-Zafrani B, Bercoff J, Deffieux T, et al. Breast lesions: Quantitative elastography with supersonic shear imaging–preliminary results. Radiology. 2010;256(1):297–303. doi:10.1148/radiol.10090385. [PubMed:20505064].
6. Bamber J, Cosgrove D, Dietrich CF, Fromageau J, Bojunga J, Calliada F, et al. EFSUMB guidelines and recommendations on the clinical use of ultrasound elastography. Part 1: Basic principles and technology.
Ul-traschall Med. 2013;34(2):169–84. doi:10.1055/s-0033-1335205. [PubMed: 23558397].
7. Arda K, Ciledag N, Aktas E, Aribas BK, Kose K. Quantitative assessment of normal soft-tissue elasticity using shear-wave ultrasound elastog-raphy. AJR Am J Roentgenol. 2011;197(3):532–6. doi:10.2214/AJR.10.5449. [PubMed:21862792].
8. Friedrich-Rust M, Nierhoff J, Lupsor M, Sporea I, Fierbinteanu-Braticevici C, Strobel D, et al. Performance of acoustic radiation force impulse imaging for the staging of liver fibrosis: A pooled meta-analysis. J Viral Hepat. 2012;19(2):e212–9. doi: 10.1111/j.1365-2893.2011.01537.x. [PubMed:22239521].
9. Yashima Y, Sasahira N, Isayama H, Kogure H, Ikeda H, Hirano K, et al. Acoustic radiation force impulse elastography for noninvasive assess-ment of chronic pancreatitis. J Gastroenterol. 2012;47(4):427–32. doi: 10.1007/s00535-011-0491-x. [PubMed:22065162].
10. Wu S, Nan R, Li Y, Cui X, Liang X, Zhao Y. Measurement of elasticity of normal placenta using the virtual touch quantification technique.
Ultrasonography. 2016;35(3):253–7. doi:10.14366/usg.16002. [PubMed: 27184654]. [PubMed Central:PMC4939723].
11. Chen KH, Chen LR, Lee YH. Exploring the relationship between preterm placental calcification and adverse maternal and fe-tal outcome. Ultrasound Obstet Gynecol. 2011;37(3):328–34. doi: 10.1002/uog.7733. [PubMed:20586039].
12. Cimsit C, Yoldemir T, Akpinar IN. Shear wave elastography in pla-cental dysfunction: Comparison of elasticity values in normal and preeclamptic pregnancies in the second trimester. J Ultrasound Med. 2015;34(1):151–9. doi:10.7863/ultra.34.1.151. [PubMed:25542951]. 13. Kilic F, Kayadibi Y, Yuksel MA, Adaletli I, Ustabasioglu FE, Oncul M, et
al. Shear wave elastography of placenta: In vivo quantitation of pla-cental elasticity in preeclampsia. Diagn Interv Radiol. 2015;21(3):202– 7. doi:10.5152/dir.2014.14338. [PubMed:25858523]. [PubMed Central: PMC4463268].
14. Ohmaru T, Fujita Y, Sugitani M, Shimokawa M, Fukushima K, Kato K. Placental elasticity evaluation using virtual touch tissue quantification during pregnancy. Placenta. 2015;36(8):915–20. doi: 10.1016/j.placenta.2015.06.008. [PubMed:26149518].
15. Marcy PY, Thariat J, Lacout A. Should we catch the train of shear-wave elastography? AJR Am J Roentgenol. 2012;198(6):W624–5. author reply W626. doi:10.2214/AJR.11.8078. [PubMed:22623583].
16. Sebag F, Vaillant-Lombard J, Berbis J, Griset V, Henry JF, Petit P, et al. Shear wave elastography: A new ultrasound imaging mode for the differential diagnosis of benign and malignant thyroid nodules.
J Clin Endocrinol Metab. 2010;95(12):5281–8. doi:10.1210/jc.2010-0766. [PubMed:20881263].
17. Arda K, Ciledag N, Gumusdag P. Differential diagnosis of malignant cervical lymph nodes at real-time ultrasonographic elastography and Doppler ultrasonography. Hung Radiol Online. 2010;6:12–5.
18. Golatta M, Schweitzer-Martin M, Harcos A, Schott S, Junkermann H, Rauch G, et al. Normal breast tissue stiffness measured by a new ultrasound technique: Virtual touch tissue imaging quantification (VTIQ). Eur J Radiol. 2013;82(11):e676–9. doi:10.1016/j.ejrad.2013.06.029. [PubMed:23932637].
19. Fontanilla T, Canas T, Macia A, Alfageme M, Gutierrez Junquera C, Malalana A, et al. Normal values of liver shear wave velocity in healthy children assessed by acoustic radiation force impulse imag-ing usimag-ing a convex probe and a linear probe. Ultrasound Med Biol.
2014;40(3):470–7. doi: 10.1016/j.ultrasmedbio.2013.10.024. [PubMed: 24361222].
20. Soliman AA, Wojcinski S, Degenhardt F. Ultrasonographic examina-tion of the endometrium and myometrium using acoustic radia-tion force impulse (ARFI) imaging technology: An initial experience with a new method. Clin Hemorheol Microcirc. 2015;59(3):235–43. doi: 10.3233/CH-141842. [PubMed:24840338].
21. Sugitani M, Fujita Y, Yumoto Y, Fukushima K, Takeuchi T, Shimokawa M, et al. A new method for measurement of placental elasticity: Acoustic radiation force impulse imaging. Placenta. 2013;34(11):1009– 13. doi:10.1016/j.placenta.2013.08.014. [PubMed:24075540]. 22. Vinnars MT, Nasiell J, Ghazi S, Westgren M, Papadogiannakis N.
The severity of clinical manifestations in preeclampsia correlates with the amount of placental infarction. Acta Obstet Gynecol Scand. 2011;90(1):19–25. doi: 10.1111/j.1600-0412.2010.01012.x. [PubMed: 21275911].
23. Hladunewich M, Karumanchi SA, Lafayette R. Pathophysiology of the clinical manifestations of preeclampsia. Clin J Am Soc Nephrol. 2007;2(3):543–9. doi:10.2215/CJN.03761106. [PubMed:17699462]. 24. Saha S, Biswas S, Mitra D, Adhikari A, Saha C. Histologic and
morpho-metric study of human placenta in gestational diabetes mellitus. Ital
J Anat Embryol. 2014;119(1):1–9. [PubMed:25345070].
25. Yuksel MA, Kilic F, Kayadibi Y, Alici Davutoglu E, Imamoglu M, Bakan S, et al. Shear wave elastography of the placenta in patients with gestational diabetes mellitus. J Obstet Gynaecol. 2016;36(5):585–8. doi: 10.3109/01443615.2015.1110120. [PubMed:27012734].
26. Cim N, Tolunay HE, Boza B, Arslan H, Ates C, Ilik I, et al. Use of ARFI elas-tography in the prediction of placental invasion anomaly via a new virtual touch quantification technique. J Obstet Gynaecol. 2018:1–5. doi: 10.1080/01443615.2018.1433646. [PubMed:29564950].
27. Li WJ, Wei ZT, Yan RL, Zhang YL. Detection of placenta elasticity mod-ulus by quantitative real-time shear wave imaging. Clin Exp Obstet
Gy-necol. 2012;39(4):470–3. [PubMed:23444746].
28. Doherty JR, Trahey GE, Nightingale KR, Palmeri ML. Acoustic ra-diation force elasticity imaging in diagnostic ultrasound. IEEE
Trans Ultrason Ferroelectr Freq Control. 2013;60(4):685–701. doi: 10.1109/TUFFC.2013.2617. [PubMed: 23549529]. [PubMed Central: PMC3679553].
29. Chen CY, Su HW, Pai SH, Hsieh CW, Jong TL, Hsu CS, et al. Evaluation of placental maturity by the sonographic textures. Arch Gynecol Obstet. 2011;284(1):13–8. doi:10.1007/s00404-010-1555-5. [PubMed:20556406]. 30. Palmeri ML, Frinkley KD, Nightingale KR. Experimental studies of the thermal effects associated with radiation force imag-ing of soft tissue. Ultrason Imagimag-ing. 2004;26(2):100–14. doi: 10.1177/016173460402600203. [PubMed:15344414].