NON-AGRICULTURAL EMPLOYMENT INCREASED DUE
TO INCREASE IN SERVICES EMPLOYMENT
Seyfettin Gürsel
*Gökçe Uysal
and Ayşenur Acar
Abstract
Seasonally adjusted labor market data shows that non-agricultural unemployment rate remained the same at 11.0
percent in the period of Mart 2014 compared to the period of February 2014. Increases observed in employment for
the period of March 2014 were mostly due to the strong increases in services employment. The increase in the
services sector was the strongest increase observed in the last two years. However, job growth in other sectors
remained weak. Employment increases in manufacturing decelerated, while employment in the construction sector
decreased in this period.
Annual increases in non-agricultural labor force and employment are over 1 million
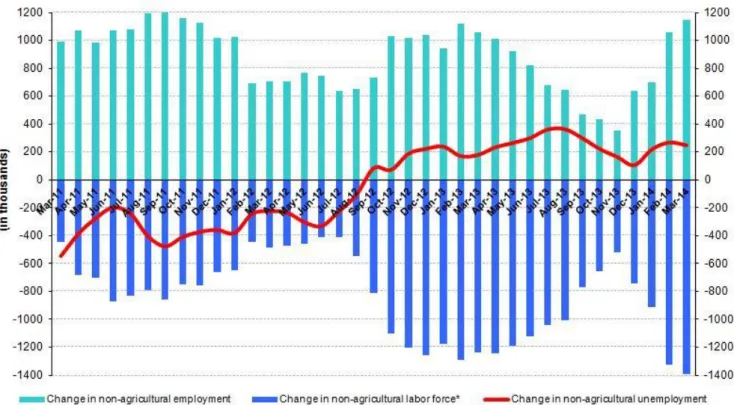
According to data released by TurkSTAT, non-agricultural labor force increased by 1 million 390 thousand (6.5
percent) and non-agricultural employment increased by 1 million 143 thousand (6 percent) in the period of March
2014 (Figure 1). Consequently, the number of persons unemployed in non-agricultural sectors increased by 247
thousand. We observe that annual increases in non-agricultural labor force and employment have been over 1
million for the last two periods.
Figure 1 Year-on-year changes in non-agricultural labor force, employment and unemployment
Source: TurkSTAT,Betam
*Prof. Dr. Seyfettin Gürsel, Betam, Director, [email protected]
Yrd. Doç. Dr. Gökçe Uysal, Betam, Vice Director, [email protected] Ayşenur Acar, Betam, Research Assistant, [email protected]
Labor Market Outlook:
June 2014
www.betam.bahcesehir.edu.tr
2
Non-agricultural unemployment stagnates
According to seasonally adjusted data, non-agricultural labor force increased by 79 thousand in the period of March
2014 compared to the period of February 2014, and reached 22 million 899 thousand (Figure 2, Table 1).
Non-agricultural employment increased by 70 thousand and reached 20 million 380 thousand. Hence, the number
of persons unemployed in non-agricultural sectors increased by 9 thousand and non-agricultural unemployment
rate remained the same at 11.0 percent in the period of March 2014 compared to the period of February 2014.
Figure 2 Seasonally adjusted non-agricultural labor force, employment and unemployment
Source: TurkStat,Betam
According to Kariyer.net data, non-agricultural unemployment might slightly increase in the next
period
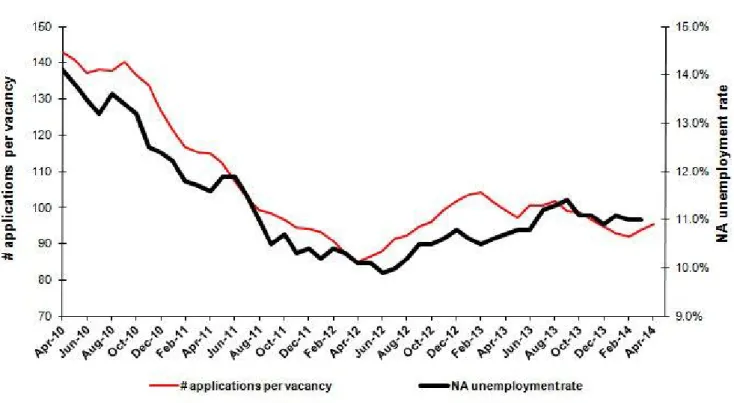
Our calculations based on the seasonally adjusted application per vacancy statistics calculated using Kariyer.net
1series indicate that we accurately predicted the direction of unemployment for the last two periods. The Kariyer.net
series also indicates that non-agricultural unemployment might slightly increase in the period of April 2014.
1 Betam has been calculating application per vacancy using series released by Kariyer.net for a while. Seasonal and calendar adjustment
procedure is applied to application per vacancy series. A decrease in applications per vacancy may be caused by an increase in vacancies or by a decrease in the number of applications. An increase in vacancies signals economic growth while decreasing number of applications indicates a decrease in number of people looking for a job. Monthly labor market series released by TurkStat is the average of three months. Therefore, application per vacancy statistics calculated using Kariyer.net series is the average of three months as well.
Figure 3 Seasonally adjusted non-agricultural unemployment rate and application per vacancy
Source: Kariyer.net, TurkStat,Betam
Services continue to create employment
Seasonally adjusted labor market series show that increase in non-agricultural employment was driven by
increases in services sector in the period of March 2014 (Table 2, Figure 4).
2Employment in the services sector
increased by 102 thousand from the period of March 2014 to the period of February 2014. This increase is
significantly higher than the average monthly increase of 45 thousand observed for the last two years. Strong
increases in manufacturing employment for the last three months seem to have ceased as employment in
manufacturing increased only 6 thousand in this period. Employment in construction sector decreased by 38
thousand, while employment in agriculture increased by 79 thousand.
2Employment in each sector is seasonally adjusted separately. Hence the sum of these series may differ from the seasonally adjusted series of
www.betam.bahcesehir.edu.tr
4
Figure 4 Employment by sectors (in thousands)
3Source: TurkStat,Betam
Table 1 Seasonally adjusted non-agricultural labor force indicators (in thousands)
Labor force Employment Unemployment Unemployment rate Monthly changes
February-11 19763 17431 2332 11.8% Labor force Employment Unemployment
March-11 19913 17583 2330 11.7% 150 152 -2 April-11 20069 17741 2328 11.6% 156 158 -2 May-11 20162 17763 2399 11.9% 93 22 71 June-11 20203 17799 2404 11.9% 41 36 5 July-11 20238 17911 2327 11.5% 35 112 -77 August-11 20204 17982 2222 11.0% -34 71 -105 September-11 20232 18108 2124 10.5% 28 126 -98 October-11 20172 18014 2158 10.7% -60 -94 34 November-11 20253 18167 2086 10.3% 81 153 -72 December-11 20285 18175 2110 10.4% 32 8 24 January-12 20408 18326 2082 10.2% 123 151 -28 February-12 20231 18127 2104 10.4% -177 -199 22 March-12 20394 18293 2101 10.3% 163 166 -3 April-12 20548 18473 2075 10.1% 155 180 -25 May-12 20663 18576 2087 10.1% 115 103 12 June-12 20677 18630 2047 9.9% 14 54 -40 July-12 20761 18685 2076 10.0% 84 55 29 August-12 20872 18743 2129 10.2% 111 58 53 September-12 21080 18867 2213 10.5% 209 124 85 October-12 21204 18978 2226 10.5% 124 111 13 November-12 21365 19100 2265 10.6% 160 122 38 December-12 21470 19151 2319 10.8% 105 51 54 January-13 21541 19258 2283 10.6% 72 107 -35 February-13 21498 19241 2257 10.5% -43 -17 -26 March-13 21583 19295 2288 10.6% 84 54 30 April-13 21760 19432 2328 10.7% 178 137 41 May-13 21793 19439 2354 10.8% 32 7 25 June-13 21789 19436 2353 10.8% -3 -3 0 July-13 21824 19380 2444 11.2% 35 -56 91 August-13 21899 19424 2475 11.3% 74 44 30 September-13 21964 19460 2504 11.4% 65 36 29 October-13 22022 19578 2444 11.1% 59 118 -59 November-13 22025 19580 2445 11.1% 2 2 0 December-13 22257 19831 2426 10.9% 232 251 -19 January-14 22531 20030 2501 11.1% 274 199 75 February-14 22820 20310 2510 11.0% 289 280 9 March-14 22899 20380 2519 11.0% 79 70 9
6
Table 2 Seasonally adjusted employment by sector (in thousands)
Agriculture Manufacturing Construction Service Monthly changes
February-11 5481 4767 1615 11050 Agriculture Manufacturing Construction Service
March-11 5465 4914 1628 11040 -16 147 13 -10 April-11 5357 4958 1632 11150 -108 44 4 110 May-11 5310 4915 1656 11192 -47 -43 24 42 June-11 5360 4826 1671 11302 50 -89 15 110 July-11 5378 4846 1698 11367 18 20 27 65 August-11 5440 4816 1757 11408 62 -30 59 41 September-11 5373 4866 1762 11481 -67 50 5 73 October-11 5410 4823 1681 11510 37 -43 -81 29 November-11 5404 4870 1674 11622 -6 47 -7 112 December-11 5331 4873 1643 11659 -73 3 -31 37 January-12 5339 4864 1718 11745 8 -9 75 86 February-12 5287 4808 1573 11746 -52 -56 -145 1 March-12 5235 4850 1589 11853 -52 42 16 107 April-12 5257 4930 1653 11890 22 80 64 37 May-12 5303 4908 1717 11951 46 -22 64 61 June-12 5247 4900 1729 12002 -56 -8 12 51 July-12 5245 4926 1718 12041 -2 26 -11 39 August-12 5239 4892 1753 12097 -6 -34 35 56 September-12 5305 4911 1776 12179 66 19 23 82 October-12 5350 4917 1786 12274 45 6 10 95 November-12 5362 5003 1808 12289 12 86 22 15 December-12 5348 5051 1791 12309 -14 48 -17 20 January-13 5338 5073 1835 12350 -10 22 44 41 February-13 5313 5023 1829 12389 -25 -50 -6 39 March-13 5302 5083 1812 12400 -11 60 -17 11 April-13 5283 5176 1811 12446 -19 93 -1 46 May-13 5226 5200 1735 12505 -57 24 -76 59 June-13 5177 5163 1752 12522 -49 -37 17 17 July-13 5173 5146 1695 12539 -4 -17 -57 17 August-13 5191 5117 1732 12574 18 -29 37 35 September-13 5189 5096 1767 12597 -2 -21 35 23 October-13 5106 5090 1853 12635 -83 -6 86 38 November-13 5070 5064 1808 12708 -36 -26 -45 73 December-13 5060 5131 1917 12783 -10 67 109 75 January-14 5410 5232 1988 12810 350 101 71 27 February-14 5551 5359 2069 12881 141 127 81 71 March-14 5630 5365 2031 12983 79 6 -38 102