Department of Biomedical Technologies Biomedical Technologies Programme
JANUARY 2018
IZMIR KATIP CELEBI UNIVERSITY GRADUATE SCHOOL OF SCIENCE ENGINEERING AND TECHNOLOGY
THE EFFECT OF RGD PEPTIDE ON CELL PROLIFERATION AND VASCULOGENESIS DURING MICROTISSUE FORMATION
M.Sc. THESIS Ziyşan Buse YARALI
(Y150101018)
Biyomedikal Teknolojileri Anabilim Dalı Biyomedikal Teknolojileri Programı
OCAK 2018
RGD PEPTİDİN MİKRODOKU OLUŞUM SÜRECİNDE HÜCRE ÇOĞALMASINA VE DAMARLANMA ÜZERİNE ETKİSİ
YÜKSEK LİSANS TEZİ Ziyşan Buse YARALI
(Y150101018)
Tez Danışmanı: Yrd. Doç. Ozan KARAMAN
v
Thesis Advisor : Assist. Prof. Ozan KARAMAN ... Izmir Katip Celebi University
Jury Members : Prof. Dr. Bahattin TANYOLAÇ ... Ege University
Assoc. Prof. Mustafa SOYÖZ ... Izmir Katip Celebi University
Assist. Prof. Ozan KARAMAN ... Izmir Katip Celebi University
Ziyşan Buse YARALI, a M.Sc. student of iKCU Graduate School of Science Engineering and Technology student ID Y150101018, successfully defended the thesis entitled “THE EFFECT OF RGD PEPTIDE ON CELL PROLIFERATION AND VASCULOGENESIS DURING MICROTISSUE FORMATION”, which she prepared after fulfilling the requirements specified in the associated legislations, before the jury whose signatures are below.
Date of Submission : 20 December 2017 Date of Defense : 5 January 2018
vii
ix FOREWORD
Foremost, I would like say thanks my advisor Assist. Prof. Dr. Ozan KARAMAN. His wide knowledge and logical way of thinking have been of great value for me. His understanding, encouraging, personal guidance have provided a strong basis for my studies and his information is very important in especially trouble experimental analysis.
I want to express my deep appreciation because of supporting during my training and job to Prof. Dr. Aydın AKAN. I would like thank for supporting and suggestions from different perspectives Assist. Prof. Dr. Utku Kürşat ERCAN and Assist. Prof. Dr. Nermin Topaloğlu Avşar.
I would like to express my special thanks to my dearest friends Serap AKDENİZ, Seda YAVUZ and Ali ÇEVİK. Although they were remote, I never miss their support. I want to say thanks lab friends, dear Günnur ONAK, Elif ÇUKUR, Çağla YILDIRIM, Yusuf Hakan USTA and Betül KÖKEN.
I would also like to acknowledge İzmir Katip Celebi University Scientific Research and Application Center BAP-2017-TYL-FEBE-0044 and 2016-ÖDL-MÜMF-0008 for the financial support.
I would like to express my thankfulness to my family starting with my dear mother Halise İlknur YARALI, and my dear father Sedat YARALI. Their support and love were very important for me and of course my confidant sister Zülal Beril YARALI and little brother Sedat Efe YARALI and finally I want to thank my big family and everyone who supports me.
xi TABLE OF CONTENTS Page FOREWORD ... ix TABLE OF CONTENTS ... xi ABBREVIATIONS ... xiii LIST OF TABLES ... xv
LIST OF FIGURES ... xvii
SUMMARY ... xix ÖZET ... xxi 1. INTRODUCTION ... 1 1.1 Purpose of Thesis ... 1 1.2 Literature Review ... 2 1.2.1 3D systems ... 2
1.2.2 Human umbilicial vein endothelial cell (Huvec) ... 4
1.2.3 Serum in microtissues ... 5
1.2.4 Biofunctional peptides ... 6
1.2.4.1 Rgd (grgds) peptides ... 7
1.2.5 Vascularization ... 9
1.2.5.1 Vascularization Markers ... 10
2. MATERIALS & METHODS ... 15
2.1 Peptide Synthesis ... 15 2.2 2D Cell Culture ... 15 2.3 3D Cell Culture ... 16 2.4 FBS Experiment ... 16 2.5 Differentiation Experiment ... 17 2.6 Vascularization Experiment ... 17
2.7 Live & Dead Assay ... 18
2.8 Actin Cytoskeleton / Focal Adhesion Staining Kit ... 18
2.9 Gene Expression Analysis ... 19
2.9.1 Rna isolation ... 19
2.9.2 Dnase treatment ... 19
2.9.3 Cdna synthesis ... 19
2.9.4 Realtime pcr ... 20
3. RESULTS ... 23
3.1 Identification Of Minimal Fbs Concentration On Microtissue ... 23
3.2 Determination Of Effective Rgd Ratio On Huvec Microtissue ... 27
3.3 Effect Concentration Of Rgd Peptides On Vascularize Huvec Microtissues .. 29
3.3.4 Vasculogenic gene expression analysis ... 33
4. DISCUSSION ... 39
4.1 Minimal Fbs Concentration In Huvec Microtissues... 39
4.2 Rgd Effect On Huvec Microtissue ... 40
4.3 Rgd Peptides On Pre-Vascularize Microtissue ... 42
5. CONCLUSION ... 47
xii
7. REFERENCES ... 51 CURRICULUM VITAE ... 59
xiii ABBREVIATIONS
3D : 3 Dimensional
MT : Microtissue
FBS : Fetal Bovine Serum
RGD peptide : R (Arginine), G (Glycine), D (Aspartic Acid) HUVEC : Human Umbilical Vein Endothelial Cell VEGF : Vascular Endothelial Growth Factor
PECAM-1 : Platelet Endothelial Cell Adhesion Molecule Ve-cadherin : Vascular Endothelial Cadherin
Tie-1 : Tyrosine-Protein Kinase Receptor-1 Tie-2 : Tyrosine-Protein Kinase Receptor-2
qRT-PCR : Quantitative Real Time Polymerase Chain Reaction
DMF : Dimethylformamide
HBTU N,N,N′,N′-Tetramethyl-O-(1H-benzotriazol-1-yl) uronium hexafluorophosphate, O-(Benzotriazol-1-yl) N,N,N′,N′-tetramethyluronium hexafluorophosphate
HOBt : 1-hydroxybenzotriazole
DIEA : /N,N-diisopropylethylamine
TFA : Trifluoroacetic Acid
TIPS : Triisopropylsilane
PBS : Phosphate Buffer Saline
EBM : Endothelial Basal Medium
xv LIST OF TABLES
Page
Table 2. 1: Vasculogenesis gene primer sequences [26, 67, 71, 74, 75]. ... 20
Table 3. 1: Effect of 0%, 1%, 5%, and 10% FBS containing media on the size of the microtissues at 1, 3, 5, and 7 day. (*p < 0.05, **p < 0.01, ***p < 0.001). . 25
Table 3. 2: Different RGD concentration on HUVEC microtissue formation. .... 28
Table 3. 3: Diameters of HUVEC vascularized mi crotissue in different RGD peptide. 31 Table 3. 4: VEGF fold differences during vasculogenesis. ... 33
Table 3. 5: Tie-1 fold differences during vasculogenesis. ... 34
Table 3. 6: Tie-2 fold differences during vasculogenesis. ... 35
Table 3. 7: PECAM fold differences during vasculogenesis. ... 36
xvii LIST OF FIGURES
Page Figure 1. 1: HUVEC 3D microtissue. ... 4 Figure 1. 2: HUVEC location in vascular structure. ... 5 Figure 1. 3: GRGDS peptides structure in solid phase peptide synthesis. ... 9 Figure 1. 4: VEGF effect in endothelial cell migration during vascularization [60].
11
Figure 1. 5: PECAM molecules and roles [68]. ... 12 Figure 1. 6: Role of PECAM and VE-cadherin molecules during vascularization
[70]. 13
Figure 2. 1: Fabrication of microtissue. ... 16 Figure 2. 2: Treatment of RGD peptides on 3D microtissue. ... 17 Figure 3. 1: Fabrication of scaffold-free microtissue. ... 23 Figure 3. 2: Micrographs of developed microtissues with 0% (A), 1% (B), 5% (C),
and 10% (D) FBS containing media at day 1. Scale bar represents 100 µm size. 24
Figure 3. 3: Micrographs of developed microtissues with 0% (A), 1% (B), 5% (C), and 10% (D) FBS containing media at day 7. Scale bar represents 100 µm size.
24
Figure 3. 4: Viability of cells within the microtissues for 0% (A), 1% (B), 5% (C), and 10%(D) FBS groups was examined on day 7. (green: LIVE cells, red: DEAD cells) (20x). Scale bar represents 100 µm size. ... 26 Figure 3. 5: Different concentration of RGD peptides on HUVEC microtissues at
1st, 3rd, 5th and 7th days. ... 27
Figure 3. 6: The viability of HUVEC microtissues in different RGD
concentrations. ... 29 Figure 3. 7: The micrographs of vascularized HUVEC microtissues in different
RGD concentration... 30 Figure 3. 8: Viability analysis of vascularized microtissue in different RGD
concentration. ... 32 Figure 3. 9: Actin flament & nucleus dye in vascularized microtissues. ... 33
xix
THE EFFECT OF RGD PEPTIDE ON CELL PROLIFERATION AND VASCULOGENESIS DURING MICROTISSUE FORMATION
SUMMARY
3D (Dimensional) microtissues are commonly used in regenerative medicine, medicine design, toxicology studies and advance cancer research. Microtissues which are constructed by this technique mimic natural in vivo condition and it stands for shifting form between in vitro studies and in vivo research. Scaffold-free microtissues produce own extracellular matrix and cells proliferate faster. However microtissue is used in vitro experiments, they mimic in vivo condition by producing own matrix.
Recently, RGD peptides which are commonly used biomaterials consist of GRGDS sequences and it has active role cell-cell and cell-matrix attachment. This peptide has been shown to enhance cell proliferation by increasing cellular interaction and cell-matrix connection in previous studies.
HUVEC (Human Umbilical Vein Endothelial Cell) is one of the most commonly used model cells to understand the endothelial cell behavior. Moreover, the inner layer of the vascular structure is composed of endothelial cells. HUVEC is one of the model cell types frequently used in vascularization studies with high vasculogenesis capacity and endothelial origin. VEGF, Tie-1, Tie-2, PECAM, and Ve-cadherin are also effective genes for expressing preliminary vascular model studies in microtissue studies.
This study was carried out to investigate the effect of RGD peptide on HUVEC scaffold-free 3D microtissue formation and early vasculogenesis. Microtissue size analysis, viability analysis, focal adhesion analysis and qRT-PCR (Real Time PCR) data were used. In the results of working, we found that RGD peptides increase HUVEC microtissue proliferation and contribute to constituting microtissue formation. Furthermore, it plays the effective role of HUVEC 3D microtissue formation during vascularization process. We experimented different RGD concentration on microtissue formation. The most effective amount of those peptides was shown as 2 mM RGD. 2 mM RGD microtissue formation as depicted from enhanced viability studies compared to 0 mM, 1 mM and 4 mM RGD concentration. microtissue diameter. Additionally, the morphology of cells described with focal adhesion analysis on microtissue. qRT-PCR data displays that RGD peptide helps to initiate vascular processing. Results of all data demonstrate that 2 mM RGD peptide has important tasks in 3D HUVEC microtissue formation and also regulated vascularization period. This study put forward the RGD peptides can be useful for constructing vascular formation. Therefore using optimal RGD peptide amount for vascular tissue may subvene in vivo to construct vascular networks.
xxi
MİKRO DOKU OLUŞUMUNDA RGD PEPTİDİNİN HÜCRE PROLİFERASYONUNA VE DOKU DAMARLANMASINA ETKİSİ
ÖZET
3B (Boyutlu) Dokular günümüzde rejeneratif tıp, ilaç keşifi, ileri kanser ve toksikoloji çalışmalarında sıklıkla kullanılmaktadır. Bu teknikle oluşturulan mikrodokular doğal ortamını taklit etmektedir ve in vitro ile in vivo arasında geçiş formunu oluşturmaktadır. Doku iskelesi olmadan oluşturulan mikrodokular kendi matriks yapılarını kendi üretmektedir ve hücreler böylece daha hızlı çoğalmaktadır. Mikrodoku oluşumu in vitro ortamda olmasında rağmen kendi matriksini kullanarak in vivo şartları taklit etmektedir.
Son yıllarda yaygın kullanılan biyomalzemelerden olan RGD peptidler, hücre-hücre ve hücre-hücre-yüzey tutunumununda etkili olan ve GRGDS diziliminden oluşan peptidlerdir. Önceki çalışmalarda bu peptidin hücre proliferasyonunu arttırdığı görülmüştür.
HUVEC (İnsan Kordon Damar Endotel Hücresi) endotel hücre davranışının anlaşılmasında en yaygın olarak kullanılan model hücrelerden birisidir. Ayrıca endotel kaynaklı olup mikrodoku oluşturma kapasitesi yüksek olan damarlanma çalışmalarında da sıklıkla kullanılan model hücre tiplerinden biridir. VEGF, 1, Tie-2, PECAM-1, Ve-cadherin gibi damarlanma da etkili olup mikrodoku çalışmalarında öncül model araştırması için ifade edebilen genlerdir.
Tüm bunlara bağlı olarak RGD peptidinin HUVEC 3B’lu mikrodoku oluşumuna ve erken dönem mikro vasküler yapılara etkisinin incelenmesi amacıyla bu çalışma yapılmıştır. Mikrodoku boyut analizi, canlılık analizi, fokal adezyon analizi, qRT-PCR (Real Time PCR) verileri kullanılmıştır. Çalışma sonucunda RGD peptidlerin HUVEC mikrodoku proliferasyonunu arttırdığı ve mikrodoku oluşumuna katkı sağladığı tespit edilmiştir. Ayrıca RGD peptidlerinin damarlanma sürecinde HUVEC 3 boyutlu mikrodoku oluşumunda etkili rol oynadığı tespit edilmiştir. Farklı RGD peptid konsantrasyonları mikrodoku oluşum sürecinde çalışma da kullanılmıştır. Bu peptidlerin en etkili miktarı 2 mM RGD olarak tespit edilmiştir. 2 mM RGD peptid, 0 mM, 1 mM and 4 mM RGD konsantrasyonlarıyla karşılaştırıldığında hücre canlılığının artmış olduğu saptanmıştır. qRT-PCR sonuçları RGD peptidin damarlanma sürecinin başlamasına yardımcı olduğunu göstermiştir. Tüm bu verilerin sonuçları 2 mM RGD peptidin 3B HUVEC mikrodoku oluşumunda önemli rol oynadığını ve de damarlanma sürecini de düzenlediğini göstermektedir. Bu çalışma RGD peptidlerin damar yapısı oluşturmada kullanılabilir olduğunu öne sürmektedir. Bu nedenle damar dokuları için optimal RGD peptid miktarını kullanımı in vivo damarlanma ağının oluşumuna destek sağlayabilir.
1 1. INTRODUCTION
Today, the use of biomaterials is rather widespread because of its ability to imitate natural environments in biomedical technologies. Tissue engineering aims to build the environment of the cells in the body as closely as possible. Interest in 3-dimensional (D) systems has increased in order to provide in vivo conditions. Besides, monolayer cell culture and microtissue with scaffold are limited in terms of mimicking ECM (extracellular matrix) and vascularization. 3D systems by supporting with biomaterials have possible to imitate the structure of nature. Moreover, a scaffold-free microtissue permit to the cell which synthesizes own matrix and demonstrates natural behaviors. Therefore, cells can construct vascularize formation. Especially, pre-vasculogenesis structures can be mimicked or pre-vasculogenesis may be induced with biomaterials by permitting self-assembly of endothelial cells. RGD peptides could increase the effects of vascularization in microtissue formation.
1.1 Purpose of Thesis
For all these reasons, the aim of the study is to identify the effect of RGD peptide on cell proliferation and vasculogenesis during microtissue formation by using scaffold-free 3D microtissue culture. We mainly focused on establishing a better understanding of below concepts:
Determination of the minimal serum concentration at which microtissue formation is maintained,
Identify the optimum concentration of RGD on HUVEC microtissue formation,
Determine the effect of RGD peptide on microtissue size, Describe microtissue viability with media which contains RGD, Construct pre-vascularize structure with HUVEC cells,
Analysis expression profiles of vascularization factors on HUVEC microtissue and find the effect of RGD peptides to those factors.
2 1.2 Literature Review
1.2.1 3D systems
In recent years, 3D cell culture studies have captured a significant trend in terms of proximity to the answers given by cells to many natural conditions; however, the most of these stduies were done in 2D condition (monolayer). 3D cells are separated from the monolayer cell culture and their biochemical processes in terms of both physiological and morphological aspects are different. 3D tissues serve many advantages in the way of mimicking living tissues according to monolayer culture [1-4]. Created microtissues with 3D cell culture exhibit different morphology, gene expression profiles [5] and physiological pathways which include cell signaling, differentiation capacity and proliferation rate from monolayer culture because of different parameters such as mechanical force in tissue, cell to cell connection and cell-matrix interaction [1-3, 6-11]. Although the traditional use of 2D cell cultures is often preferred in laboratories, monolayer techniques limit with cell-cell interaction in edge of cells, producing ECM proteins which are surface, stress fiber and focal adhesion proteins and cell organization [3]. It has low proliferation rate and it is shown loss of cellular structures due to differentiation capacity and different shapes of cells compared with 3D systems [1]. Additionally, it exhibits excessive spontaneous behaviors and just half of cell skeleton or less interacts with ECM [1]. Furthermore, 2D systems restrict mimicking in vivo conditions and it has low therapeutic effects in addition it limits in drug research [2, 4, 8, 11]. To eliminate all of the disadvantages of 2D monolayer cell culture, 3D systems which are more complicated were developed and usable of the technique has accelerated. Microtissues can overcome those drawbacks and also presents to better mimic in vivo conditions. It is important to note that design a great environment that mimics the living tissue as far as possible, 3D tissues can provide the best response of tissues because of results of grafting microtissues was observed more compatible than monolayer [2, 3]. Therefore, 3-D cell culture is characterized as a transitional form between 2-D cell culture and in vivo experiments [2-4, 6, 8, 11-15]. While in vivo tests have many disadvantages such as economic and ethical problems, 3D systems are very applicable, low cost and don’t include ethical problems so it is more preferable.
3 1. Hydrogel basement
2. Pre-producing scaffold
3. Self-assembly without scaffold
Hydrogel basement 3D cells place into a mold where includes some compound such as ECM materials, collagen, fibrin, Matrigel. Pre-producing scaffolds give permission to expand to cells in surface or cavities (polyurethane, polystyrene, and other compounds used in filter, beads, microtubes, and sponges). Self-assembly system allows cellular organization as scaffold-free which models are microtissues, aggregates, spheroids and cell sheets [1].
1.2.1.1 A scaffold-free technique: 3D petri dish
Tissue engineered 3D constructs are being generally formed on a matrix and implanted to in vivo to enhance tissue regeneration process [16]. Since all of the scaffold matrix cannot involve all the ideal properties for tissue formation, scaffold-free approach where 3D microtissue developed through cells own extracellular matrix mostly resemble the in vivo conditions. Comparing the conventional 3D scaffolding approach, self-assembly of cells into microtissue structures allows interactions among cells and extracellular matrix secretion without requirement of additional matrix material [17]. Scaffold-free approach can effectively overcome the limitations caused by scaffolding materials such as adequately mimicking the natural extracellular matrix, limited cell-cell communication, non-matching remodeling and degradation profile [18, 19]. Scaffold is often inadequate to mimic fundamental tasks of ECM that arrange cell-cell interaction in tissue microenvironments while scaffold-free microtissue technique uses cell gravitation dependent way and cells produce own matrix in addition to matrix components as self-assembly [1, 2, 4]. Other advantages of scaffold-free microtissues can be produced as large scale, handled and co-cultured. Moreover, it is easily monitored (Figure 1. 1) and manipulated in vitro experiments rather than 3D scaffold-free technique [2]. The technique has therapeutic benefits for tissue regeneration so it can be applicable in pre-clinical research [1, 2].
4
Figure 1. 1: HUVEC 3D microtissue.
Scaffold-free 3D microtissues are important for vascularization process because of self-producing of ECM. Scaffold-free microtissue mimics native tissue as closely as possible with regard to receptor expression, cell immigration, different transcriptional regulation, apoptosis profile, cellular homeostasis and cell-matrix communication [2, 3] during vascularization period [4]. One of the most important step for vasculogenesis is to wire between vascular structures. Scaffold-free microtissues permit this situation [2, 20]. Therefore, scaffold-free microtissue can be a way for understanding of fundemental function of RGD on vascularization period and expression profiles of its markers.
1.2.2 Human umbilicial vein endothelial cell (Huvec)
Endothelial cells have important effects in vascularization period because of tiny line consist of inner of vascular structures (Figure 1. 2) [21]. Human Umbilical Vein Endothelial Cells (HUVECs) are commonly used in 3D cell culture to enlight especially vasculogenesis, wound healing and osteogenesis process [3, 22-25]. Furthermore, HUVECs are considered promising cell sources for their capacity to differentiate into endothelial cells [11, 21, 23, 26]. The advantages of using HUVECs
5
are to be easily accessible from umbilical cord and taken by commercial. Moreover, the line express general physiological, pathological duration and also responsive to shear stress or other growth factors [21]. Additionally, HUVECs are applicable in 3D culture both monoculture and also co-culture form. It provides to estimate endothelial behaviors [3, 6, 21, 23, 27-29] but surface dependent endothelial cells may limit own tasks such as differentiation [30]. Furthermore, it can express handily the vascularization markers such as VEGF, PECAM, Tie-1 or Tie-2 [21, 25, 26]. For all reasons, HUVECs can ensure better analysis for underlying mechanisms of vascularization in 3D microtissue and effect of RGD during this process.
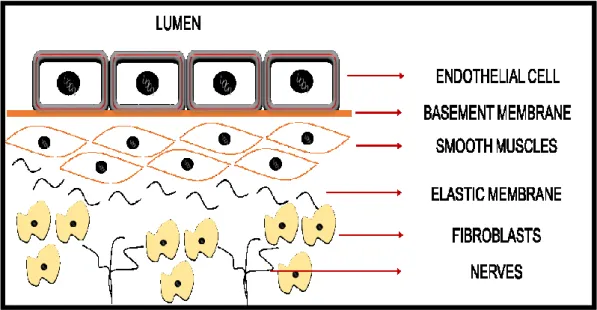
Figure 1. 2: HUVEC location in vascular structure. 1.2.3 Serum in microtissues
Microtissue formation in micro levels generally requires rich protein and growth factor concentration. Serum as media supplements is the major source of proteins and growth factors. However, the media that contains high serum and growth factor concentrations, it would be hard to identify different parameters such as proteins, cell-cell interaction and biomimetic peptides that are functional on microtissue formation [30]. Serum includes integrin binding proteins and this process is harder understanding of tasks of some molecules [31]. Serum also presents an environment where includes synthetic environment rather than natural [32]. Furthermore, using of serum could lead to contamination on experiments because it has a risk of pathogen contamination [33]. High dosage of serum may cause dead of cells and different concentration of serum can affect gene expression profile, growth
6
factors, hormones, cell proliferation regardless of source of other components in cell culture, differentiation profile in just the same as HUVEC [32]. The components of serums may be variable because obtained serum from the animal can be changed as far as animal diet, genetically differences [33]. The most common type of serum used in scaffold-free microtissue formation is FBS (fetal bovine serum) which attains from fetal bovine [33, 34]. FBS is used not only monolayer culture but also 3D systems and commonly used as 10 % [9, 33, 35].
In addition, in drug discovery studies serum-drug reaction might occur which inhibits exploring the effect of discovered drug molecules. Determining the minimal FBS content that allows initial microtissue formation could potentially be used for future tissue engineering and drug discovery studies [32].
Taking into account all of these, using of FBS can embower to describe the effect of RGD peptide and change expression profile of markers during vascularization.
1.2.4 Biofunctional peptides
Proteins that are indispensable materials of biological systems are large organic compounds that are formed as a result of the chain of polypeptides being linked together. Peptide fragments classify protein structures. Peptides have a wide range of the human body. Therefore peptides research has accelerated great rate [35, 36]. Tasks of effective polypeptide chain of proteins can be identified in laboratory conditions due to fundamental function or essential chain of protein can be described [36-38]. General describing of peptides can be done as a compound consisting of two or more amino acids linked as covalent bond in a chain. The carboxyl group of each acid is added to the amino group of the next by a bond of the type -OC-NH-.
Solid Phase Peptide Synthesis (SPPS) is a technique which can synthesize high purity peptides on solid resin and has low economical problems. SPPS is more preferable than traditional solution peptide synthesis methods because it has simple purification and isolation stage and available automatisation. Moreover, SPPS method runs extreme coupling reagent in reaction duration [39]. Carboxyl groups of C terminal of aminoacids bind to support materials which are named resin and reactive groups of aminoacids are protected by special chemical materials such as Fmoc or Boc. Whether binding of aminoacid to resin or aminoacid, ninhydrin test was used and if binding
7
process was normal, new aminoacid adding procedure could be continue but if aminoacids didn’t bind the resin, aminoacid was added again. After all amino acid sequences were correctly added to resin, deprotection procedure applies which is the last process of peptide synthesis. In this proceeding, constructed peptide separates from resin molecules [39, 40].
SPPS uses Fmoc (Fluorenylmethyloxycarbonyl chloride) and Boc (t‐ butyloxycarbonyl) chemical components as closed polar but commonly Fmoc is used to experiments due to low cost effect and it responses to therapeutic agents, medicinal chemistry and drug delivery studies. Fmoc SPPS is available for biological studies and easy to handle because it is corrosive when it faced with TFA in the synthetic cycles [41, 42]. While Boc group inhibits racemisation during activation and binding, Fmoc group releases a group of urethane conserving compounds containing the benzyl carbamate (benzyloxycarbonyl) which affect cellular functions [41].
Peptides in tissue engineering support to control cell culture by modifying chemical of surfaces and mimicking functions of proteins in organisms. After entered own task in the microenvironment, it can be easily degraded. In addition, cell attachment performance can be enhanced by coating surface of materials and how cells behave in material with peptide can be examined in medium without serum. Peptides capture a trend in drug delivery and gene therapy studies due to surface modification can be done by peptides [30, 36]. Another key point of using peptides is to promote cell proliferation via mimicking ECM proteins such as vitronectin, laminin and fibronectin in vitro. However, those ECM molecules are large protein sequences, large peptides are not stable form, hard to synthesis compared with short peptides. Althought, self-assembly can be observed in large peptides [31, 39] short peptides have many advantages and also commonly used in experiments because of all these disadvantages of large sequences [30].
Therefore, using small peptide sequences can be affected in HUVEC microtissue formation during vasculogenesis.
1.2.4.1 Rgd (grgds) peptides
Biomimetic materials are commonly used in different area, especially biomimetic materials in tissue engineering provide structural support and enlarge into a place for cells or tissue [31].
8
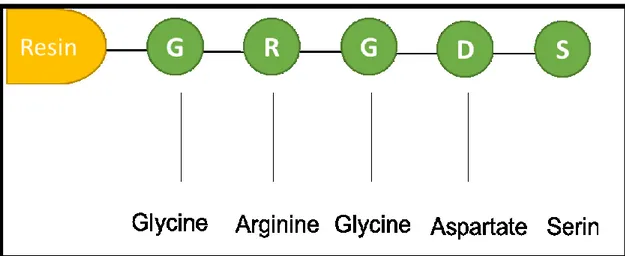
The most popular studied peptides are RGD peptides which consist of arginine (R), glycine (G) and aspartate (D) sequences and there are different RGD motif such as GRGDS (Figure 1. 3), RGDSC. Large motifs of RGD is more specific than only RGD sequences. The peptide has integrin binding task which binds to vitronectin, fibronectin, fibrinogen, osteopontin, laminin, collagen and bone sialoprotein [30, 31, 43-45].
The sequences are rather effective in attachment of cells and it provides high capability of integrin binding sites and regulation of cell affinity. While used natural ECM molecules lead to immune response and it has a risk grafted microbial contamination, RGD peptides don’t induce immune reactivity and it is applicable in clinical researchers. RGD synthesis has basic and handling process, adjustable concentration and low cost [31, 45]. It has regulated effect because RGD peptides attach fundamentally integrin molecules which have active roles in cell-matrix connection. It has also effective role in angiogenesis period [44, 46, 47]. It increases cell proliferation and cell growth [48]. Thus, the peptide can enhance attachment between cells and it can hold cells in specific ECM molecules. The performance of RGD peptides proceeds working period and stay stable in vivo and in vitro condition. It can modify in different surfaces and coat to implantable materials. Thus materials can gain functionality and be regulated such as cell migration [31, 37].
Effective unit of fibronectin molecules which is RGD acts together with other ECM molecules. Only RGD domain could not induce integrin signal pathways in native tissue [31, 49].
One of the drawbacks of RGD peptides is restricted describing of the molecular mechanism of RGD especially in HUVEC vascularization period [31]. Another disadvantage is different concentration of RGD which can cause unexpected results. RGD binds point of cell-matrix connection and it can be drag apoptosis pathway [50].
To eliminate disadvantages of RGD peptide, it is found optimum RGD quantity for HUVEC microtissue during vascularization. The sequence which is Arg-Gly-Asp did complex with some vascular specific proteins such as anginex and annastellin during vascularization and it regulates angiogenesis and vasculogenesis [51].
9
Figure 1. 3: GRGDS peptides structure in solid phase peptide synthesis. 1.2.5 Vascularization
Vascularization is a vital period to continue tissue viability. Because the vascular structures provide the delivery of the nutrient and oxygen that required by cells to the tissues. In addition, it helps to remove waste of cells [52]. Therefore, vascularization process is fundamental process for engineering of vascularized tissues. The vascular structure consists of 3 different layers: the tunica intima, the luminal layer, the tunica media, the middle region and the tunica adventitia, the outermost layer [52]. Endothelial cells are located in tunica intima [21, 37, 52]. The luminal layer is covered by the tunica intima where always face with blood circulation [30]. Both of layers consists of smooth muscle cells, fibroblast and ECM proteins such as collagen, laminin and elastin. The membrane provides endothelial cell attachment and structural integrity and the media supports physical durability [30, 37, 52]. While all of the large vascular structure contains triplicate of layers, thickness of the layers is varied in different places. When examined microvascular forms contains 3 steps which consist of precapillary, capillaries, and post capillary venules. Tasks of this structure generally delivery of nutrients and oxygen and also carry out wastes. Although the success of microstructures is poor in transplantation, it is ideal for describing of molecular mechanisms of vascularize networks [52]. New vascular structures construct 2-7 days and continue inflammation between 2-3 days. Vascularize grafts implanted after 7 days [53].
In vascularization process, HUVECs reproduce in matrigel environment with ECM proteins and differentiate to vascular structures [54]. Vascularization occurs with
10
2 complex process which is angiogenesis and vasculogenesis process that increases with growth factors such as VEGF. Stem cells differentiate endothelial cells in vascularization and take place assemblage of precursor cells. Consequently, new vessels form in angiogenesis [55]. Vascular structures are fundamental issue for all tissue applications especially in bone tissue, cancer, neurological studies, muscular and cardiovascular systems for understanding hypoxia and nutrient deficiency [56].
Genetic materials can be effective in vitro angiogenic and vasculogenic capacity [30, 57]. For example, VEGF and FGF enhance angiogenic capacity by proliferating endothelial cells and starting capillary networks [46, 57].
1.2.5.1 Vascularization Markers Vascular endothelial growth factor (VEGF)
A pro-angiogenic factor which is vascular endothelial growth factor (VEGF, VEGF-A and VPF) is a universal signaling marker in cancer, retinopathies and wound healing [58, 59]. It is important not only angiogenesis but also vasculogenesis. VEGF variants are expressed in different tissue such as myocardium, skeletal muscles, placenta, heart, colon and small intestine. It may be an important prognostic marker that identifies those disease with regard to vasculogenesis. It has the ability to start vascularization even when it is naked VEGF sequences alone [59]. It is a glycoprotein which has homodimeric structure. VEGF triggers vessel permeability and reproducing and migration of endothelial cells. In addition to VEGF downregulates in the dead of endothelial cells because of specific mitogen for endothelial cells. VEGF permits migration of endothelial cell (Figure 1. 4) which is important for vasculogenesis and angiogenesis periods and enhances endothelial cell proliferation [59, 60]. It can be affected from the environment which includes growth factors, hormones, cytokines, hypoxia and mechanical stress [61]. VEGF may even inhibit Tie expression [59].
VEGF expression analysis may give the great result for anti-angiogenic studies because it upregulates during the neo-vascularization period [59, 62].
11
Figure 1. 4: VEGF effect in endothelial cell migration during vascularization [60]. Tyrosine kinase-1 / Tyrosine kinase-2 (Tie-1 / Tie-2)
In angiogenesis, the receptor kinase signal of endothelial cells is provided by two fundamental genes which are VEGF and Tie (receptor tyrosine kinase) genes. Tie-1 and Tie-2 genes are expressed by endothelial cell in vascularization period [58, 63]. Suppressive Tie-1 may be lethal in organisms because of it is effectively another gene not only embryos but also adult tissues during angiogenesis process. Over-expressed marker in the late period whose described as Tie-1 is needed to construct and develop vascular structures. Tie-1 triggers not only inhibition of Tie-2 but also sustaining of Tie-2 expression in different conditions. As for Tie-2 which is another important factor in maturation and development of vascular structures. Tie-1 and Tie-2 genes construct heterocomplex structures. Tie-1 creates the complex which inhibits Tie-2 expression [63-65].
Platelet endothelial cell adhesion molecule (Pecam)
PECAM (Platelet Endothelial Cell Adhesion Molecule) is a member of immunoglobulin (Ig) family which plays role in endothelial cell connection, immunity, migration, hemostasis, inflammatory response as described in Figure 1. 5 [66-69]. PECAM has a task which response intracellular junctions, cellular regulation.
12
Upregulation of integrin proteins is directed by hemophilic engagement of PECAM-1. PECAM is not effective in integrin roles but it is affected by integrin. Effective role of PECAM in integrin molecules can activate tyrosine kinase receptors such as PDGF, FGF, VEGF, NGF, and M-CSF in endothelial cells. Another important role of PECAM in integrin binding capacity is cells communication and cell-matrix interaction. When PECAM was dephosphorylated, the amount of the other tyrosine kinase molecules increased. It is expressed within border of endothelial cells [68, 69].
Figure 1. 5: PECAM molecules and roles [68]. Vascular endothelial (Ve) cadherin
Vascular Endothelial (VE)-cadherin is a gene which has the important role in neo-vascular permeability, integrity and communication between endothelial cells (as presented in Figure 1. 6) during vasculogenesis [70-72]. It has several fundamental tasks such as cell cycle regulation, cell junction responsibility [71, 72], expression of the target gene and transcriptional factors, proliferation for vascular structure especially early period, cellular detachment and vascular structures like lumen formation. VE-cadherin works with other angiogenic and vasculogenic markers such as VEGF. VEGF and Ve-cadherin enhance vascular permeability and increase proliferation rate in angiogenic period. When VEGF expression increases, Ve-cadherin state promotes [72].
13
Figure 1. 6: Role of PECAM and VE-cadherin molecules during vascularization [70].
3D microtissues provide to produce own extracellular matrix and vascularization formation via self-assembly of endothelial cells [10]. FBS concentration is effective component in microtissue formation process while it has some disadvantages [32, 33]. HUVECs are model cell types in terms of understanding of endothelial cell behaviors and constructing vascularization [9]. RGD peptides are universal peptide units that bind integrin molecules which play role in cell-cell interaction and cell-matrix connection [73].
The questions of the thesis,
Which concentration of FBS does permit to construct HUVEC microtissue? Do RGD peptides affect cell-cell and cell-matrix communications during
HUVEC microtissue formation process?
Do RGD peptides influence pre-vascularization markers and contribute to vasculogenesis processing?
Therefore the hypothesis and methodology of the thesis investigate the effect of RGD peptide on cell proliferation in microtissue formation and find active marker expression during vascularization period related to RGD peptides.
15 2. MATERIALS & METHODS
2.1 Peptide Synthesis
Resin molecules were used to solid phase for attachment aminoacids. Molecular weight is calculated by the peptide calculation database. 900 mg of resin was weighed and swelled in 9 ml of DMF for 30 minutes. Aminoacids (4 eq), HBTU (2eq), HOBt (2 eq), DIEA(4 eq) were added the resin. Resins which are attached with Fmoc incubated 15 min. in 9 ml piperidine solution on shaker. It was washed with DMF 3times. It was done ninhydrin test to look at whether Fmoc tail diverged or not. 10µl of resin washed with (1ml) DIC. Kaiser Reagent A (pyridine-1eq), Reagent B (ninhydrin-1eq) and Reagent C (phenol-1eq) was added respectively. The resins were removed the tubes and waited 100oC 5 min. in heat block. Dark blue means that the
Fmoc has been opened. The resin was appropriated for adding an amino acid. 0,67 eq resin, 2 eq amino acid, 2 eq HBTU , 4 eq DIEA ve 2 eq HOBT was calculated per amino acid. Amino acid addition was performed in the nitrogen pyramid. Within 6 ml, dissolve all materials but then DIEA was added into the resin. 1.5 hour shaker is expected at 400 rpm. Kaiser Test is used to determine whether amino acids are attached. The yellow appearance of the resins indicated that the amino acid was bound. Then Fmoc tail diverged again and GRGDS sequences were continued till completely synthesized. TFA solution was prepared to cleavage. %95 TFA, %2,5 DI water, %2,5 TIPS solution was prepared and 2 ml added. It was gently shaked 1 hour per 20 min. The amino acids was precipitated into 30 ml cold (-20oC) diethylether solution. 2,5 ml
TFA solution was added again into resin tubes and also precipitated cold diethylether solution again. It was 10min. 4°C 17000 rpm centrifuged and after remove supernatant, the process was done 2 times. It was allowed to evaporate the ether 1 day overnight. Water was added until solubilized peptides. The water was evaporated with Freeze Dryer and it was provided the pure peptides. After synthesis of RGD peptides, HPLC measurement was done and the value of RGD peptides was used the least 70 % purity [40].
2.2 2D Cell Culture
HUVEC line was used between passage numbers 18-24. The line was taken from Ege University. Monolayer culture was done by DMEM (DMEM–Dulbecco's
16
Modified Eagle Medium, Sigma, D6046) which includes 1% L-Glutamine (Gibco, 25030081) and 1% Penicillin (Gibco, 15140122), %10 FBS (Fetal Bovine Serum, Sigma, F6765). Media was changed per 2 days. When HUVECs were 80-90% confluent, and they were washed 3 times with PBS and passaged to use for 3D cell culture by using trypsin-EDTA (Gibco, 15090046) solution. After 5 min., 5%CO2,
37oC in incubator, cells were centrifuged at 900 rpm, 4 oC, and 5 min. the number of
cells was calculated trypan blue dye.
2.3 3D Cell Culture
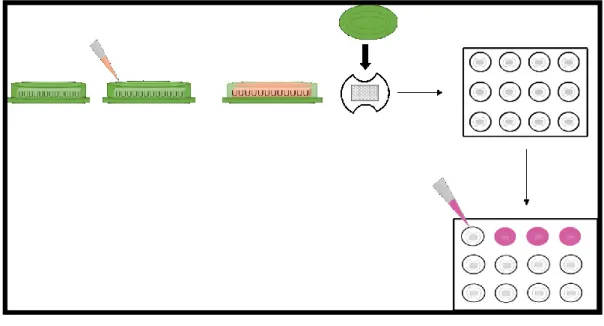
To construct the microtissue after providing sterile condition, 330 µl agarose gel was created by 3D petri dish (24 well) shown as Figure 2. 1. The agarose gel was incubated to accommodate at 30 min. with media and add HUVECs into agarose mold then waited 30 min. in incubator.
Figure 2. 1: Fabrication of microtissue. 2.4 FBS Experiment
18,000/ 75 µl cells were added into agarose mold. The experiment was realized in DMEM media with 1% L-Glutamine and 1% Penicillin and also different concentration of FBS. FBS was used 10%, 5%, 1% and 0%. %10 FBS was used as positive control. The media was changed once every 2 days with 500 µl.
The micrographs were taken at different magnification such as 10x and 40x the least 3 different well and 3 different agarose mold (n=9). Micrograph of microtissue
17
was taken by CellSense software and light microscope (Olympus). The diameter of microtissues was measured on 1st, 3rd, 5th, 7th by Image-J (NIH). The mean values and
standard deviations of all results were reported. The Student-t test was used to evaluate the results. A value of P*<0.05, P**<0,01 and P***<0,001 was considered statistically significant. The measurements were graphically created.
2.5 Differentiation Experiment
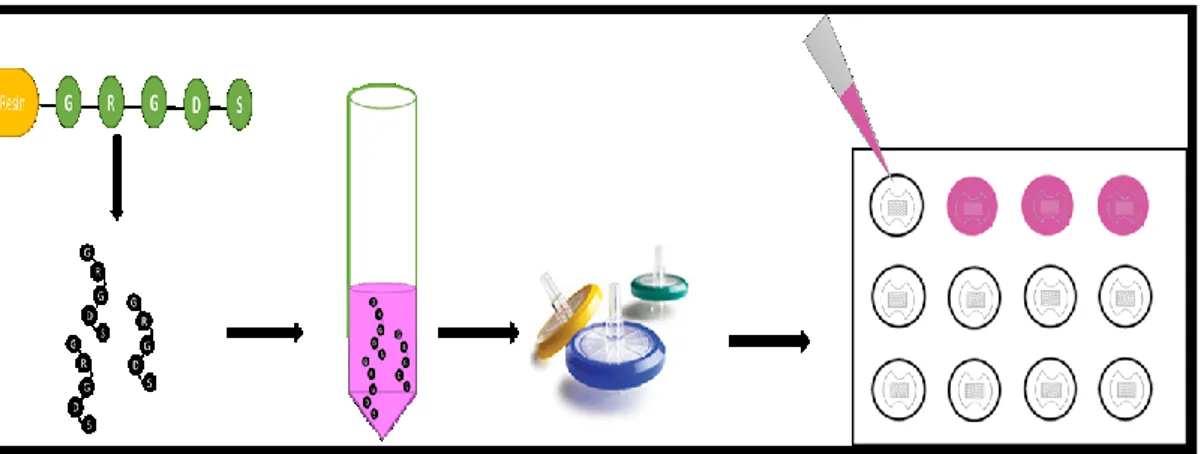
The experiment was realized with 60,000/ 75 µl cells. Peptides were mixed with EBM (Endothelial Basal Medium, Lonza) and were sterilized by filtering and also were used with 500 µl (Figure 2. 2). The groups were 4 mM RGD, 2 mM RGD, 1 mM RGD and 0 mM RGD without serum and 10% FBS group was used as positive control. The media was changed once every 2 days with 500 µl.
The micrographs were taken at different magnification such as 10x and 40x the least 3 different well and 3 different agarose mold (n=9). Micrograph of microtissue was taken by CellSense software and light microscope (Olympus). Diameter of microtissues was measured on 1st, 3rd, 5th, 7th by Image-J (NIH). The mean values and
standard deviations of all results were reported. The Student-t test was used to evaluate the results. A value of P*<0.05, P**<0,01 and P***<0,001 was considered statistically significant. The measurements were graphically created.
Figure 2. 2: Treatment of RGD peptides on 3D microtissue. 2.6 Vascularization Experiment
The study was performed with 100,000/ 75 µl cells. Peptides were mixed with EGM-2 Bullet Kit (Lonza, C3156) and were sterilized by filtering and also were used
18
with 500 µl. The groups were 4 mM RGD, 2 mM RGD, 1 mM RGD and 0 mM RGD without serum and 10% FBS group was used as positive control again. The medium with RGD was changed per 2 days.
The micrographs were taken at different magnification such as 10x and 40x the least 3 different well and 3 different agarose mold (n=9). Micrograph of microtissue was taken by CellSense software and light microscope (Olympus). Diameter of microtissues was measured on 1st, 4th, 7th by Image-J (NIH). The mean values and
standard deviations of all results were reported. The Student-t test was used to evaluate the results. A value of P*<0.05, P**<0,01 and P***<0,001 was considered statistically significant. The measurements were graphically created.
2.7 Live & Dead Assay
Double Staining Kit (Dojindo, Molecular Technologies, Inc, Japan) is used to demonstrate the rate of viable or dead cells in microtissue. The medium was attentively removed and the mold washed 3 times with PBS. Stock solution was prepared by using 1 mmol/L solution A-green (Calcein-AM/DMSO) and 1,5 mmol/L solution B-red (PI/purified water). The solution was applied by 500 µl. After incubation in 15 min., 37oC, the solution was removed and then washed 5 times with PBS again. The microtissues were observed under the fluorescent microscope (Olympus) in 10x and 40x magnification. Both live (green) and dead (red) cell micrographs were taken separately and merged with CellSense Entry software, too.
2.8 Actin Cytoskeleton / Focal Adhesion Staining Kit
This kit was used for understanding cell viability and cell configuration of microtissue. Phalloidin dyes actin filaments which are important for understanding of vascular structures. To understand the places of cell nucleus it was used DAPI dye. After removing the media from agarose mold washed 4 times with PBS without damaged the microtissue. Microtissue was fixed at 4% paraformaldehyde 20 min. at room temperature. They washed 3 times with PBS and incubated with 0.1% Triton X-100 in 1x PBS for 1-5 minutes at room temperature. They washed 3 times with PBS again. They blocked by using 1% BSA (Bovine Serum Albumin). TRITC conjugated Phalloidin was prepared as 1:1000 ratio within 1X PBS and incubated 60 min. each
19
agarose mold at room temperature. After 3 times washed with PBS, the mold treated with DAPI at room temperature 5 min. and washed 5 times with PBS, 5 min for each washing operation. The micrographs were observed under the fluorescent microscope (Olympus) in 10x and 20x into PBS. Red dye presents phalloidin and blue dye represents DAPI which is nucleus of cells. Cell micrographs were taken separately and merged with CellSense Entry software, too.
2.9 Gene Expression Analysis 2.9.1 Rna isolation
Agarose mold was washed 3 times with PBS. Microtissues were incubated with 0,2 % trypsin in PBS. The mold was centrifuged 900 rpm, 10 min. , at 4oC. Each mold
was checked until all microtissues were harvested. RNA Isolation Kit (Geneaid, RB100) kit was applied to all samples as protocols proposed. After harvesting in 300g 3 min. by centrifugation process, microtissues were lysed with RB Buffer. After washing with firstly W1 and then Wash Buffer solution, RNA was collected by 30 µl RNase Free Water. The concentration of RNA sample was calculated by nanodrop (Thermo, Nanodrop 2000) and stored -20°C.
2.9.2 Dnase treatment
After all of RNA eluted from microtissues, DNase Treatment was used for eliminate double strand DNA molecules. 0,1 volume TURBO DNase Buffer and Turbo DNase RNA was added into all RNA samples. After incubation 30 min. at 37°C, 0,1 volume DNase Inactivation Reagent was mixed with this solution. It was incubated 5 min. in room temperature. It was centrifuged in 10,000 g 1,5 min which provides precipitation of DNA molecules and RNA was carefully taken from supernatant. The study was recognize by TURBO DNA – Free (Ambion Life Technologies AM 1907).
2.9.3 Cdna synthesis
M-MuLV First Strand cDNA Synthesis Kit Protocol (Biomatiks, K5147) was used as described for all RNA samples on ice. After adding Oligo dT, Random Primer, dNTP Mix, Nuclease Free Water into 3 µl RNA, components were incubated at 65oC
20
PCR was realized as described at 25°C for 10 min, at 42°C 50 min, at 85°C for 5 min. and stored at -20°C.
2.9.4 Realtime pcr
All primers were taken as commercial by Generi, OligoTerm B (Table 2. 1). The sequences of primers:
GENES PRIMERS TM GAPDH F:GAAATCCCATCACCATCTTCC 54,3°C R:CCAGCATCGCCCCACTT 58,8°C VE-cadherin F: TCACCTGGTCGCCAATCC 57,8°C R: AGGCCACATCTTGGGTTCCT 58,9°C PECAM F: GCTGACCCTTCTGCTCTGTT 57,4°C R: TGAGAGGTGGTGCTGACATC 56,8°C VEGF F: ATCTTCAAGCCATCCTGTGTGC 57,6°C R: GCTCACCGCCTCGGCTTGT 64,3°C TIE-1 F: AGGTCACGCTTCGCGGCTT 63,2°C R:CCAAAACGGCCCTCTCTG 56,4°C TIE-2 F:TAGAGCCTGAAACAGCATACCAGG 58,5°C R:CTATTGGCAATGGCAAATGCTGGG 59,4°C
Table 2. 1: Vasculogenesis gene primer sequences [26, 67, 71, 74, 75]. For qPCR analysis, Power SYBR Green PCR Master Mix (Appliedbiosystems, 4367659 ) was used and the experiment was realized with StepOne Real-Time PCR Systems (Appliedbiosystems). To find the best primer efficiency ratio of GAPDH which is used for housekeeping gene, optimization was done. Other primers were normalized according to GAPDH. qPCR was realized with 20 µl by using 200 nmol 0,1mM primers, SYBR Master Mix, cDNA that diluted 1:10 ratio and water. qPCR steps:
Holding Stage: at 95oC 10 min.
Cycling Stage: at 95 oC 15 sec.
at 64,4 oC 1 min.
Cycling stage includes 40 cycle. The best Tm value is 64,4 oC for primers of
this experiment.
21 at 60 oC 1 min.
at 95 oC 15 sec.
The result of qPCR was analyzed by StepOne Software v2.3 and Ct values were classified by 2-ΔΔCt method. Every group was experimented in qPCR as doublet and
23 3. RESULTS
3.1 Identification Of Minimal Fbs Concentration On Microtissue
The microtissues with different FBS concentration were developed by using 3D petri dish technique as explained in methods section ( Figure 3. 1 (A-D)). The effect of different % FBS concentration researched on microtissue formation. The diameter of microtissues was calculated the least 3 times by Image-J Software (NIH) for each spheroid (n=9).
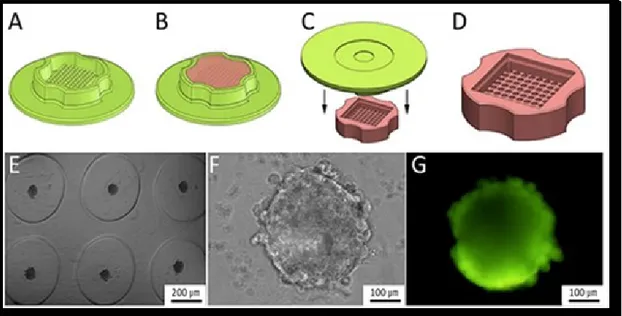
Figure 3. 1: Fabrication of scaffold-free microtissue.
(A) 3D Microtissue fabrication plastic mould, (B) Mould is filled with agarose, (C) 3D Petri dish of agarose gel separated from the mould, (D) Final 3D Petri dish, (E) Low (3x) and (F) high (20x) magnification of developed microtissues with 10% FBS
containing media, (G) A representative micrograph of the LIVE/DEAD assay of microtissues with 10% FBS containing media.
The low and high magnifications micrographs of 3D microtissues developed after 7 days of culture with 10% FBS included media were presented Figure 3. 1E and F. As depicted from the figure, microtissue formation successfully occurred with the initial cell concentration of 12.000 cells in 75 µl. It was also observed that cell viability is quite high in microtissues formed with 10% FBS included media (Figure 3. 1).
24
Figure 3. 2: Micrographs of developed microtissues with 0% (A), 1% (B), 5% (C), and 10% (D) FBS containing media at day 1. Scale bar represents 100 µm size.
Figure 3. 3: Micrographs of developed microtissues with 0% (A), 1% (B), 5% (C), and 10% (D) FBS containing media at day 7. Scale bar represents 100 µm size.
25
Table 3. 1: Effect of 0%, 1%, 5%, and 10% FBS containing media on the size of the microtissues at 1, 3, 5, and 7 day. (*p < 0.05, **p < 0.01, ***p < 0.001).
Early microtissue formation response of the monodispersed cells in 0%, 1%, 5% and 10% FBS concentrations were presented in Figure 3. 1 A, B, C, and D, respectively. Micrograph of microtissues was shown in Figure 3. 2 for the first day. The average diameters of microtissue like constructs for 0%, 1%, 5% and 10% FBS at day 1 are 277.1 ± 12.4, 287.6 ± 16.1, 294.7 ± 7.9, and 302.2 ± 2.2 µm, respectively. There was no statistically significant difference among the different FBS containing groups. Microtissue micrographs at day 7 for 0%, 1%, 5% and 10% FBS concentrations are presented in Figure 3. 3 A, B, C, and D, respectively. The average diameters of microtissue like constructs for 0%, 1%, 5% and 10% FBS at day 1, 3, 5 and 7 are given in Table 3. 1. The average diameter at day 7 for 0%, 1%, 5% and 10% FBS microtissue groups were measured as 229.4 ± 12.4, 310.9 ± 16.1, 332.4 ± 7.9, 368.5 ± 9.3 µm, respectively. It was observed that at day 5 and 7 the average diameter of the 10% FBS microtissue is significantly larger than 0% FBS (***p < 0.001). Moreover, at day 5 and 7, 1% and 5% FBS microtissue groups also formed
26
significantly larger microtissues compared to 0% FBS group (**p < 0.01). At day 3 the only significant difference was observed between the 10% FBS group and 0% FBS group (*p < 0.05).
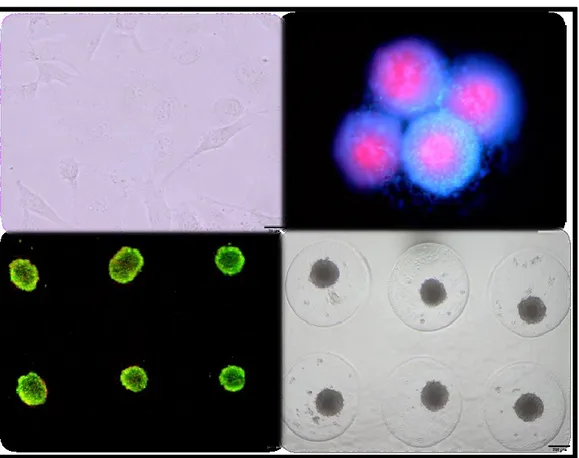
Figure 3. 4: Viability of cells within the microtissues for 0% (A), 1% (B), 5% (C), and 10%(D) FBS groups was examined on day 7. (green: LIVE cells, red: DEAD
cells) (20x). Scale bar represents 100 µm size.
The fluorescent microscopy images showing the live and dead cells for experimental groups of 0%, 1%, 5% and 10% FBS at day 7 were shown in Figure 3. 4 A, B, C, and D, respectively. It was examined 6 samples for all groups. The higher cell viability was observed in higher FBS concentration. For instance, 10% FBS constructs revealed highest green intensity with limited red intensity. Decreasing the FBS concentration to 5% and 1% red color intensity was increased which is directly related with higher dead cells compared to 10% FBS in all samples. Furthermore, 0% FBS microtissues showed highest red color intensity with limited green intensity at day.
27
3.2 Determination Of Effective Rgd Ratio On Huvec Microtissue
Containing different RGD concentration EBM (Endothelial Basal Medium) media was used for each group (n=6). The experiment was materialized 60,000 cell/75 µl. RGD peptides were calculated as 4 mM, 2 mM, 1 mM, 0 mM which is used as negative control and also 10 % FBS concentration was used as positive control. Diameters were measured at the least 3 times by Image-J Software (NIH). Figure 3. 5 represents micrograph of microtissues at 1st, 3rd, 5th and 7th days in 100 µm scale bar.
Figure 3. 5: Different concentration of RGD peptides on HUVEC microtissues at 1st, 3rd, 5th and 7th days.
A) 0 mM RGD at 1st day B) 0 mM RGD at 3rd day C) 0 mM RGD at 5th day D) 0 mM RGD at 7th day E) 1 mM RGD at 1st day F) 1 mM RGD at 3rd day G) 1 mM RGD at 5th day H) 1 mM RGD at 7th day I) 2 mM RGD at 1st day J) 2 mM RGD at
28
day N) 4 mM RGD at 3rd day O) 4 mM RGD at 5th day P) 4 mM RGD at 7th day Q) 10% FBS at 1st day R) 10% FBS at 3rd day S) 10% FBS at 5th day T) 10% FBS
at 7th day in 100 µm scale bar.
Table 3. 2: Different RGD concentration on HUVEC microtissue formation. Calculated diameter of microtissues was in Table 3. 2. The average size of microtissues in respectively 0 mM, 1 mM, 2 mM, 4 mM and also 10% FBS containing media was 115,94 ± 6,06, 118,13 ± 2,99, 123,65 ± 5,45, 155,97 ± 4,66, 196,63 ± 21,64 µm at 1st day. Statistical difference was found between %10 FBS group and 0 mM
RGD (p*<0,05). Additionally, 0 mM and 4 mM groups were significant as statistical (p**<0,01). Diameters of 0 mM, 1 mM, 2 mM, 4 mM and 10% FBS groups were calculated respectively as 306,98 ± 9,91, 312,03 ± 5,18, 356,85 ± 11,33, 414,73 ± 6,20, 416,00 ± 10,69 µm at 3rd day. Statistical analysis was observed that %10 FBS and 4
mM RGD peptides diameters were rather significant compared with 0 mM RGD (p***<0,001). 0 mM and 2 mM RGD peptide groups were significant different (p*<0,05). At 5th day, average diameters of 0 mM, 1 mM, 2 mM, 4 mM and 10 % FBS
microtissues were calculated respectively as 315,24 ± 8,35, 355,36 ± 14,94, 391,54 ± 5,93, 468,41 ± 7,39, 472,85 ± 7,72 µm. Statistical significant difference was found in %10 FBS, 4 mM and 2 mM RGD group compared with 0 mM RGD (p***<0,001). 1 mM RGD group had significant difference, too (p*<0,05).
29
To understand viability of microtissues, live and dead assay was applied and the highest ratio was observed in 2 mM RGD peptides after 10 % FBS as surveyed in Figure 3. 6.
Figure 3. 6: The viability of HUVEC microtissues in different RGD concentrations.
A) 0 mM RGD B) 1 mM RGD C) 2 mM RGD D) 4 mM RGD E) 10% FBS. To analyze the viability of microtissues, live&dead assay was applied in 0 mM RGD as negative control, 1 mM RGD, 2 mM RGD, 4 mM RGD and also %10 FBS at day 7th and as shown respectively Figure 3. 6 A, B, C, D and E. The experiment was fulfilled as triplicate (n=3) and it was taken 3 micrographs for each group. The group used as a positive control was the group of the highest viability microtissue. The highest red color intensity was observed in 0 mM RGD group. 0 mM and 1 mM RGD microtissues were observed as fewer cell viability. 2 mM RGD and 4 mM RGD microtissues were nearly equal to positive control, even 4 mM RGD microtissue demonstrated that the viability of cells was less than 2 mM RGD peptide at 7th day.
3.3 Effect Concentration Of Rgd Peptides On Vascularize Huvec Microtissues
The experiment was prepared as 5 group which are 0 mM RGD, 1 mM RGD, 2 mM RGD, 4 mM RGD and 10% FBS group. While 0 mM RGD was used as negative control, %10 FBS was used as positive control, again. Microtissues were growth in
30
EGM-2 Media (Endothelial Cell Growth Medium) with 100,000 cell/75 µl. The experiment was repeated the least 3 times and microtissues diameters were calculated the least 3 different microtissues (n=9) by Image-J (NIH). The micrographs were taken at 1st day, 4th day, 7th day and it presented in Figure 3. 7.
Figure 3. 7: The micrographs of vascularized HUVEC microtissues in different RGD concentration.
A) 0 mM RGD at 1st day B) 0 mM RGD at 4th day C) 0 mM RGD at 7th day D) 1 mM RGD at 1st day E) 1 mM RGD at 4th day F) 1 mM RGD at 7th day G) 2 mM RGD at 1st day H) 2 mM RGD at 4th day I) 2 mM RGD at 7th day J) 4 mM RGD at
1st day K) 4 mM RGD at 4th day L) 4 mM RGD at 7th day M) 10% FBS at 1st day N) 10% FBS at 4th day O) 10% FBS at 7th day scale bar used as 100 µl.
31
Diameters of canalized HUVEC microtissues to vascularization were presented in Table 3. 3. 0 mM RGD, 1 mM RGD, 2 mM RGD, 4 mM RGD and %10 FBS groups diameters were respectively 274,13 ± 8,96, 279,69 ± 8,96, 275,04 ± 8,46, 568,23 ± 55,76, 329,90 ± 12,07 at 1st day. Statistical analysis exhibited that 4 mM RGD and 10% FBS including media were significant by comparison with 0 mM control group (p***<0,001) at 1st day. At 4th day, 0 mM RGD, 1 mM RGD, 2 mM RGD, 4 mM RGD and %10 FBS groups were respectively calculated as 243,23 ± 6,96, 225,60 ± 6,96, 282,10 ± 9,15, 326,79 ± 18,59, 344,90 ± 18,86. Results of statistical analysis was demonstrated that only 1 mM RGD peptide was significant (p*<0,05) and the others were significant (p***<0,001). Diameters of 0 mM, 1 mM, 2 mM, 4 mM RGD and %10 FBS groups were respectively 228,26 ± 6,15, 218,18 ± 6,15, 294,41 ± 13,52, 310,15 ± 16,57, 353,66 ± 22,07 µm at 7th day. Statistical analysis has shown that
including 2 mM RGD, 4 mM RGD and %10 FBS microtissues diameters have had significant (p***<0,001). All data presented in Table 3. 3.
Table 3. 3: Diameters of HUVEC vascularized mi crotissue in different RGD peptide.
To understand the viability of canalized HUVEC microtissue to vascularization, Live & Dead assay experimented and results of the experiment presented in Figure 3. 8 A-E and micrographs represented 0 mM RGD, 1 mM RGD, 2
32
mM RGD, 4 mM RGD and %10 FBS, respectively at 7th day in 100µl scale bar. The
experiment was achieved as triplicate and micrographs were taken 3 different microtissues (n=3).
Figure 3. 8: Viability analysis of vascularized microtissue in different RGD concentration.
A) 0 mM RGD B) 1 mM RGD C) 2 mM RGD D) 4 mM RGD E) 10% FBS. 10% FBS group had the highest viability ratio and 0 mM RGD group had the highest dead cell ratio because of red color intensity. Likewise, 4 mM RGD group had the high level of red color intensity. 2 mM RGD peptides were similar to %10 FBS and 1 mM RGD peptide group included high viable cell and dead cell in outside of microtissues.
Focal adhesion dye was done to identify actin skeleton and determine the location of cells in microtissues. The experiment was realized triplicate and micrographs were taken 3 different microtissue (n=9) at 7th day in 100 µm scale bar.
Phalloidin dyes actin skeleton which is the red color and DAPI dyes nucleus of cells which is the blue color. Figure 3. 9 represents phalloidin & DAPI dye and Figure 3. 9 A-E represent respectively 0 mM RGD, 1 mM RGD, 2 mM RGD and 4 mM RGD and also %10 FBS.
33
Figure 3. 9: Actin flament & nucleus dye in vascularized microtissues. A) 0 mM RGD B) 1 mM RGD C) 2 mM RGD D) 4 mM RGD E) %10 FBS.
While microtissues containing 0 mM RGD peptide were observed as dispersed, 1 mM and 2 mM RGD peptide groups were constructed microtissue form but not 4 mM RGD group. 4 mM RGD group did not observe any microtissue form. It did not have nucleus form. %10 FBS group were constituted great microtissue.
3.3.4 Vasculogenic gene expression analysis
34
As described in Table 3. 4, VEGF expression of 0 mM, 1 mM, 2 mM and 4 mM RGD groups were calculated respectively 1,33 ± 0,02, 14,55 ± 1,89 which was found significant (p**<0,01), 9,94 ± 3,49, 2,85 ± 0,03 which was found significant (p***<0,001) fold at 1st day. VEGF expression of 0 mM, 1 mM, 2 mM and 4 mM
RGD groups were analyzed respectively 1,75 ± 0,02, 26,69 ± 2,91 which was found significant (p**<0,01), 24,88 ± 5,28 which was found significant (p**<0,01), 3,38±0,82 fold at 4th day. VEGF expression of 0 mM, 1 mM, 2 mM and 4 mM RGD
groups were measured respectively 3,01 ± 0,36, 41,20 ± 12,05, 57,56 ± 7,30 which was found significant (p*<0,05), 2,62 ± 0,46 fold at 7th day. The expression profile of
VEGF was observed that increased until 7th day in 1 mM and 2 mM group during
HUVEC vascularized microtissue while 4 mM group fold difference was not only relatively less than other group but also VEGF expression just increased at 4th day.
Table 3. 5: Tie-1 fold differences during vasculogenesis.
Expression of Tie-1 gene of 0 mM, 1 mM, 2 mM and 4 mM groups were respectively found as 1,09 ± 0,20, 7,90 ± 0,17 which was found significant (p***<0,001), 5,76 ± 0,74 (p**<0,01), 5,63 ± 1,96 at 1st day, 6,62 ± 1,16, 80,14 ± 3,66
(p***<0,001), 111,12 ± 4,11 (p***<0,001), 9,33 ± 0,84 at 4th day and 9,01 ± 1,74,
76,51 ± 11,78 (p**<0,01), 115,85 ± 11,94 (p**<0,01), 9,18 ± 1,24 at 7th day in Table
35
of microtissue while at 4th day and 7th day of 1 mM and 2 mM groups were
overexpressed and ratios were significant.
Table 3. 6: Tie-2 fold differences during vasculogenesis.
The differences fold of Tie-2 gene of 0 mM, 1 mM, 2mM and 4 mM were respectively calculated as 0,48 ± 0,11, 4,12 ± 0,52 which was found significant (p*<0,05), 1,01 ± 0,09 (p**<0,01), 1,65 ± 0,03 at 1st day, 1,34 ± 0,26 11,62 ± 2,01
(p*<0,05), 21,16 ± 4,07 (p*<0,05), 1,53 ± 0,27, at 4th day and 3,43 ± 0,19, 33,37 ±
7,97, 68,21 ± 11,99, 2,17 ± 0,28 each group was found significant (p*<0,05) at 7th day
(Table 3. 6). The expression of Tie-2 was observed as minimal in the first day in 1 mM and 2 mM RGD group which were overexpressed Tie-2 gene by RGD at 4th day.
36
Table 3. 7: PECAM fold differences during vasculogenesis.
Expression profile of PECAM of 0 mM, 1 mM, 2mM and 4 mM was respectively describe as 5,15 ± 1,00, 53,37 ± 4,11 which was found significant (p***<0,001), 49,54 ± 12,29 (p*<0,05), 6,81 ± 1,18 at 1st day, 1,67 ± 0,03, 68,16 ±
11,46 (p*<0,05), 116,08 ± 16,80 (p**<0,01), 10,83 ± 3,32, at 4th day and 5,81 ± 1,00,
14,71 ± 3,12, 18,55 ± 3,47 (p*<0,05), 16,25 ± 2,89 (p*<0,05) at 7th day (Table 3. 7).
PECAM as an early marker is overexpressed in 1 mM and 2 mM RGD groups especially 1st and 4th days. Over end of the microtissue vascularization, expression
37
Table 3. 8: Ve-cadherin fold differences during vasculogenesis.
Expression level of Ve-cadherin was respectively identified 2,68 ± 0,41, 1,90 ± 0,79, 3,14 ± 0,72, 2,28 ± 1,40 as at 1st day, 2,28 ± 0,87, 1,68 ± 0,04, 9,61 ± 2,36 which was
found significant (p*<0,05), 0,83 ± 0,02 at 4th day and 2,09 ± 0,68, 2,09 ± 0,57
(p***<0,001), 26,46 ± 2,23, 1,93 ± 0,24 at 7th day (Table 3. 8). Ve-cadherin level was
promoted significanly in 2 mM group at 4th and 7th day while Ve-cadherin level
![Figure 1. 4: VEGF effect in endothelial cell migration during vascularization [60]. Tyrosine kinase-1 / Tyrosine kinase-2 (Tie-1 / Tie-2)](https://thumb-eu.123doks.com/thumbv2/9libnet/3708592.24909/33.892.172.798.111.495/figure-effect-endothelial-migration-vascularization-tyrosine-kinase-tyrosine.webp)
![Figure 1. 5: PECAM molecules and roles [68]. Vascular endothelial (Ve) cadherin](https://thumb-eu.123doks.com/thumbv2/9libnet/3708592.24909/34.892.117.743.340.686/figure-pecam-molecules-and-roles-vascular-endothelial-cadherin.webp)
![Figure 1. 6: Role of PECAM and VE-cadherin molecules during vascularization [70].](https://thumb-eu.123doks.com/thumbv2/9libnet/3708592.24909/35.892.175.832.110.470/figure-role-pecam-ve-cadherin-molecules-vascularization.webp)
![Table 2. 1: Vasculogenesis gene primer sequences [26, 67, 71, 74, 75]. For qPCR analysis, Power SYBR Green PCR Master Mix (Appliedbiosystems, 4367659 ) was used and the experiment was realized with StepOne Real-Time PCR Systems (Appliedbiosystems)](https://thumb-eu.123doks.com/thumbv2/9libnet/3708592.24909/42.892.94.736.297.666/vasculogenesis-sequences-appliedbiosystems-experiment-realized-stepone-systems-appliedbiosystems.webp)