JHEP12(2019)059
Published for SISSA by SpringerReceived: December 26, 2018 Accepted: October 16, 2019 Published: December 9, 2019
Measurement of the differential Drell-Yan cross
section in proton-proton collisions at
√
s = 13 TeV
The CMS collaboration
E-mail: [email protected]
Abstract: Measurements of the differential cross section for the Drell-Yan process, based on proton-proton collision data at a centre-of-mass energy of 13 TeV, collected by the CMS experiment, are presented. The data correspond to an integrated luminosity of 2.8 (2.3) fb−1 in the dimuon (dielectron) channel. The total and fiducial cross section measure-ments are presented as a function of dilepton invariant mass in the range 15 to 3000 GeV, and compared with the perturbative predictions of the standard model. The measured differential cross sections are in good agreement with the theoretical calculations.
Keywords: Hadron-Hadron scattering (experiments), Particle and resonance production ArXiv ePrint: 1812.10529
JHEP12(2019)059
Contents
1 Introduction 1
2 The CMS detector 2
3 Data sets and simulated event samples 3
4 Event selection 3
5 Background estimation 4
6 Corrections 5
6.1 Detector resolution effects 7
6.2 Acceptance and efficiency 7
6.3 Efficiency correction 9
6.4 Final-state photon radiation effects 9
7 Systematic uncertainties 10
8 Results 11
9 Summary 23
The CMS collaboration 29
1 Introduction
Drell-Yan (DY) production of same-flavour, oppositely charged lepton pairs in proton-proton collisions occurs via the s-channel exchange of γ∗/Z bosons. Current theoretical predictions for the cross section are accurate up to next-to-leading order (NLO) in the elec-troweak (EW) coupling and up to next-to-next-to-leading order (NNLO) in perturbative quantum chromodynamics (QCD) [1–4]. Hence, a precision measurement of the differential cross section for the DY process at the LHC provides an important test of the perturbative framework of the standard model (SM). In a complementary way, the experimental results can also be used to constrain the parton distribution functions (PDFs). DY production of dileptons is also a major source of background for rare SM processes as well as searches for physics beyond the SM. Hence, it is important to measure the DY production rate accurately up to the largest accessible energy.
The single- and double-differential cross sections, dσ/dm and d2σ/dmd|y|, where m is the dilepton invariant mass and |y| is the absolute value of the dilepton rapidity, were previously measured by the ATLAS [5–7] and CMS [8–10] collaborations in proton-proton
JHEP12(2019)059
(pp) collisions for the centre-of-mass energy √s = 7 and 8 TeV at the LHC. Using early data collected in 2015 at √s = 13 TeV and corresponding to an integrated luminosity (L) of 81 pb−1, the ATLAS collaboration measured the Z production cross section times branching ratio of Z → `+`− near the resonance region [11]. This paper presents the first measurement of the DY spectrum dσ/dm over a wider invariant mass range using 2015 pp collision data collected by the CMS collaboration at √s = 13 TeV at the LHC, corresponding to L = 2.8 (2.3) fb−1 in the dimuon (dielectron) channel. The range of x, the momentum fraction carried by an interacting parton, covered by this measurement is 10−4 < x < 1.0.
The cross section as a function of invariant mass for a specific bin i is determined by the following relation:
σi = Ni
AiεiρiL, (1.1)
where Ni denotes the signal yield in a given bin i after subtracting the background. It is obtained using an unfolding technique to correct for the detector resolution effects and final-state photon radiation (FSR). The acceptance Ai and the experimental efficiency εi are obtained from the Monte Carlo (MC) simulation. A scale factor ρi accounts for any difference in the efficiency between data and simulation.
2 The CMS detector
The central feature of the CMS apparatus is a superconducting solenoid of 6 m internal diameter, providing a magnetic field of 3.8 T. Within the solenoid volume are a silicon pixel and strip tracker, a fine-grained and hermetic crystal electromagnetic calorimeter (ECAL), and a sampling hadron calorimeter, each composed of a barrel and two endcap sections. Extensive forward calorimetry with lead and quartz-fibre Cherenkov detectors complement the coverage provided by the barrel and endcap detectors. Muons are measured in gas-ionisation detectors using three technologies: drift tubes, cathode strip chambers, and resistive-plate chambers embedded in the steel flux-return yoke outside the solenoid.
The ECAL consists of about 76k lead tungstate crystals, which provide a coverage in pseudorapidity |η| < 1.479 in the barrel region and 1.566 < |η| < 2.5 in two endcap regions (EE). A preshower detector consisting of two planes of silicon sensors interleaved with a total of 3X0 of lead is located in front of EE. The momentum of an electron candidate is estimated by combining the measurements in the ECAL and tracker. The resolution of transverse momentum (pT) for electron candidate with pT about 45 GeV, ranges from 1.7% for nonshowering electrons in the barrel region to 4.5% for showering electrons in the endcaps [12].
Muons are measured in the range |η| < 2.4. Matching the track of a muon candidate to that measured in the silicon tracker results in a pT resolution of 1.3–2.0% in the barrel
and better than 6% in the endcaps for muons with 20 < pT < 100 GeV. The resolution is better than 10% for muons with pT up to about 1 TeV [13].
The first level of the CMS trigger system [14], composed of custom hardware processors, uses information from the calorimeters and the muon detector to select the most interesting
JHEP12(2019)059
events at a level of 1 in 104within 4 µs. The high-level trigger, consisting of processor farms, uses the complete information from the detector to reconstruct the event and discriminate further to reduce the selection rate to less than about 1 kHz, before data storage. A more general description of the CMS detector with a definition of the coordinate system used and the relevant kinematic variables, can be found in ref. [15].
3 Data sets and simulated event samples
The collision data used in this analysis is collected with an inclusive single-muon (electron) trigger. The events in the dimuon channel are triggered by the presence of at least one muon candidate with pT > 20 GeV and |η| < 2.4. The events for the dielectron channel
are triggered by an electron with pT> 23 GeV and |η| < 2.5, satisfying loose identification and isolation criteria.
Various MC samples are used to simulate the DY signal and background processes. The MadGraph5 amc@nlo v2.2.2 [16] event generator is used to simulate the signal and W production in association with one or more jets (W+jets) events at NLO accuracy in the QCD coupling constant, αS. Pair production of top quarks (tt ) and single top quark production in association with a W boson (tW and t W) are generated at NLO using powheg v2.0 and v1.0 respectively [17–21]. Diboson processes (WW, WZ, and ZZ) are simulated at leading order with pythia v8.212 [22]. All samples are generated with the PDF package of NNPDF3.0 [23,24]. The pythia generator with the underlying event tune CUETP8M1 [25] is used for the showering and hadronisation in all samples. For simulations at NLO, jets from matrix element calculations and parton showering are merged using the FxFx prescription [26]. The total production rate for each process is normalised using the most accurate theoretical cross section value available. The DY process is normalised to the predicted cross section calculated using the MadGraph5 amc@nlo. The tt rate is normalised to the predicted cross section using a calculation performed with NNLO+NNLL (next-to-next-to-leading logarithm) accuracy [27]. The normalisations for the single top quark and diboson samples use cross section values available at NLO accuracy [28,29].
In all the MC samples, the detector response is simulated using a detailed description of the CMS detector based on the Geant4 [30] package. The simulated events are recon-structed using the same software as the real data. Minimum bias events are superimposed on the simulated physics processes to emulate the effects of multiple interactions per bunch crossing (pileup); typically an average number of 11. All MC samples are reweighted to provide the same pileup distribution observed in the data.
4 Event selection
Each reconstructed offline muon candidate is required to meet identification criteria that are based on the number of hits found in the tracker, the response of the muon detectors, and a set of criteria based on the matching between the muon track parameters as measured by the inner tracker and muon detectors. Furthermore, the two muon candidates are required to share a well-defined common vertex. To reject cosmic ray muons that can appear to
JHEP12(2019)059
be back-to-back muon pairs, the transverse impact parameter with respect to the centre of the interaction region is required to be small and the opening angle between the two candidates should be differ from π by more than 5 mrad. In order to suppress nonprompt muon candidates from heavy flavour decays, muons are required to be well-isolated within a cone of size ∆R = 0.3, where ∆R = p(∆η)2+ (∆φ)2. More details on the muon reconstruction, identification and isolation criteria used in this analysis can be found in refs. [13].
The offline reconstructed electron candidates are required to pass identification criteria that are based on electromagnetic shower shape variables. Electron candidates originating from photon conversions are suppressed by requiring that they have at most two missing inner tracker hits and that they are not consistent with being part of a conversion pair. The isolation of an electron candidate is defined by measuring the sum of energy deposits associated with the photons as well as with the charged and neutral hadrons reconstructed by the particle-flow (PF) algorithm [31] with the same cone size as for the muons. The electron selection is based on the ratio of the PF isolation to the pT of the electron
can-didate. More details about electron reconstruction and identification criteria used in this analysis are given in refs. [12,32].
For the offline analysis the leading muon (electron) candidate in the event is required to have pT > 22 (30) GeV and the subleading candidate pT > 10 GeV. All muon candidates are required to satisfy |η| < 2.4, and all electron candidates should satisfy |η| < 2.5, while excluding the barrel-endcap transition region of the ECAL (1.44 < |η| < 1.57). The two muon candidates are required to have opposite charges, and the pair with the best fit of the dimuon vertex is selected if there is more than one candidate pair in the same event. No opposite-charge and same-vertex requirements are applied in the dielectron channel to avoid a selection inefficiency. At least one of the two candidate leptons, selected in the event, is required to match the object that triggered the events.
The reconstructed dilepton invariant mass distribution can be affected by an imperfect measurement of the momentum and energy of the lepton candidates. Momentum scale corrections for the muons are applied using the procedures described in refs. [10,33]. The electron energy deposits, as measured in ECAL, are subject to a set of corrections involving information from both the ECAL and tracker [12,32].
The measurements are performed in 43 bins of dilepton invariant mass. The binning at m < 600 GeV is identical to that used in the earlier measurement [10], although the highest bin is extended to 3000 GeV. The highest mass events observed in the data set are about 2.3 TeV in both channels.
5 Background estimation
The background composition varies across the dilepton invariant mass range, with the dominant backgrounds over the entire mass range being tt , tW, and t W production, except for the region below the Z boson peak, where DY production of τ+τ− pairs and their subsequent decays to electron and muon pairs constitute a significant background. In the dimuon channel, the QCD multijet background is relatively large at low mass, below
JHEP12(2019)059
about 60 GeV. However, in the dielectron channel, it contributes significantly in the high mass region as well.
The main backgrounds are estimated from data using control samples to reduce the systematic uncertainty due to the imperfect knowledge of the theoretical cross sections for the SM processes. For tt , tW, t W, τ+τ−, and WW production, the contributions are estimated from a large data sample containing electron-muon pairs of opposite charge; the identification criteria used to select this sample are the same used to select the signal samples (described in the previous section). The rates are twice as large as those for dimuon or dielectron events; however, the contributions of the same-flavour final states are scaled after correcting for the relevant detector acceptance and efficiency.
The QCD multijet and W+jets processes contribute to the background mainly when one or more jets are misidentified as electron or (less likely) as muon candidates; the contri-butions are estimated using the “misidentification rate” method described in refs. [9,34]. The misidentification rate is measured as a function of muon and electron pT in the bar-rel and endcap regions separately. Subsequently, the misidentification rate is applied to events with loosely isolated leptons, after subtracting the contributions of genuine dilepton events. The contributions from genuine lepton candidates from DY and tt production are subtracted using a lepton distribution fit obtained from the simulation. The misidentifi-cation rate in the dimuon channel is defined as the ratio of the number of isolated muon candidates passing the muon identification criteria and the number of muon candidates passing the muon identification with no isolation requirement. For this measurement a data sample selected with the single-muon trigger is used. The definition of the misiden-tification rate in the dielectron channel is slightly different and is calculated by measuring the probability of a jet passing the final electron selection criteria described above. For this measurement, a large unbiased event sample has been used, selected with a combination of single-photon triggers rather than electron triggers. The fraction of misidentified lepton backgrounds is generally less than 1% across the entire mass range in the dimuon channel and up to 3% (5%) below (above) the Z boson peak in the dielectron channel.
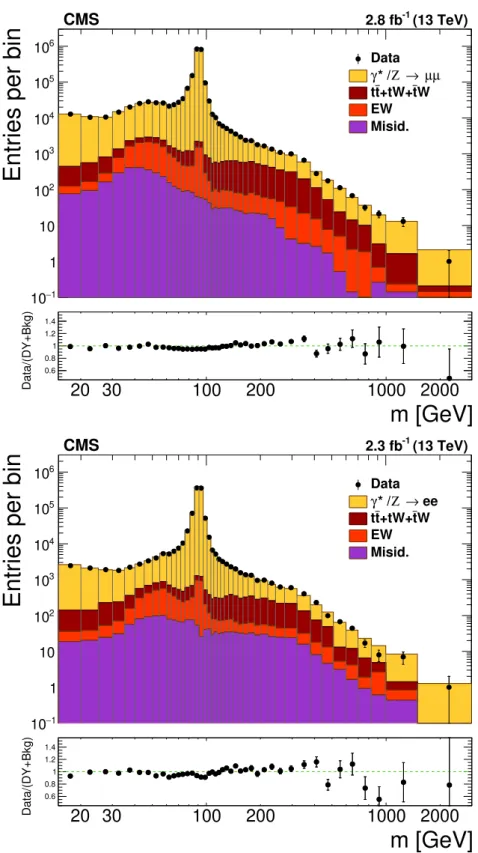
The contribution from WZ and ZZ processes are evaluated using simulation. The photon-initiated (PI) production of same-flavour lepton pairs is estimated with the fewz 3.1 package [35,36], using the LUXqed photon PDF [37]. Events generated with pythia are used in the MRST2004qed PDF set as a cross-check [38]. The contributions from PI production are negligible, except in the high mass region [39].
Figure 1 presents the dilepton invariant mass distributions in dimuon and dielectron channels. The cumulative yields from the signal and the background discussed above are superimposed on the data.
6 Corrections
To compare the measured distributions with the theoretical predictions, various experimen-tal corrections need to be applied after subtracting the toexperimen-tal expected background from the observed number of events in each mass bin. The correction for the detector resolution effects is implemented using an unfolding technique, similar to that used in the previous
JHEP12(2019)059
Entries per bin
1 − 10 1 10 2 10 3 10 4 10 5 10 6 10 Data µ µ → Ζ * / γ W t +tW+ t t EW Misid. CMS 2.8 fb-1 (13 TeV)
m [GeV]
20 30 100 200 1000 2000 Data/(DY+Bkg) 0.6 0.8 1 1.2 1.4Entries per bin
1 − 10 1 10 2 10 3 10 4 10 5 10 6 10 Data ee → Ζ * / γ W t +tW+ t t EW Misid. CMS 2.3 fb-1 (13 TeV)
m [GeV]
20 30 100 200 1000 2000 Data/(DY+Bkg) 0.6 0.8 1 1.2 1.4Figure 1. The observed dimuon (top) and dielectron (bottom) invariant mass spectra within the detector acceptance. The “EW” label indicates the contributions from the DY production of τ+τ−, WW, WZ, and ZZ processes. The “Misid.” label corresponds W +jets and QCD multijet backgrounds. Each MC process is normalised using the most accurate theoretical cross section value available. The error bars on the data points represent the statistical uncertainty only.
JHEP12(2019)059
measurement [10]. The event acceptance and selection efficiency are estimated using sim-ulation and are used to correct the data. Any difference in the selection efficiency between the data and simulation is corrected for using a scale factor. Finally, the correction required to account for the effects of FSR on the invariant mass of the lepton pair is applied, using so-called “dressed leptons” and further unfolding. The details of the correction procedures are discussed below.
6.1 Detector resolution effects
The detector resolution occasionally leads to migration of events from mass bin k of the generator level distribution to another bin i of the reconstructed distribution. This effect is corrected by unfolding using the iterative D’Agostini method [40] with a response matrix. The iteration is terminated when the difference between the result and the previous one is less then 0.1% in the entire mass bin. The validity of the unfolding method is tested on simulated events.
The elements of the detector response matrix, Tik, are calculated using the DY sim-ulation sample. Each element contains the fraction of events that migrated from the kth bin of the generator level (the post-FSR level, described in section 6.4) mass distribution to the ith bin of the reconstructed mass distribution, such that
Nobs,i =X
k
TikNgen level,k. (6.1)
The effect of the unfolding on the differential cross section is largest in the Z boson peak region because of the narrow width, where the effect on the signal yield is observed as large as 30 and 40% in the dimuon and dielectron channels, respectively.
6.2 Acceptance and efficiency
The acceptance is defined as the fraction of simulated signal events with both leptons passing the nominal pT and η requirements of the analysis mentioned in section 4, with respect to the full phase space. The efficiency is defined as the fraction of simulated signal events that lie within the acceptance and that satisfy all the event selection criteria. The following equation defines the acceptance and efficiency for a given mass bin:
A ε = NA Ngen
Nε
NA, (6.2)
where Ngen is the total number of generated signal events, NA is the number of events
passing the acceptance criteria, and Nε is the number of reconstructed events passing the full event selection. Figure 2 shows the variation of the acceptance and efficiency as functions of the dilepton invariant mass in the dimuon and dielectron channels. The acceptance correction is not applied to the fiducial cross section, but it is applied to the result in the full phase space, as described in section 8.
JHEP12(2019)059
m (post-FSR) [GeV]
20 30 100 200 1000 2000Fraction of events
0 0.2 0.4 0.6 0.8 1Α
ε
ε
×
Α
Simulation CMS 13 TeV µ µ → Ζ * / γm (post-FSR) [GeV]
20 30 100 200 1000 2000Fraction of events
0 0.2 0.4 0.6 0.8 1Α
ε
ε
×
Α
Simulation CMS 13 TeV ee → Ζ * / γFigure 2. The signal acceptance (A), efficiency (ε) and their product for each invariant mass bin in the dimuon (top) and dielectron (bottom) channels, calculated from simulation. The error bars on the data points represent the statistical uncertainty only.
JHEP12(2019)059
6.3 Efficiency correction
To correct for the difference in efficiencies between data and simulation for lepton recon-struction, identification, isolation, and trigger, scale factors are determined from the data using the “tag-and-probe” method [41]. Events are selected that contain a dilepton pair near the resonance region where the background is very small. One lepton is required to satisfy the tight selection and the other is used as the probe lepton. The efficiency is then determined from the number of probe leptons that also pass the required selection criteria. The measured efficiency using the tag-and-probe method is parametrised as a function of lepton pT and η and is then factorised into the reconstruction, identification, and isolation related components. The overall efficiency is then given by
εevent = ε`1ε`2εevent, trig, (6.3) where ε`
1,2 are the single-lepton efficiencies of the individual leptons and εevent, trig is the trigger efficiency for the event [9,10].
The scale factor between data and simulation is determined by the ratio εdata(event)/ εMC(event). The scale factors are measured to be 0.92–0.97 (0.95–0.97) in the dimuon
(dielectron) channel; the values are dependent on the data-taking period. The scale factors are then applied to the simulation to correct for the observed differences.
6.4 Final-state photon radiation effects
The FSR from a lepton shifts the measured invariant mass of the dilepton pair to lower values, which significantly affects the distribution below the Z boson peak, especially in the dielectron channel. The definition of “dressed lepton” accounts for the required correc-tion for a given flavour so that the results from the individual channels can be combined subsequently for comparison with the theoretical predictions. The four-momentum of the “dressed lepton” is defined as
pdressed` = ppost-FSR` + Σpγ, (6.4)
where the four-momenta of all the simulated photons originating from the leptons are summed within a cone of ∆R < 0.1 around the candidate lepton, where ∆R is the sep-aration of the photon from the lepton in η–φ space. This enables to correct the lepton momentum to compensate missing momentum due to the FSR.
The FSR correction is estimated separately using an unfolding technique from a signal MC sample where the FSR is simulated by pythia. The response matrix is produced using the information about dressed and post-FSR leptons in the simulation. The correction to the cross section, defined in terms of dressed leptons using data corresponding to a post-FSR lepton, is in the range of 0.78–1.09 (0.58–1.27) in the dimuon (dielectron) channel. The FSR correction is not applied to the fiducial cross section, but it is applied to the result in the full phase space described in section 8.
JHEP12(2019)059
7 Systematic uncertainties
Systematic uncertainties are the dominant source of the total uncertainty in this measure-ment for m < 400 GeV.
In the dimuon channel, the efficiency scale factor (which includes muon reconstruction, identification, isolation, and trigger selection) is the most significant component of the systematic uncertainty below the Z boson peak. A variety of possible contributions to the efficiency scale factor are listed:
• statistical uncertainty associated with the tag-and-probe procedure; • binning in muon pT and η;
• shape hypotheses for the signal and the background in the fit model;
• other minor sources, such as the number of mass bins chosen, the selected mass range, and the kinematic selection criteria.
Uncertainties for all the sources are evaluated separately and are combined in quad-rature.
Detector resolution effects, including the muon momentum scale correction, are major sources of systematic uncertainty in the dimuon channel. Both data and simulation are smeared by varying the muon momentum scale within its uncertainty. The difference between the cross section values obtained with and without the smearing is assigned as a systematic uncertainty in each mass bin. In addition, contributions to the uncertainty relating to the unfolding of the detector resolution are:
• the statistical uncertainty in the response matrix due to the finite size of the MC sample;
• the systematic uncertainty in the response matrix arising from the differences in the MC modeling, as determined by comparing two different MC generators: powheg and MadGraph5 amc@nlo.
In the dielectron channel, the dominant systematic uncertainty below the Z boson peak is the efficiency scale factor, as in the dimuon channel. Though the method to calculate this uncertainty is therefore similar, the possible sources are slightly different from those in the dimuon channel:
• statistical uncertainty associated with the tag-and-probe procedure; • shape hypotheses for the signal and the background in the fit model; • difference between the NLO and LO MC samples;
JHEP12(2019)059
Detector resolution effects, including the electron energy scale and smearing correc-tions, are another significant systematic uncertainty in the dielectron channel. This uncer-tainty is determined with a method similar to that used in the dimuon channel, where the simulation is varied by the electron energy scale correction and smeared with the uncertain-ties. The difference between the central value and the smeared result for the cross section is assigned as the uncertainty. In addition, two other sources of systematic uncertainty in the detector resolution unfolding are considered for the dielectron channel: the statistical uncertainty in the response matrix and the difference between MC models. The uncertainty in the MC modeling is derived by comparing the results based on MadGraph5 amc@nlo with those based on events reweighted with fewz package.
In both channels, the statistical uncertainty in the data sample, used for the back-ground estimation, is one of the sources of systematic uncertainty; it is the dominant component in the higher mass region, above 200 GeV.
The difference between the background contributions estimated using control samples in data and the predictions from the MC simulation is one of the systematic uncertainty sources. In the cases where the background rates are estimated from MC simulation, the corresponding uncertainty in the predicted cross section is included as a systematic uncer-tainty although the contribution is negligible compared with other unceruncer-tainty components in the entire mass range.
The systematic uncertainty related to the acceptance is dominated by the theoretical component, which originates mainly from imperfect knowledge of nonperturbative effects, such as the PDFs. The PDF uncertainties are estimated using the NNLO version of fewz package and the FSR correction is applied in the calculation by using the dressed-lepton definition.
The difference between MadGraph5 amc@nlo and fewz in the prediction of the DY differential cross section is assigned as an additional uncertainty in the acceptance. The uncertainty in the cross section due to the variation of the strong coupling constant, αS,
is estimated by varying the input value for the NNLO PDF used along with fewz. The model-dependent FSR simulation is another source of uncertainty and it is eval-uated by comparing the results from the pythia and photos 3.56 [42] generators. The difference in the cross section, after the FSR correction using dressed leptons, between the unfolding procedures of the pythia and photos generators is assigned as a systematic uncertainty.
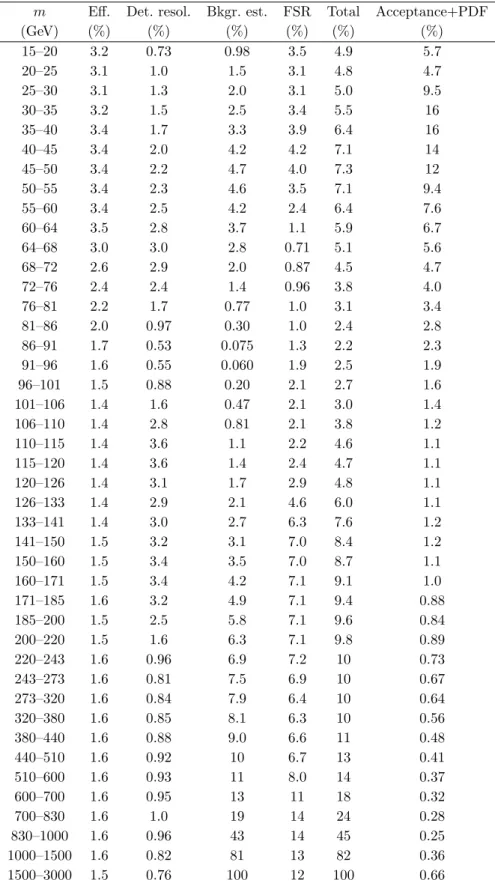
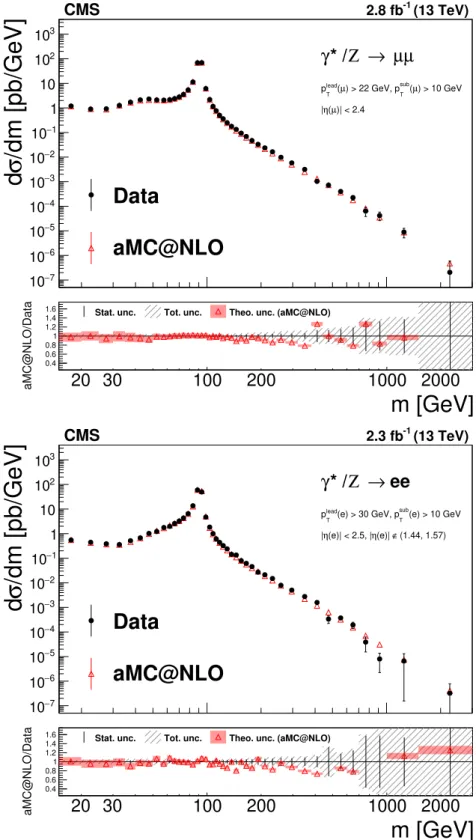
The uncertainty on the integrated luminosity measurement, based on pixel cluster counting in the silicon pixel detector, is 2.3% [43]. Figure3shows the estimated systematic uncertainties obtained in each mass bin; these are also summarised in table 1 (2) for the dimuon (dielectron) channel. The uncertainty due to the acceptance and the PDFs originates from incomplete theoretical knowledge and is categorised separately from the other components, which are experimental in nature and are labelled “Total”.
8 Results
The differential cross section, in the full phase space, is estimated by extrapolation from the measurement within the fiducial region after the application of the set of corrections
JHEP12(2019)059
m [GeV]
20 30
100
200
1000 2000
Relative uncertainty [%]
1 −10
1
10
210
Statistical Int. lumi. Total systematic Acceptance + PDF Efficiency SF Detector resolution Background FSRCMS
2.8 fb-1 (13 TeV) µ µ → Ζ * / γm [GeV]
20 30
100
200
1000 2000
Relative uncertainty [%]
1 −10
1
10
210
Statistical Int. lumi. Total systematic Acceptance + PDF Efficiency SF Detector resolution Background FSRCMS
2.3 fb-1 (13 TeV) ee → Ζ * / γFigure 3. Summary of the systematic uncertainties on the differential cross section measurement dσ/dm [pb/GeV] in the dimuon (upper) and dielectron (lower) channels. The “Total systematic” is a quadratic sum of all systematic uncertainty sources except for the “Acceptance + PDF”.
JHEP12(2019)059
m Eff. Det. resol. Bkgr. est. FSR Total Acceptance+PDF(GeV) (%) (%) (%) (%) (%) (%) 15–20 3.5 1.9 0.28 0.13 4.0 5.6 20–25 3.5 1.6 0.61 0.26 3.9 4.8 25–30 3.6 1.3 0.45 0.35 3.9 12 30–35 4.0 1.1 0.89 0.38 4.3 9.5 35–40 4.2 1.0 0.98 0.39 4.5 5.6 40–45 4.0 0.95 1.3 0.40 4.3 2.0 45–50 3.3 0.94 1.2 0.47 3.7 1.6 50–55 2.7 0.94 1.1 0.65 3.1 1.7 55–60 2.3 0.95 1.2 0.89 2.9 1.8 60–64 2.1 0.94 0.83 1.1 2.7 2.0 64–68 1.6 0.91 0.72 1.3 2.4 2.0 68–72 1.4 0.86 0.66 1.5 2.3 2.1 72–76 1.1 0.82 0.30 1.5 2.1 2.1 76–81 1.0 0.83 0.20 1.5 2.0 2.1 81–86 1.1 0.94 0.082 1.6 2.1 2.0 86–91 1.3 1.2 0.042 1.6 2.4 2.0 91–96 1.4 1.6 0.042 1.8 2.8 1.9 96–101 1.5 1.9 0.075 1.9 3.1 1.7 101–106 1.6 2.2 0.20 1.9 3.3 1.6 106–110 1.7 2.4 0.46 1.9 3.5 1.4 110–115 1.8 2.5 0.73 1.8 3.6 1.3 115–120 1.9 2.6 1.0 1.6 3.8 1.2 120–126 2.1 2.8 1.4 1.5 4.0 1.1 126–133 2.3 2.9 1.8 1.5 4.4 1.1 133–141 2.3 3.1 2.2 1.6 4.7 1.0 141–150 2.4 3.3 2.6 1.9 5.2 0.98 150–160 2.4 3.6 2.9 2.2 5.6 0.95 160–171 2.7 3.9 3.3 2.2 6.1 1.2 171–185 2.9 4.0 3.8 2.2 6.6 0.88 185–200 3.1 3.8 4.7 2.2 7.1 1.0 200–220 3.4 3.3 5.8 2.3 7.8 1.2 220–243 3.6 2.9 7.0 2.6 8.8 0.90 243–273 3.8 2.6 8.1 2.9 9.8 0.77 273–320 3.9 2.7 8.8 3.3 11 0.73 320–380 3.9 3.2 9.2 3.4 11 0.65 380–440 4.1 4.0 9.5 3.5 12 0.73 440–510 4.2 4.9 9.5 3.6 12 0.64 510–600 4.2 5.5 9.4 3.8 12 0.45 600–700 4.3 6.0 9.1 4.2 12 0.30 700–830 4.3 19 8.7 4.7 22 0.45 830–1000 4.4 18 8.2 5.0 21 0.76 1000–1500 4.5 17 7.9 5.3 20 1.2 1500–3000 4.7 150 7.7 5.5 160 1.7
Table 1. Summary of the systematic uncertainties (%) for the dσ/dm (pb/GeV) measurement in the dimuon channel. The column labelled “Total” corresponds to the quadratic sum of all the experimental sources, except for that Acceptance+PDF.
JHEP12(2019)059
m Eff. Det. resol. Bkgr. est. FSR Total Acceptance+PDF(GeV) (%) (%) (%) (%) (%) (%) 15–20 3.2 0.73 0.98 3.5 4.9 5.7 20–25 3.1 1.0 1.5 3.1 4.8 4.7 25–30 3.1 1.3 2.0 3.1 5.0 9.5 30–35 3.2 1.5 2.5 3.4 5.5 16 35–40 3.4 1.7 3.3 3.9 6.4 16 40–45 3.4 2.0 4.2 4.2 7.1 14 45–50 3.4 2.2 4.7 4.0 7.3 12 50–55 3.4 2.3 4.6 3.5 7.1 9.4 55–60 3.4 2.5 4.2 2.4 6.4 7.6 60–64 3.5 2.8 3.7 1.1 5.9 6.7 64–68 3.0 3.0 2.8 0.71 5.1 5.6 68–72 2.6 2.9 2.0 0.87 4.5 4.7 72–76 2.4 2.4 1.4 0.96 3.8 4.0 76–81 2.2 1.7 0.77 1.0 3.1 3.4 81–86 2.0 0.97 0.30 1.0 2.4 2.8 86–91 1.7 0.53 0.075 1.3 2.2 2.3 91–96 1.6 0.55 0.060 1.9 2.5 1.9 96–101 1.5 0.88 0.20 2.1 2.7 1.6 101–106 1.4 1.6 0.47 2.1 3.0 1.4 106–110 1.4 2.8 0.81 2.1 3.8 1.2 110–115 1.4 3.6 1.1 2.2 4.6 1.1 115–120 1.4 3.6 1.4 2.4 4.7 1.1 120–126 1.4 3.1 1.7 2.9 4.8 1.1 126–133 1.4 2.9 2.1 4.6 6.0 1.1 133–141 1.4 3.0 2.7 6.3 7.6 1.2 141–150 1.5 3.2 3.1 7.0 8.4 1.2 150–160 1.5 3.4 3.5 7.0 8.7 1.1 160–171 1.5 3.4 4.2 7.1 9.1 1.0 171–185 1.6 3.2 4.9 7.1 9.4 0.88 185–200 1.5 2.5 5.8 7.1 9.6 0.84 200–220 1.5 1.6 6.3 7.1 9.8 0.89 220–243 1.6 0.96 6.9 7.2 10 0.73 243–273 1.6 0.81 7.5 6.9 10 0.67 273–320 1.6 0.84 7.9 6.4 10 0.64 320–380 1.6 0.85 8.1 6.3 10 0.56 380–440 1.6 0.88 9.0 6.6 11 0.48 440–510 1.6 0.92 10 6.7 13 0.41 510–600 1.6 0.93 11 8.0 14 0.37 600–700 1.6 0.95 13 11 18 0.32 700–830 1.6 1.0 19 14 24 0.28 830–1000 1.6 0.96 43 14 45 0.25 1000–1500 1.6 0.82 81 13 82 0.36 1500–3000 1.5 0.76 100 12 100 0.66
Table 2. Summary of the systematic uncertainties (%) for the dσ/dm (pb/GeV) measurement in the dielectron channel. The column labelled “Total” corresponds to the quadratic sum of all the experimental sources, except for that Acceptance+PDF.
JHEP12(2019)059
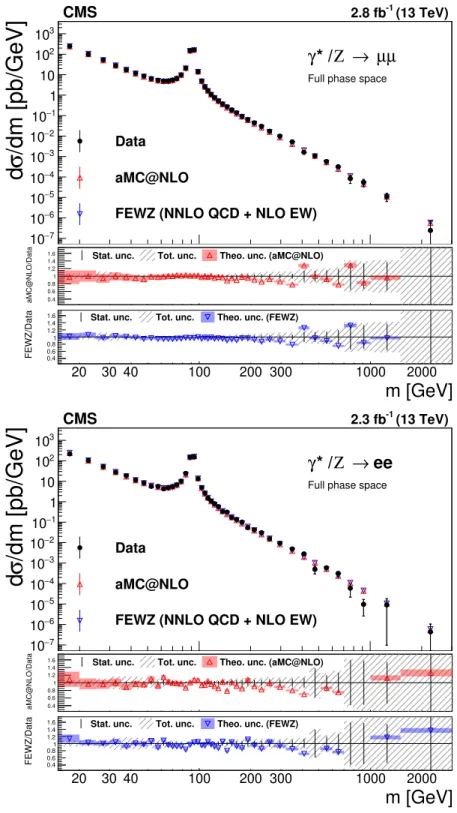
described in the previous sections. The detector fiducial volume is defined by the pT and η requirements for the muons and electrons after FSR. The results are presented in figure4as a function of the dimuon and dielectron invariant mass covering the range 15 to 3000 GeV. They are compared with the NNLO theoretical predictions from fewz with NLO EW correction, as well as those from MadGraph5 amc@nlo. Both predictions are calculated using the NNPDF3.0 PDF set. The ratios of the NLO and NNLO predictions to data are shown in the lower panels. The measurements are in good agreement, within uncertainties, with both theoretical predictions. Tables 3 and4 show the summary of the results for the dimuon and dielectron channels, respectively.
In addition to the fully corrected total cross section, the fiducial cross section is also measured within the detector acceptance and without the FSR correction. Because of the fact that the acceptance correction, as shown in figure 2, is very large below the Z bo-son peak, the shape of the fiducial distribution is different in this mass region. Figure 5
shows the results in the dimuon and dielectron channels compared to the prediction from MadGraph5 amc@nlo. Tables5and6present the summary of the fiducial cross section measurements (with no FSR correction applied) for the dimuon and dielectron channels, re-spectively. The results are in good agreement, within the uncertainties, with the theoretical prediction.
The differential cross section measurements obtained in the dimuon and dielectron channels in the full phase space are in good agreement with each other and therefore the results in the two channels are combined using the method described in ref. [44]. The combined differential cross section in each bin is determined by the average of the two measurements weighted by the inverse of the squared total uncertainty. The uncertainty of the combined result is extracted from the diagonal elements of the covariance matrix of the combination, which is constructed using the covariance matrices of the measurements in the dimuon and dielectron channels. The uncertainties are considered to be uncorre-lated between the two channels, with the exception of the integrated luminosity and the acceptance uncertainties. Systematic uncertainties are treated as additional uncorrelated uncertainties in the individual measurements, with the exception of the uncertainty from the efficiency scale factor. Statistical uncertainties are propagated to the covariance ma-trices of the measurements in the dimuon and dielectron channels before the combination. The differential DY cross section for the full phase space, after the combination of the dimuon and dielectron channels, is presented in figure6. The data point abscissas are com-puted according to eq. (6) in ref. [45]. Table7shows the summary of the combined results. Figure7shows a magnified ratio plot for the comparison of the theoretical prediction with experimental result in two mass ranges, 15 < m < 200 GeV and 200 < m < 3000 GeV. In the bottom plot of the figure, an additional theoretical prediction, containing the photon-induced contribution calculated using fewz with the LUXqed PDF set, is included. There is a sizable effect from this contribution in the high-mass region. The level of agree-ment between data and theory is very good as indicated by the p-value of 0.49 except for 830 < m < 1000 GeV, determined from the χ2 comparison between the combined result and NNLO prediction.
JHEP12(2019)059
/dm [pb/GeV]
σd
7 − 10 6 − 10 5 − 10 4 − 10 3 − 10 2 − 10 1 − 10 1 10 2 10 3 10 Data aMC@NLOFEWZ (NNLO QCD + NLO EW)
CMS 2.8 fb-1 (13 TeV) µ µ → Ζ * / γ
Full phase space
2 3 aMC@NLO/Data 0.4 0.6 0.8 1 1.2 1.4
1.6 Stat. unc. Tot. unc. Theo. unc. (aMC@NLO)
m [GeV]
20 30 40 100 200 300 1000 2000 FEWZ/Data 0.4 0.6 0.81 1.2 1.41.6 Stat. unc. Tot. unc. Theo. unc. (FEWZ)
/dm [pb/GeV]
σd
7 − 10 6 − 10 5 − 10 4 − 10 3 − 10 2 − 10 1 − 10 1 10 2 10 3 10 Data aMC@NLOFEWZ (NNLO QCD + NLO EW)
CMS 2.3 fb-1 (13 TeV) ee → Ζ * / γ
Full phase space
2 3 aMC@NLO/Data 0.4 0.6 0.8 1 1.2 1.4
1.6 Stat. unc. Tot. unc. Theo. unc. (aMC@NLO)
m [GeV]
20 30 40 100 200 300 1000 2000 FEWZ/Data 0.4 0.6 0.81 1.2 1.41.6 Stat. unc. Tot. unc. Theo. unc. (FEWZ)
Figure 4. The differential cross section as a function of the dimuon (upper) and dielectron (lower) invariant mass, measured in the full phase space, with FSR correction applied. The spectra are compared with the NNLO theoretical prediction of fewz (blue) and the NLO prediction of Mad-Graph5 amc@nlo (red). The NNPDF3.0 PDF set is used in both cases. In the middle and lower panels, the coloured bands denote the theoretical uncertainty and the hatched bands denote the total uncertainty, which is the combination of statistical, systematic, and integrated luminosity components.
JHEP12(2019)059
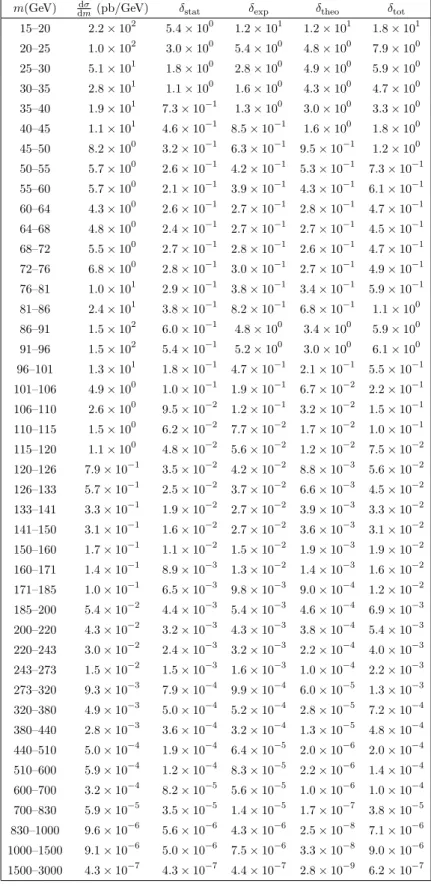
m(GeV) dσdm (pb/GeV) δstat δexp δtheo δtot
15–20 2.5 × 10² 2.4 × 100 1.1 × 101 1.4 × 101 1.8 × 101 20–25 9.9 × 101 1.1 × 100 4.5 × 100 4.7 × 100 6.6 × 100 25–30 5.3 × 101 6.4 × 10⁻¹ 2.4 × 100 6.1 × 100 6.6 × 100 30–35 2.8 × 101 3.0 × 10⁻¹ 1.4 × 100 2.6 × 100 3.0 × 100 35–40 1.7 × 101 1.5 × 10⁻¹ 8.7 × 10⁻¹ 9.7 × 10⁻¹ 1.3 × 100 40–45 1.2 × 101 9.7 × 10⁻² 5.7 × 10⁻¹ 2.3 × 10⁻¹ 6.2 × 10⁻¹ 45–50 8.5 × 100 6.7 × 10⁻² 3.7 × 10⁻¹ 1.3 × 10⁻¹ 4.0 × 10⁻¹ 50–55 6.3 × 100 5.5 × 10⁻² 2.4 × 10⁻¹ 1.1 × 10⁻¹ 2.7 × 10⁻¹ 55–60 5.3 × 100 5.0 × 10⁻² 2.0 × 10⁻¹ 9.8 × 10⁻² 2.3 × 10⁻¹ 60–64 4.9 × 100 5.6 × 10⁻² 1.7 × 10⁻¹ 9.7 × 10⁻² 2.1 × 10⁻¹ 64–68 4.9 × 100 5.8 × 10⁻² 1.6 × 10⁻¹ 1.0 × 10⁻¹ 2.0 × 10⁻¹ 68–72 5.4 × 100 5.9 × 10⁻² 1.8 × 10⁻¹ 1.1 × 10⁻¹ 2.2 × 10⁻¹ 72–76 6.5 × 100 6.8 × 10⁻² 2.0 × 10⁻¹ 1.4 × 10⁻¹ 2.5 × 10⁻¹ 76–81 9.7 × 100 7.0 × 10⁻² 3.0 × 10⁻¹ 2.0 × 10⁻¹ 3.7 × 10⁻¹ 81–86 2.1 × 101 1.1 × 10⁻¹ 6.5 × 10⁻¹ 4.2 × 10⁻¹ 7.9 × 10⁻¹ 86–91 1.5 × 10² 2.7 × 10⁻¹ 5.0 × 100 2.9 × 100 5.8 × 100 91–96 1.6 × 10² 2.7 × 10⁻¹ 5.9 × 100 3.1 × 100 6.6 × 100 96–101 1.4 × 101 8.5 × 10⁻² 5.3 × 10⁻¹ 2.4 × 10⁻¹ 5.9 × 10⁻¹ 101–106 4.9 × 100 4.8 × 10⁻² 2.0 × 10⁻¹ 7.6 × 10⁻² 2.2 × 10⁻¹ 106–110 2.5 × 100 4.3 × 10⁻² 1.1 × 10⁻¹ 3.6 × 10⁻² 1.2 × 10⁻¹ 110–115 1.7 × 100 2.8 × 10⁻² 7.1 × 10⁻² 2.2 × 10⁻² 8.0 × 10⁻² 115–120 1.1 × 100 2.3 × 10⁻² 4.7 × 10⁻² 1.3 × 10⁻² 5.4 × 10⁻² 120–126 7.6 × 10⁻¹ 1.8 × 10⁻² 3.5 × 10⁻² 8.6 × 10⁻³ 4.1 × 10⁻² 126–133 5.2 × 10⁻¹ 1.3 × 10⁻² 2.6 × 10⁻² 5.5 × 10⁻³ 2.9 × 10⁻² 133–141 3.7 × 10⁻¹ 1.0 × 10⁻² 1.9 × 10⁻² 3.8 × 10⁻³ 2.2 × 10⁻² 141–150 2.7 × 10⁻¹ 8.0 × 10⁻³ 1.6 × 10⁻² 2.7 × 10⁻³ 1.8 × 10⁻² 150–160 1.9 × 10⁻¹ 6.1 × 10⁻³ 1.1 × 10⁻² 1.8 × 10⁻³ 1.3 × 10⁻² 160–171 1.4 × 10⁻¹ 5.3 × 10⁻³ 9.1 × 10⁻³ 1.6 × 10⁻³ 1.1 × 10⁻² 171–185 9.1 × 10⁻² 3.6 × 10⁻³ 6.4 × 10⁻³ 8.0 × 10⁻⁴ 7.3 × 10⁻³ 185–200 6.3 × 10⁻² 2.9 × 10⁻³ 4.7 × 10⁻³ 6.5 × 10⁻⁴ 5.6 × 10⁻³ 200–220 4.4 × 10⁻² 1.9 × 10⁻³ 3.6 × 10⁻³ 5.1 × 10⁻⁴ 4.1 × 10⁻³ 220–243 3.0 × 10⁻² 1.5 × 10⁻³ 2.7 × 10⁻³ 2.7 × 10⁻⁴ 3.1 × 10⁻³ 243–273 1.7 × 10⁻² 9.8 × 10⁻⁴ 1.7 × 10⁻³ 1.3 × 10⁻⁴ 2.0 × 10⁻³ 273–320 9.9 × 10⁻³ 5.4 × 10⁻⁴ 1.1 × 10⁻³ 7.2 × 10⁻⁵ 1.2 × 10⁻³ 320–380 5.3 × 10⁻³ 3.4 × 10⁻⁴ 6.0 × 10⁻⁴ 3.4 × 10⁻⁵ 6.9 × 10⁻⁴ 380–440 1.6 × 10⁻³ 2.3 × 10⁻⁴ 1.9 × 10⁻⁴ 1.2 × 10⁻⁵ 3.0 × 10⁻⁴ 440–510 1.1 × 10⁻³ 1.5 × 10⁻⁴ 1.3 × 10⁻⁴ 6.8 × 10⁻⁶ 2.0 × 10⁻⁴ 510–600 5.7 × 10⁻⁴ 8.9 × 10⁻⁵ 7.1 × 10⁻⁵ 2.6 × 10⁻⁶ 1.1 × 10⁻⁴ 600–700 3.2 × 10⁻⁴ 6.2 × 10⁻⁵ 4.0 × 10⁻⁵ 9.6 × 10⁻⁷ 7.4 × 10⁻⁵ 700–830 8.3 × 10⁻⁵ 3.0 × 10⁻⁵ 1.8 × 10⁻⁵ 3.8 × 10⁻⁷ 3.5 × 10⁻⁵ 830–1000 5.5 × 10⁻⁵ 1.8 × 10⁻⁵ 1.1 × 10⁻⁵ 4.1 × 10⁻⁷ 2.1 × 10⁻⁵ 1000–1500 1.1 × 10⁻⁵ 4.1 × 10⁻⁶ 2.3 × 10⁻⁶ 1.3 × 10⁻⁷ 4.7 × 10⁻⁶ 1500–3000 2.4 × 10⁻⁷ 2.4 × 10⁻⁷ 3.8 × 10⁻⁷ 4.2 × 10⁻⁹ 4.5 × 10⁻⁷
Table 3. Summary of the measured values of dσ/dm (pb/GeV) in the dimuon channel with the statistical (δstat), experimental (δexp) and theoretical (δtheo) uncertainties, respectively. Here, δtot
JHEP12(2019)059
m(GeV) dσdm (pb/GeV) δstat δexp δtheo δtot
15–20 2.2 × 10² 5.4 × 100 1.2 × 101 1.2 × 101 1.8 × 101 20–25 1.0 × 10² 3.0 × 100 5.4 × 100 4.8 × 100 7.9 × 100 25–30 5.1 × 101 1.8 × 100 2.8 × 100 4.9 × 100 5.9 × 100 30–35 2.8 × 101 1.1 × 100 1.6 × 100 4.3 × 100 4.7 × 100 35–40 1.9 × 101 7.3 × 10⁻¹ 1.3 × 100 3.0 × 100 3.3 × 100 40–45 1.1 × 101 4.6 × 10⁻¹ 8.5 × 10⁻¹ 1.6 × 100 1.8 × 100 45–50 8.2 × 100 3.2 × 10⁻¹ 6.3 × 10⁻¹ 9.5 × 10⁻¹ 1.2 × 100 50–55 5.7 × 100 2.6 × 10⁻¹ 4.2 × 10⁻¹ 5.3 × 10⁻¹ 7.3 × 10⁻¹ 55–60 5.7 × 100 2.1 × 10⁻¹ 3.9 × 10⁻¹ 4.3 × 10⁻¹ 6.1 × 10⁻¹ 60–64 4.3 × 100 2.6 × 10⁻¹ 2.7 × 10⁻¹ 2.8 × 10⁻¹ 4.7 × 10⁻¹ 64–68 4.8 × 100 2.4 × 10⁻¹ 2.7 × 10⁻¹ 2.7 × 10⁻¹ 4.5 × 10⁻¹ 68–72 5.5 × 100 2.7 × 10⁻¹ 2.8 × 10⁻¹ 2.6 × 10⁻¹ 4.7 × 10⁻¹ 72–76 6.8 × 100 2.8 × 10⁻¹ 3.0 × 10⁻¹ 2.7 × 10⁻¹ 4.9 × 10⁻¹ 76–81 1.0 × 101 2.9 × 10⁻¹ 3.8 × 10⁻¹ 3.4 × 10⁻¹ 5.9 × 10⁻¹ 81–86 2.4 × 101 3.8 × 10⁻¹ 8.2 × 10⁻¹ 6.8 × 10⁻¹ 1.1 × 100 86–91 1.5 × 10² 6.0 × 10⁻¹ 4.8 × 100 3.4 × 100 5.9 × 100 91–96 1.5 × 10² 5.4 × 10⁻¹ 5.2 × 100 3.0 × 100 6.1 × 100 96–101 1.3 × 101 1.8 × 10⁻¹ 4.7 × 10⁻¹ 2.1 × 10⁻¹ 5.5 × 10⁻¹ 101–106 4.9 × 100 1.0 × 10⁻¹ 1.9 × 10⁻¹ 6.7 × 10⁻² 2.2 × 10⁻¹ 106–110 2.6 × 100 9.5 × 10⁻² 1.2 × 10⁻¹ 3.2 × 10⁻² 1.5 × 10⁻¹ 110–115 1.5 × 100 6.2 × 10⁻² 7.7 × 10⁻² 1.7 × 10⁻² 1.0 × 10⁻¹ 115–120 1.1 × 100 4.8 × 10⁻² 5.6 × 10⁻² 1.2 × 10⁻² 7.5 × 10⁻² 120–126 7.9 × 10⁻¹ 3.5 × 10⁻² 4.2 × 10⁻² 8.8 × 10⁻³ 5.6 × 10⁻² 126–133 5.7 × 10⁻¹ 2.5 × 10⁻² 3.7 × 10⁻² 6.6 × 10⁻³ 4.5 × 10⁻² 133–141 3.3 × 10⁻¹ 1.9 × 10⁻² 2.7 × 10⁻² 3.9 × 10⁻³ 3.3 × 10⁻² 141–150 3.1 × 10⁻¹ 1.6 × 10⁻² 2.7 × 10⁻² 3.6 × 10⁻³ 3.1 × 10⁻² 150–160 1.7 × 10⁻¹ 1.1 × 10⁻² 1.5 × 10⁻² 1.9 × 10⁻³ 1.9 × 10⁻² 160–171 1.4 × 10⁻¹ 8.9 × 10⁻³ 1.3 × 10⁻² 1.4 × 10⁻³ 1.6 × 10⁻² 171–185 1.0 × 10⁻¹ 6.5 × 10⁻³ 9.8 × 10⁻³ 9.0 × 10⁻⁴ 1.2 × 10⁻² 185–200 5.4 × 10⁻² 4.4 × 10⁻³ 5.4 × 10⁻³ 4.6 × 10⁻⁴ 6.9 × 10⁻³ 200–220 4.3 × 10⁻² 3.2 × 10⁻³ 4.3 × 10⁻³ 3.8 × 10⁻⁴ 5.4 × 10⁻³ 220–243 3.0 × 10⁻² 2.4 × 10⁻³ 3.2 × 10⁻³ 2.2 × 10⁻⁴ 4.0 × 10⁻³ 243–273 1.5 × 10⁻² 1.5 × 10⁻³ 1.6 × 10⁻³ 1.0 × 10⁻⁴ 2.2 × 10⁻³ 273–320 9.3 × 10⁻³ 7.9 × 10⁻⁴ 9.9 × 10⁻⁴ 6.0 × 10⁻⁵ 1.3 × 10⁻³ 320–380 4.9 × 10⁻³ 5.0 × 10⁻⁴ 5.2 × 10⁻⁴ 2.8 × 10⁻⁵ 7.2 × 10⁻⁴ 380–440 2.8 × 10⁻³ 3.6 × 10⁻⁴ 3.2 × 10⁻⁴ 1.3 × 10⁻⁵ 4.8 × 10⁻⁴ 440–510 5.0 × 10⁻⁴ 1.9 × 10⁻⁴ 6.4 × 10⁻⁵ 2.0 × 10⁻⁶ 2.0 × 10⁻⁴ 510–600 5.9 × 10⁻⁴ 1.2 × 10⁻⁴ 8.3 × 10⁻⁵ 2.2 × 10⁻⁶ 1.4 × 10⁻⁴ 600–700 3.2 × 10⁻⁴ 8.2 × 10⁻⁵ 5.6 × 10⁻⁵ 1.0 × 10⁻⁶ 1.0 × 10⁻⁴ 700–830 5.9 × 10⁻⁵ 3.5 × 10⁻⁵ 1.4 × 10⁻⁵ 1.7 × 10⁻⁷ 3.8 × 10⁻⁵ 830–1000 9.6 × 10⁻⁶ 5.6 × 10⁻⁶ 4.3 × 10⁻⁶ 2.5 × 10⁻⁸ 7.1 × 10⁻⁶ 1000–1500 9.1 × 10⁻⁶ 5.0 × 10⁻⁶ 7.5 × 10⁻⁶ 3.3 × 10⁻⁸ 9.0 × 10⁻⁶ 1500–3000 4.3 × 10⁻⁷ 4.3 × 10⁻⁷ 4.4 × 10⁻⁷ 2.8 × 10⁻⁹ 6.2 × 10⁻⁷
Table 4. Summary of the measured values of dσ/dm (pb/GeV) in the dielectron channel with the statistical (δstat), experimental (δexp) and theoretical (δtheo) uncertainties, respectively. Here, δtot
JHEP12(2019)059
/dm [pb/GeV]
σd
7 − 10 6 − 10 5 − 10 4 − 10 3 − 10 2 − 10 1 − 10 1 10 2 10 3 10Data
aMC@NLO
CMS 2.8 fb-1 (13 TeV)µ
µ
→
Ζ
* /
γ
) > 10 GeV µ ( sub T ) > 22 GeV, p µ ( lead T p )| < 2.4 µ ( η |m [GeV]
20 30 100 200 1000 2000 aMC@NLO/Data 0.4 0.6 0.8 1 1.2 1.41.6 Stat. unc. Tot. unc. Theo. unc. (aMC@NLO)
/dm [pb/GeV]
σd
7 − 10 6 − 10 5 − 10 4 − 10 3 − 10 2 − 10 1 − 10 1 10 2 10 3 10Data
aMC@NLO
CMS 2.3 fb-1 (13 TeV)ee
→
Ζ
* /
γ
(e) > 10 GeV sub T (e) > 30 GeV, p lead T p (1.44, 1.57) ∉ (e)| η (e)| < 2.5, | η |m [GeV]
20 30 100 200 1000 2000 aMC@NLO/Data 0.4 0.6 0.8 1 1.2 1.41.6 Stat. unc. Tot. unc. Theo. unc. (aMC@NLO)
Figure 5. Comparison between the measured fiducial cross section (with no FSR correction ap-plied) and the NLO theoretical prediction of MadGraph5 amc@nlo with NNPDF 3.0 in the dimuon (upper) and dielectron (lower) channels. In the bottom panels, the red band represents the theoretical uncertainty and the hatched band represents the total uncertainty, which is the combination of the statistical, systematic, and integrated luminosity components.
JHEP12(2019)059
m(GeV) dσdm(pb/GeV) δstat δexp δtot
15–20 1.2 × 100 1.1 × 10⁻² 5.5 × 10⁻² 5.6 × 10⁻² 20–25 9.0 × 10⁻¹ 9.8 × 10⁻³ 4.0 × 10⁻² 4.2 × 10⁻² 25–30 9.2 × 10⁻¹ 1.1 × 10⁻² 4.2 × 10⁻² 4.3 × 10⁻² 30–35 1.3 × 100 1.3 × 10⁻² 6.1 × 10⁻² 6.3 × 10⁻² 35–40 1.7 × 100 1.5 × 10⁻² 8.6 × 10⁻² 8.7 × 10⁻² 40–45 2.1 × 100 1.7 × 10⁻² 1.0 × 10⁻¹ 1.0 × 10⁻¹ 45–50 2.3 × 100 1.7 × 10⁻² 1.0 × 10⁻¹ 1.0 × 10⁻¹ 50–55 2.1 × 100 1.7 × 10⁻² 8.1 × 10⁻² 8.2 × 10⁻² 55–60 2.1 × 100 1.7 × 10⁻² 7.5 × 10⁻² 7.7 × 10⁻² 60–64 2.2 × 100 2.0 × 10⁻² 7.2 × 10⁻² 7.5 × 10⁻² 64–68 2.4 × 100 2.2 × 10⁻² 7.2 × 10⁻² 7.6 × 10⁻² 68–72 2.8 × 100 2.3 × 10⁻² 8.1 × 10⁻² 8.4 × 10⁻² 72–76 3.5 × 100 2.7 × 10⁻² 9.6 × 10⁻² 9.9 × 10⁻² 76–81 5.4 × 100 2.8 × 10⁻² 1.4 × 10⁻¹ 1.5 × 10⁻¹ 81–86 1.1 × 101 4.5 × 10⁻² 3.1 × 10⁻¹ 3.1 × 10⁻¹ 86–91 6.8 × 101 1.1 × 10⁻¹ 2.0 × 100 2.0 × 100 91–96 6.9 × 101 1.1 × 10⁻¹ 2.2 × 100 2.2 × 100 96–101 6.1 × 100 3.6 × 10⁻² 2.1 × 10⁻¹ 2.1 × 10⁻¹ 101–106 2.2 × 100 2.0 × 10⁻² 7.8 × 10⁻² 8.1 × 10⁻² 106–110 1.2 × 100 1.9 × 10⁻² 4.3 × 10⁻² 4.7 × 10⁻² 110–115 7.6 × 10⁻¹ 1.2 × 10⁻² 3.0 × 10⁻² 3.2 × 10⁻² 115–120 5.0 × 10⁻¹ 1.0 × 10⁻² 2.1 × 10⁻² 2.3 × 10⁻² 120–126 3.6 × 10⁻¹ 7.9 × 10⁻³ 1.6 × 10⁻² 1.8 × 10⁻² 126–133 2.5 × 10⁻¹ 5.8 × 10⁻³ 1.2 × 10⁻² 1.3 × 10⁻² 133–141 1.8 × 10⁻¹ 4.5 × 10⁻³ 8.9 × 10⁻³ 1.0 × 10⁻² 141–150 1.3 × 10⁻¹ 3.7 × 10⁻³ 7.2 × 10⁻³ 8.1 × 10⁻³ 150–160 9.4 × 10⁻² 2.9 × 10⁻³ 5.3 × 10⁻³ 6.1 × 10⁻³ 160–171 6.9 × 10⁻² 2.5 × 10⁻³ 4.2 × 10⁻³ 4.9 × 10⁻³ 171–185 4.7 × 10⁻² 1.7 × 10⁻³ 3.1 × 10⁻³ 3.6 × 10⁻³ 185–200 3.3 × 10⁻² 1.4 × 10⁻³ 2.4 × 10⁻³ 2.8 × 10⁻³ 200–220 2.4 × 10⁻² 9.7 × 10⁻⁴ 1.9 × 10⁻³ 2.1 × 10⁻³ 220–243 1.6 × 10⁻² 7.7 × 10⁻⁴ 1.4 × 10⁻³ 1.6 × 10⁻³ 243–273 9.8 × 10⁻³ 5.3 × 10⁻⁴ 9.4 × 10⁻⁴ 1.1 × 10⁻³ 273–320 5.8 × 10⁻³ 3.1 × 10⁻⁴ 6.0 × 10⁻⁴ 6.7 × 10⁻⁴ 320–380 3.2 × 10⁻³ 2.0 × 10⁻⁴ 3.4 × 10⁻⁴ 3.9 × 10⁻⁴ 380–440 1.0 × 10⁻³ 1.4 × 10⁻⁴ 1.2 × 10⁻⁴ 1.8 × 10⁻⁴ 440–510 7.2 × 10⁻⁴ 9.6 × 10⁻⁵ 8.5 × 10⁻⁵ 1.3 × 10⁻⁴ 510–600 4.0 × 10⁻⁴ 6.0 × 10⁻⁵ 4.8 × 10⁻⁵ 7.6 × 10⁻⁵ 600–700 2.3 × 10⁻⁴ 4.3 × 10⁻⁵ 2.7 × 10⁻⁵ 5.0 × 10⁻⁵ 700–830 6.4 × 10⁻⁵ 2.1 × 10⁻⁵ 1.4 × 10⁻⁵ 2.5 × 10⁻⁵ 830–1000 4.2 × 10⁻⁵ 1.4 × 10⁻⁵ 8.4 × 10⁻⁶ 1.6 × 10⁻⁵ 1000–1500 8.9 × 10⁻⁶ 3.3 × 10⁻⁶ 1.8 × 10⁻⁶ 3.8 × 10⁻⁶ 1500–3000 2.1 × 10⁻⁷ 2.1 × 10⁻⁷ 3.2 × 10⁻⁷ 3.8 × 10⁻⁷
Table 5. Summary of the measured values of fiducial dσ/dm (pb/GeV) (with no FSR correction applied) in the dimuon channel with the statistical (δstat) and experimental (δexp) uncertainties shown separately. Here, δtot is the quadratic sum of the two components.
JHEP12(2019)059
m(GeV) dσdm(pb/GeV) δstat δexp δtot
15–20 5.5 × 10⁻¹ 1.3 × 10⁻² 2.3 × 10⁻² 2.6 × 10⁻² 20–25 4.4 × 10⁻¹ 1.2 × 10⁻² 1.9 × 10⁻² 2.3 × 10⁻² 25–30 3.9 × 10⁻¹ 1.2 × 10⁻² 1.7 × 10⁻² 2.1 × 10⁻² 30–35 3.6 × 10⁻¹ 1.3 × 10⁻² 1.7 × 10⁻² 2.2 × 10⁻² 35–40 5.1 × 10⁻¹ 1.8 × 10⁻² 2.9 × 10⁻² 3.4 × 10⁻² 40–45 6.7 × 10⁻¹ 2.3 × 10⁻² 4.1 × 10⁻² 4.7 × 10⁻² 45–50 1.0 × 100 3.1 × 10⁻² 6.7 × 10⁻² 7.4 × 10⁻² 50–55 1.2 × 100 3.8 × 10⁻² 8.0 × 10⁻² 8.9 × 10⁻² 55–60 1.8 × 100 4.3 × 10⁻² 1.1 × 10⁻¹ 1.2 × 10⁻¹ 60–64 2.0 × 100 6.0 × 10⁻² 1.2 × 10⁻¹ 1.4 × 10⁻¹ 64–68 2.6 × 100 6.7 × 10⁻² 1.4 × 10⁻¹ 1.6 × 10⁻¹ 68–72 3.2 × 100 7.6 × 10⁻² 1.6 × 10⁻¹ 1.8 × 10⁻¹ 72–76 4.3 × 100 8.3 × 10⁻² 1.9 × 10⁻¹ 2.0 × 10⁻¹ 76–81 6.5 × 100 8.7 × 10⁻² 2.4 × 10⁻¹ 2.5 × 10⁻¹ 81–86 1.4 × 101 1.2 × 10⁻¹ 4.3 × 10⁻¹ 4.5 × 10⁻¹ 86–91 5.9 × 101 1.9 × 10⁻¹ 1.7 × 100 1.7 × 100 91–96 5.0 × 101 1.7 × 10⁻¹ 1.4 × 100 1.4 × 100 96–101 4.7 × 100 5.9 × 10⁻² 1.4 × 10⁻¹ 1.5 × 10⁻¹ 101–106 1.8 × 100 3.4 × 10⁻² 5.8 × 10⁻² 6.7 × 10⁻² 106–110 1.0 × 100 3.1 × 10⁻² 4.0 × 10⁻² 5.1 × 10⁻² 110–115 6.1 × 10⁻¹ 2.1 × 10⁻² 2.8 × 10⁻² 3.5 × 10⁻² 115–120 4.4 × 10⁻¹ 1.7 × 10⁻² 2.1 × 10⁻² 2.7 × 10⁻² 120–126 3.3 × 10⁻¹ 1.3 × 10⁻² 1.5 × 10⁻² 1.9 × 10⁻² 126–133 2.4 × 10⁻¹ 9.3 × 10⁻³ 1.1 × 10⁻² 1.4 × 10⁻² 133–141 1.4 × 10⁻¹ 7.0 × 10⁻³ 7.0 × 10⁻³ 9.9 × 10⁻³ 141–150 1.3 × 10⁻¹ 5.9 × 10⁻³ 7.0 × 10⁻³ 9.2 × 10⁻³ 150–160 7.9 × 10⁻² 4.4 × 10⁻³ 4.4 × 10⁻³ 6.3 × 10⁻³ 160–171 6.2 × 10⁻² 3.5 × 10⁻³ 3.7 × 10⁻³ 5.1 × 10⁻³ 171–185 4.6 × 10⁻² 2.6 × 10⁻³ 3.0 × 10⁻³ 3.9 × 10⁻³ 185–200 2.7 × 10⁻² 1.9 × 10⁻³ 1.9 × 10⁻³ 2.6 × 10⁻³ 200–220 2.1 × 10⁻² 1.4 × 10⁻³ 1.5 × 10⁻³ 2.1 × 10⁻³ 220–243 1.5 × 10⁻² 1.1 × 10⁻³ 1.1 × 10⁻³ 1.6 × 10⁻³ 243–273 7.9 × 10⁻³ 6.7 × 10⁻⁴ 6.4 × 10⁻⁴ 9.3 × 10⁻⁴ 273–320 5.0 × 10⁻³ 4.0 × 10⁻⁴ 4.2 × 10⁻⁴ 5.8 × 10⁻⁴ 320–380 2.8 × 10⁻³ 2.6 × 10⁻⁴ 2.4 × 10⁻⁴ 3.5 × 10⁻⁴ 380–440 1.6 × 10⁻³ 1.9 × 10⁻⁴ 1.5 × 10⁻⁴ 2.4 × 10⁻⁴ 440–510 3.4 × 10⁻⁴ 1.1 × 10⁻⁴ 3.6 × 10⁻⁵ 1.1 × 10⁻⁴ 510–600 3.7 × 10⁻⁴ 6.6 × 10⁻⁵ 4.3 × 10⁻⁵ 7.9 × 10⁻⁵ 600–700 1.9 × 10⁻⁴ 4.9 × 10⁻⁵ 2.7 × 10⁻⁵ 5.5 × 10⁻⁵ 700–830 3.9 × 10⁻⁵ 2.2 × 10⁻⁵ 7.6 × 10⁻⁶ 2.3 × 10⁻⁵ 830–1000 8.0 × 10⁻⁶ 4.6 × 10⁻⁶ 3.4 × 10⁻⁶ 5.7 × 10⁻⁶ 1000–1500 6.6 × 10⁻⁶ 3.5 × 10⁻⁶ 5.4 × 10⁻⁶ 6.4 × 10⁻⁶ 1500–3000 3.2 × 10⁻⁷ 3.2 × 10⁻⁷ 3.2 × 10⁻⁷ 4.6 × 10⁻⁷
Table 6. Summary of the measured values of fiducial dσ/dm (pb/GeV) (with no FSR correction applied) in the dielectron channel with the statistical (δstat) and experimental (δexp) uncertainties shown separately. Here, δtot is the quadratic sum of the two components.
JHEP12(2019)059
m(GeV) dσ dm(pb/GeV) δtot 15–20 2.3 × 10² 1.6 × 101 20–25 1.0 × 10² 6.3 × 100 25–30 5.2 × 101 5.7 × 100 30–35 2.8 × 101 3.0 × 100 35–40 1.8 × 101 1.3 × 100 40–45 1.2 × 101 6.1 × 10⁻¹ 45–50 8.5 × 100 3.9 × 10⁻¹ 50–55 6.2 × 100 2.7 × 10⁻¹ 55–60 5.4 × 100 2.3 × 10⁻¹ 60–64 4.8 × 100 2.0 × 10⁻¹ 64–68 4.9 × 100 2.0 × 10⁻¹ 68–72 5.4 × 100 2.2 × 10⁻¹ 72–76 6.6 × 100 2.6 × 10⁻¹ 76–81 9.8 × 100 3.7 × 10⁻¹ 81–86 2.2 × 101 7.9 × 10⁻¹ 86–91 1.5 × 10² 5.2 × 100 91–96 1.6 × 10² 5.6 × 100 96–101 1.3 × 101 4.8 × 10⁻¹ 101–106 4.9 × 100 1.8 × 10⁻¹ 106–110 2.6 × 100 1.1 × 10⁻¹ 110–115 1.6 × 100 6.8 × 10⁻² 115–120 1.1 × 100 4.7 × 10⁻² 120–126 7.7 × 10⁻¹ 3.5 × 10⁻² 126–133 5.4 × 10⁻¹ 2.6 × 10⁻² 133–141 3.6 × 10⁻¹ 1.9 × 10⁻² 141–150 2.8 × 10⁻¹ 1.6 × 10⁻² 150–160 1.8 × 10⁻¹ 1.1 × 10⁻² 160–171 1.4 × 10⁻¹ 9.1 × 10⁻³ 171–185 9.4 × 10⁻² 6.4 × 10⁻³ 185–200 6.0 × 10⁻² 4.5 × 10⁻³ 200–220 4.4 × 10⁻² 3.3 × 10⁻³ 220–243 3.0 × 10⁻² 2.5 × 10⁻³ 243–273 1.6 × 10⁻² 1.5 × 10⁻³ 273–320 9.6 × 10⁻³ 8.9 × 10⁻⁴ 320–380 5.1 × 10⁻³ 5.0 × 10⁻⁴ 380–440 1.9 × 10⁻³ 2.5 × 10⁻⁴ 440–510 7.9 × 10⁻⁴ 1.4 × 10⁻⁴ 510–600 5.8 × 10⁻⁴ 8.9 × 10⁻⁵ 600–700 3.2 × 10⁻⁴ 6.0 × 10⁻⁵ 700–830 7.2 × 10⁻⁵ 2.6 × 10⁻⁵ 830–1000 1.4 × 10⁻⁵ 6.7 × 10⁻⁶ 1000–1500 1.1 × 10⁻⁵ 4.2 × 10⁻⁶ 1500–3000 3.1 × 10⁻⁷ 3.6 × 10⁻⁷Table 7. Summary of the combined values of dσ/dm (pb/GeV) using the results from both the dimuon and dielectron channels. Here, δtotis the quadratic sum of the statistical, experimental and
JHEP12(2019)059
) [GeV] µ µ m (/dm [pb/GeV]
σd
7 − 10 6 − 10 5 − 10 4 − 10 3 − 10 2 − 10 1 − 10 1 10 2 10 DataFEWZ (NNLO QCD + NLO EW)
CMS 2.3 fb-1 (ee) 2.8 fb-1 (µµ) (13 TeV)
-µ
+µ
,
-e
+e
→
*/Z
γ
Full phase space
m [GeV]
20 30
100
200
1000 2000
Theory/Data
0.5 1
1.5 Stat. unc. Tot. unc. Theo. unc. (FEWZ)
Figure 6. The differential DY cross section measured for the combination of the two channels and as predicted by the NNLO theoretical calculation of fewz with NNPDF 3.0 in the full phase space. The ratio between the data and the theoretical prediction is presented in the bottom panel. The coloured boxes represent the theoretical uncertainties.
9 Summary
This paper presents measurements of the total and fiducial Drell-Yan differential cross sec-tions dσ/dm in the dimuon and the dielectron channels as well as their combination, in the dilepton invariant mass range 15 < m < 3000 GeV, using data collected by the CMS experiment, in proton-proton collisions at a centre-of-mass energy of 13 TeV, corresponding to an integrated luminosity of up to 2.8 fb−1. The data are corrected for detector reso-lution effects, the differences in the efficiency between data and Monte Carlo simulation, and the acceptance. Additionally the final-state photon radiation effects, which are most pronounced below the Z boson peak, are included. The results are in good agreement with the theoretical predictions of the standard model.
Acknowledgments
We congratulate our colleagues in the CERN accelerator departments for the excellent per-formance of the LHC and thank the technical and administrative staffs at CERN and at
JHEP12(2019)059
m [GeV]
20 30 40 50 60 100 200Theory/Data
0.7 0.8 0.9 1 1.1 1.2 1.3 1.4Stat. unc. Tot. unc.
Theory(FEWZ, w/o PI)/Data
CMS 2.3 fb-1 (ee) 2.8 fb-1 (µµ) (13 TeV) -µ + µ , -e + e → */Z γ
Full phase space
m < 200 GeV
m [GeV]
300 400 1000 2000 3000Theory/Data
0 0.5 1 1.5 2 2.5 3 3.5 4Stat. unc. Tot. unc.
Theory(FEWZ, w/o PI)/Data
Theory(FEWZ, w/ PI)/Data CMS 2.3 fb-1 (ee) 2.8 fb-1 (µµ) (13 TeV) -µ + µ , -e + e → */Z γ
Full phase space
m > 200 GeV
Figure 7. Magnified view of the ratio of the NNLO theoretical prediction of fewz with NNPDF 3.0 to data for the combined differential cross sections in two different mass ranges: m < 200 GeV (top) and m > 200 GeV (bottom). The blue bands represent the theoretical uncertainty on the ratio. The bottom plot also shows the ratio with the photon-induced contribution (red dashed lines), which has a sizable effect in the high-mass region.
JHEP12(2019)059
other CMS institutes for their contributions to the success of the CMS effort. In addition, we gratefully acknowledge the computing centres and personnel of the Worldwide LHC Computing Grid for delivering so effectively the computing infrastructure essential to our analyses. Finally, we acknowledge the enduring support for the construction and operation of the LHC and the CMS detector provided by the following funding agencies: BMBWF and FWF (Austria); FNRS and FWO (Belgium); CNPq, CAPES, FAPERJ, FAPERGS, and FAPESP (Brazil); MES (Bulgaria); CERN; CAS, MoST, and NSFC (China); COL-CIENCIAS (Colombia); MSES and CSF (Croatia); RPF (Cyprus); SENESCYT (Ecuador); MoER, ERC IUT, and ERDF (Estonia); Academy of Finland, MEC, and HIP (Finland); CEA and CNRS/IN2P3 (France); BMBF, DFG, and HGF (Germany); GSRT (Greece); NKFIA (Hungary); DAE and DST (India); IPM (Iran); SFI (Ireland); INFN (Italy); MSIP and NRF (Republic of Korea); MES (Latvia); LAS (Lithuania); MOE and UM (Malaysia); BUAP, CINVESTAV, CONACYT, LNS, SEP, and UASLP-FAI (Mexico); MOS (Montene-gro); MBIE (New Zealand); PAEC (Pakistan); MSHE and NSC (Poland); FCT (Portugal); JINR (Dubna); MON, RosAtom, RAS, RFBR, and NRC KI (Russia); MESTD (Serbia); SEIDI, CPAN, PCTI, and FEDER (Spain); MOSTR (Sri Lanka); Swiss Funding Agen-cies (Switzerland); MST (Taipei); ThEPCenter, IPST, STAR, and NSTDA (Thailand); TUBITAK and TAEK (Turkey); NASU and SFFR (Ukraine); STFC (United Kingdom); DOE and NSF (U.S.A.).
Individuals have received support from the Marie-Curie programme and the European Research Council and Horizon 2020 Grant, contract No. 675440 (European Union); the Leventis Foundation; the A. P. Sloan Foundation; the Alexander von Humboldt Founda-tion; the Belgian Federal Science Policy Office; the Fonds pour la Formation `a la Recherche dans l’Industrie et dans l’Agriculture (FRIA-Belgium); the Agentschap voor Innovatie door Wetenschap en Technologie (IWT-Belgium); the F.R.S.-FNRS and FWO (Belgium) under the “Excellence of Science — EOS” — be.h project n. 30820817; the Ministry of Educa-tion, Youth and Sports (MEYS) of the Czech Republic; the Lend¨ulet (“Momentum”) Pro-gramme and the J´anos Bolyai Research Scholarship of the Hungarian Academy of Sciences, the New National Excellence Program ´UNKP, the NKFIA research grants 123842, 123959, 124845, 124850 and 125105 (Hungary); the Council of Science and Industrial Research, India; the HOMING PLUS programme of the Foundation for Polish Science, cofinanced from European Union, Regional Development Fund, the Mobility Plus programme of the Ministry of Science and Higher Education, the National Science Center (Poland), contracts Harmonia 2014/14/M/ST2/00428, Opus 2014/13/B/ST2/02543, 2014/15/B/ST2/03998, and 2015/19/B/ST2/02861, Sonata-bis 2012/07/E/ST2/01406; the National Priorities Re-search Program by Qatar National ReRe-search Fund; the Programa Estatal de Fomento de la Investigaci´on Cient´ıfica y T´ecnica de Excelencia Mar´ıa de Maeztu, grant MDM-2015-0509 and the Programa Severo Ochoa del Principado de Asturias; the Thalis and Aristeia pro-grammes cofinanced by EU-ESF and the Greek NSRF; the Rachadapisek Sompot Fund for Postdoctoral Fellowship, Chulalongkorn University and the Chulalongkorn Academic into Its 2nd Century Project Advancement Project (Thailand); the Welch Foundation, contract C-1845; and the Weston Havens Foundation (U.S.A.).
JHEP12(2019)059
Open Access. This article is distributed under the terms of the Creative Commons Attribution License (CC-BY 4.0), which permits any use, distribution and reproduction in any medium, provided the original author(s) and source are credited.
References
[1] R. Hamberg, W.L. van Neerven and T. Matsuura, A complete calculation of the order α2s
correction to the Drell-Yan K factor,Nucl. Phys. B 359 (1991) 343[Erratum ibid. B 644 (2002) 403] [INSPIRE].
[2] S. Catani, L. Cieri, G. Ferrera, D. de Florian and M. Grazzini, Vector boson production at hadron colliders: a fully exclusive QCD calculation at NNLO,Phys. Rev. Lett. 103 (2009) 082001[arXiv:0903.2120] [INSPIRE].
[3] S. Catani and M. Grazzini, An NNLO subtraction formalism in hadron collisions and its application to Higgs boson production at the LHC,Phys. Rev. Lett. 98 (2007) 222002
[hep-ph/0703012] [INSPIRE].
[4] K. Melnikov and F. Petriello, Electroweak gauge boson production at hadron colliders through O(α2s),Phys. Rev. D 74 (2006) 114017[hep-ph/0609070] [INSPIRE].
[5] ATLAS collaboration, Measurement of the high-mass Drell-Yan differential cross-section in pp collisions at√s = 7 TeV with the ATLAS detector,Phys. Lett. B 725 (2013) 223
[arXiv:1305.4192] [INSPIRE].
[6] ATLAS collaboration, Measurement of the low-mass Drell-Yan differential cross section at√ s = 7 TeV using the ATLAS detector,JHEP 06 (2014) 112[arXiv:1404.1212] [INSPIRE].
[7] ATLAS collaboration, Measurement of the double-differential high-mass Drell-Yan cross section in pp collisions at√s = 8 TeV with the ATLAS detector,JHEP 08 (2016) 009
[arXiv:1606.01736] [INSPIRE].
[8] CMS collaboration, Measurement of the Drell-Yan Cross Section in pp Collisions at√ s = 7 TeV,JHEP 10 (2011) 007[arXiv:1108.0566] [INSPIRE].
[9] CMS collaboration, Measurement of the differential and double-differential Drell-Yan cross sections in proton-proton collisions at√s = 7 TeV,JHEP 12 (2013) 030[arXiv:1310.7291] [INSPIRE].
[10] CMS collaboration, Measurements of differential and double-differential Drell-Yan cross sections in proton-proton collisions at 8 TeV,Eur. Phys. J. C 75 (2015) 147
[arXiv:1412.1115] [INSPIRE].
[11] ATLAS collaboration, Measurement of W± and Z-boson production cross sections in pp collisions at √s = 13 TeV with the ATLAS detector,Phys. Lett. B 759 (2016) 601
[arXiv:1603.09222] [INSPIRE].
[12] CMS collaboration, Performance of Electron Reconstruction and Selection with the CMS Detector in Proton-Proton Collisions at√s = 8 TeV,2015 JINST 10 P06005
[arXiv:1502.02701] [INSPIRE].
[13] CMS collaboration, Performance of the CMS muon detector and muon reconstruction with proton-proton collisions at√s = 13 TeV,2018 JINST 13 P06015 [arXiv:1804.04528] [INSPIRE].
JHEP12(2019)059
[14] CMS collaboration, The CMS trigger system,2017 JINST 12 P01020[arXiv:1609.02366][INSPIRE].
[15] CMS collaboration, The CMS Experiment at the CERN LHC,2008 JINST 3 S08004
[INSPIRE].
[16] J. Alwall et al., The automated computation of tree-level and next-to-leading order
differential cross sections and their matching to parton shower simulations,JHEP 07 (2014) 079[arXiv:1405.0301] [INSPIRE].
[17] P. Nason, A New method for combining NLO QCD with shower Monte Carlo algorithms,
JHEP 11 (2004) 040[hep-ph/0409146] [INSPIRE].
[18] S. Frixione, P. Nason and C. Oleari, Matching NLO QCD computations with Parton Shower simulations: the POWHEG method,JHEP 11 (2007) 070[arXiv:0709.2092] [INSPIRE].
[19] S. Alioli, P. Nason, C. Oleari and E. Re, A general framework for implementing NLO calculations in shower Monte Carlo programs: the POWHEG BOX,JHEP 06 (2010) 043
[arXiv:1002.2581] [INSPIRE].
[20] S. Frixione, P. Nason and G. Ridolfi, A Positive-weight next-to-leading-order Monte Carlo for heavy flavour hadroproduction,JHEP 09 (2007) 126[arXiv:0707.3088] [INSPIRE].
[21] E. Re, Single-top Wt-channel production matched with parton showers using the POWHEG method,Eur. Phys. J. C 71 (2011) 1547[arXiv:1009.2450] [INSPIRE].
[22] T. Sj¨ostrand et al., An Introduction to PYTHIA 8.2, Comput. Phys. Commun. 191 (2015) 159[arXiv:1410.3012] [INSPIRE].
[23] R.D. Ball et al., A first unbiased global NLO determination of parton distributions and their uncertainties,Nucl. Phys. B 838 (2010) 136[arXiv:1002.4407] [INSPIRE].
[24] NNPDF collaboration, Parton distributions for the LHC Run II,JHEP 04 (2015) 040
[arXiv:1410.8849] [INSPIRE].
[25] CMS collaboration, Event generator tunes obtained from underlying event and multiparton scattering measurements,Eur. Phys. J. C 76 (2016) 155[arXiv:1512.00815] [INSPIRE].
[26] R. Frederix and S. Frixione, Merging meets matching in MC@NLO,JHEP 12 (2012) 061
[arXiv:1209.6215] [INSPIRE].
[27] M. Czakon and A. Mitov, Top++: A Program for the Calculation of the Top-Pair Cross-Section at Hadron Colliders,Comput. Phys. Commun. 185 (2014) 2930
[arXiv:1112.5675] [INSPIRE].
[28] J.M. Campbell, R.K. Ellis and C. Williams, Vector boson pair production at the LHC,JHEP 07 (2011) 018[arXiv:1105.0020] [INSPIRE].
[29] T. Melia, P. Nason, R. R¨ontsch and G. Zanderighi, W+W−, W Z and ZZ production in the POWHEG BOX,JHEP 11 (2011) 078[arXiv:1107.5051] [INSPIRE].
[30] GEANT4 collaboration, GEANT4: A Simulation toolkit, Nucl. Instrum. Meth. A 506 (2003) 250[INSPIRE].
[31] CMS collaboration, Particle-flow reconstruction and global event description with the CMS detector,2017 JINST 12 P10003[arXiv:1706.04965] [INSPIRE].
[32] CMS collaboration, Energy Calibration and Resolution of the CMS Electromagnetic Calorimeter in pp Collisions at√s = 7 TeV,2013 JINST 8 P09009[arXiv:1306.2016] [INSPIRE].
JHEP12(2019)059
[33] A. Bodek, A. van Dyne, J.Y. Han, W. Sakumoto and A. Strelnikov, Extracting MuonMomentum Scale Corrections for Hadron Collider Experiments,Eur. Phys. J. C 72 (2012) 2194[arXiv:1208.3710] [INSPIRE].
[34] CMS collaboration, Search for physics beyond the standard model in dilepton mass spectra in proton-proton collisions at√s = 8 TeV,JHEP 04 (2015) 025[arXiv:1412.6302] [INSPIRE].
[35] R. Gavin, Y. Li, F. Petriello and S. Quackenbush, FEWZ 2.0: A code for hadronic Z production at next-to-next-to-leading order,Comput. Phys. Commun. 182 (2011) 2388
[arXiv:1011.3540] [INSPIRE].
[36] Y. Li and F. Petriello, Combining QCD and electroweak corrections to dilepton production in FEWZ,Phys. Rev. D 86 (2012) 094034[arXiv:1208.5967] [INSPIRE].
[37] A.V. Manohar, P. Nason, G.P. Salam and G. Zanderighi, The Photon Content of the Proton,
JHEP 12 (2017) 046[arXiv:1708.01256] [INSPIRE].
[38] D. Bourilkov, Photon-induced Background for Dilepton Searches and Measurements in pp Collisions at 13 TeV,arXiv:1606.00523[INSPIRE].
[39] D. Bourilkov, Exploring the LHC Landscape with Dileptons,arXiv:1609.08994[INSPIRE].
[40] G. D’Agostini, A Multidimensional unfolding method based on Bayes’ theorem,Nucl. Instrum. Meth. A 362 (1995) 487[INSPIRE].
[41] CMS collaboration, Measurement of the Inclusive W and Z Production Cross Sections in pp Collisions at√s = 7 TeV,JHEP 10 (2011) 132[arXiv:1107.4789] [INSPIRE].
[42] P. Golonka and Z. Was, PHOTOS Monte Carlo: A Precision tool for QED corrections in Z and W decays,Eur. Phys. J. C 45 (2006) 97[hep-ph/0506026] [INSPIRE].
[43] CMS collaboration, CMS luminosity measurement for the 2015 data-taking period,
CMS-PAS-LUM-15-001(2015). [INSPIRE].
[44] CMS collaboration, Measurements of differential production cross sections for a Z boson in association with jets in pp collisions at √s = 8 TeV,JHEP 04 (2017) 022
[arXiv:1611.03844] [INSPIRE].
[45] G.D. Lafferty and T.R. Wyatt, Where to stick your data points: The treatment of measurements within wide bins,Nucl. Instrum. Meth. A 355 (1995) 541[INSPIRE].
JHEP12(2019)059
The CMS collaboration
Yerevan Physics Institute, Yerevan, Armenia A.M. Sirunyan, A. Tumasyan
Institut f¨ur Hochenergiephysik, Wien, Austria
W. Adam, F. Ambrogi, E. Asilar, T. Bergauer, J. Brandstetter, E. Brondolin, M. Dragice-vic, J. Er¨o, A. Escalante Del Valle, M. Flechl, R. Fr¨uhwirth1, V.M. Ghete, J. Hrubec, M. Jeitler1, N. Krammer, I. Kr¨atschmer, D. Liko, T. Madlener, I. Mikulec, N. Rad, H. Rohringer, J. Schieck1, R. Sch¨ofbeck, M. Spanring, D. Spitzbart, A. Taurok, W. Wal-tenberger, J. Wittmann, C.-E. Wulz1, M. Zarucki
Institute for Nuclear Problems, Minsk, Belarus V. Chekhovsky, V. Mossolov, J. Suarez Gonzalez Universiteit Antwerpen, Antwerpen, Belgium
E.A. De Wolf, D. Di Croce, X. Janssen, J. Lauwers, M. Pieters, M. Van De Klundert, H. Van Haevermaet, P. Van Mechelen, N. Van Remortel
Vrije Universiteit Brussel, Brussel, Belgium
S. Abu Zeid, F. Blekman, J. D’Hondt, I. De Bruyn, J. De Clercq, K. Deroover, G. Flouris, D. Lontkovskyi, S. Lowette, I. Marchesini, S. Moortgat, L. Moreels, Q. Python, K. Skovpen, S. Tavernier, W. Van Doninck, P. Van Mulders, I. Van Parijs
Universit´e Libre de Bruxelles, Bruxelles, Belgium
D. Beghin, B. Bilin, H. Brun, B. Clerbaux, G. De Lentdecker, H. Delannoy, B. Dorney, G. Fasanella, L. Favart, R. Goldouzian, A. Grebenyuk, A.K. Kalsi, T. Lenzi, J. Luetic, N. Postiau, E. Starling, L. Thomas, C. Vander Velde, P. Vanlaer, D. Vannerom, Q. Wang Ghent University, Ghent, Belgium
T. Cornelis, D. Dobur, A. Fagot, M. Gul, I. Khvastunov2, D. Poyraz, C. Roskas, D. Trocino, M. Tytgat, W. Verbeke, B. Vermassen, M. Vit, N. Zaganidis
Universit´e Catholique de Louvain, Louvain-la-Neuve, Belgium
H. Bakhshiansohi, O. Bondu, S. Brochet, G. Bruno, C. Caputo, P. David, C. Delaere, M. Delcourt, B. Francois, A. Giammanco, G. Krintiras, V. Lemaitre, A. Magitteri, A. Mertens, M. Musich, K. Piotrzkowski, A. Saggio, M. Vidal Marono, S. Wertz, J. Zobec Centro Brasileiro de Pesquisas Fisicas, Rio de Janeiro, Brazil
F.L. Alves, G.A. Alves, L. Brito, G. Correia Silva, C. Hensel, A. Moraes, M.E. Pol, P. Rebello Teles
Universidade do Estado do Rio de Janeiro, Rio de Janeiro, Brazil
E. Belchior Batista Das Chagas, W. Carvalho, J. Chinellato3, E. Coelho, E.M. Da Costa, G.G. Da Silveira4, D. De Jesus Damiao, C. De Oliveira Martins, S. Fonseca De Souza, H. Malbouisson, D. Matos Figueiredo, M. Melo De Almeida, C. Mora Herrera, L. Mundim, H. Nogima, W.L. Prado Da Silva, L.J. Sanchez Rosas, A. Santoro, A. Sznajder, M. Thiel, E.J. Tonelli Manganote3, F. Torres Da Silva De Araujo, A. Vilela Pereira
JHEP12(2019)059
Universidade Estadual Paulistaa, Universidade Federal do ABCb, S˜ao Paulo, Brazil
S. Ahujaa, C.A. Bernardesa, L. Calligarisa, T.R. Fernandez Perez Tomeia, E.M. Gregoresb, P.G. Mercadanteb, S.F. Novaesa, SandraS. Padulaa, D. Romero Abadb
Institute for Nuclear Research and Nuclear Energy, Bulgarian Academy of Sciences, Sofia, Bulgaria
A. Aleksandrov, R. Hadjiiska, P. Iaydjiev, A. Marinov, M. Misheva, M. Rodozov, M. Shopova, G. Sultanov
University of Sofia, Sofia, Bulgaria A. Dimitrov, L. Litov, B. Pavlov, P. Petkov Beihang University, Beijing, China W. Fang5, X. Gao5, L. Yuan
Institute of High Energy Physics, Beijing, China
M. Ahmad, J.G. Bian, G.M. Chen, H.S. Chen, M. Chen, Y. Chen, C.H. Jiang, D. Leggat, H. Liao, Z. Liu, F. Romeo, S.M. Shaheen, A. Spiezia, J. Tao, C. Wang, Z. Wang, E. Yazgan, H. Zhang, J. Zhao
State Key Laboratory of Nuclear Physics and Technology, Peking University, Beijing, China
Y. Ban, G. Chen, A. Levin, J. Li, L. Li, Q. Li, Y. Mao, S.J. Qian, D. Wang, Z. Xu Tsinghua University, Beijing, China
Y. Wang
Universidad de Los Andes, Bogota, Colombia
C. Avila, A. Cabrera, C.A. Carrillo Montoya, L.F. Chaparro Sierra, C. Florez, C.F. Gonz´alez Hern´andez, M.A. Segura Delgado
University of Split, Faculty of Electrical Engineering, Mechanical Engineering and Naval Architecture, Split, Croatia
B. Courbon, N. Godinovic, D. Lelas, I. Puljak, T. Sculac University of Split, Faculty of Science, Split, Croatia Z. Antunovic, M. Kovac
Institute Rudjer Boskovic, Zagreb, Croatia
V. Brigljevic, D. Ferencek, K. Kadija, B. Mesic, A. Starodumov6, T. Susa University of Cyprus, Nicosia, Cyprus
M.W. Ather, A. Attikis, G. Mavromanolakis, J. Mousa, C. Nicolaou, F. Ptochos, P.A. Razis, H. Rykaczewski
Charles University, Prague, Czech Republic M. Finger7, M. Finger Jr.7

![Figure 3. Summary of the systematic uncertainties on the differential cross section measurement dσ/dm [pb/GeV] in the dimuon (upper) and dielectron (lower) channels](https://thumb-eu.123doks.com/thumbv2/9libnet/4268649.68401/13.892.199.694.132.988/figure-summary-systematic-uncertainties-differential-measurement-dielectron-channels.webp)