RENEWABLE ENERGY SOURCES OF TRA2 REGION (IGDIR, KARS, ARDAHAN AND AGRI) FOR SUSTAINABLE DEVELOPMENT
Yusuf Alparslan ARGUN Igdir University [email protected] Sevtap DOGRU Igdir University [email protected] Aysun ALTIKAT Igdir University [email protected] Züleyha BINGUL Igdir University [email protected] ABSTRACT
The need for energy has begun to form spontaneously with human’s existence. Energy that is necessary to sustain in today’s people's needs and improvements in a healthy manner and predicted to vital in the future are widely used in sectors such as industry, housing and transportation. 85% of the energy produced in the world is obtained from fossil fuels and this situation leads to climate change by disrupting the ecosystem. Impossibility of fossil fuels resources sustainability considering the rate of formation of theirs natural process, rapidly increase of the environmental pollution problems generating from fossil fuel consumption are revealed the need to investigate renewable and environmentally friendly energy sources and to include them into the world's energy production network in line with the need to be urgently global cautions as a result. In this study, it is evaluated renewable energy potential, made and planned investments of the region Igdir, Kars, Ardahan and Agri (TRA2). The region ranks 3rd after the Southeastern Anatolia and Mediterranean in terms of solar energy. The daily average solarshine duration of the region is over 7.5 hours which is Turkey’s average and radiation intensity is over 4.2 kWh/m² which is Turkey’s average too. In addition, electricity generation from solar energy with no license in all cities of the region Igdir, Kars, Ardahan and Agri is supported with the government promotion. On the other hand, especially presence of wind speed over of 7m/sec in Fish Lake located on the border of Agri-Igdir and being of capacity factor over of 35% demonstrate energy potential in terms of the wind energy. As a result of meeting the livelihood of the region population with livestock farming the region of Igdir, Kars, Ardahan and Agri comes in first place in Turkey with the average of 40,000 and over cattle numbers in cities and towns of the region for biomass energy potential. For geothermal energy, there are some places in different parts of the region especially first Agri-Diyadin area, including Kars-Susuz and Kars-Kotek where have potential to be able to make geothermal energy generation investments. It has been shown the presence of renewable energy sources in the investigation made by MTA, the General Directorate of Renewable Energy and SERHAT Development Agency in the region. It is also mentioned the potential researches made by aforesaid institutions in this study. Keywords: Igdir, renewable energy sources, biomass, wind power, solar energy, geothermal energy, TRA2 Region
INTRODUCTION
Every living thing is a machine that has the ability to perform certain tasks. energy is also required in order to do work. Work-energy equivalencewhich is one of the fundamental laws of nature tells us that the only value of to do work is the energy. Human is a living entity and so It needs energy to survive. Source of energy is fire that mankind on earth uses first meet out of food. Once he starts using the Fire, he has opened a new way to him separated from all other living entity. Opened this way has continued to be used in the transportation of water power and in windmills of wind power. It gained a new dimension with the industrial revolution When it comes to the 18th century. Energy that is a tool until industrial revolution, after industrial revolution it has turned into quickly purposes. Fossil fuels have been used to produce energy and polluting factors have been unconsciously given to the receiving environment. However in those years environmental pollution has not been understood due to the assimilation capacity of environment.
It has changed the supply-demand balance in energy owing to rapid population growth in the world and rapidly development of the industry as parallel. Fossil fuels that has limited reserves to meet demand has quickly started to be consumed. Nowadays, each year as a result of industrial activities into the atmosphere have been released about 20 billion tons of carbon dioxide, 100 million tons of sulfur compounds, 2 million tons of lead and other toxic chemical compounds (Kadıoğlu at al.,1996,55). It are running out day by day reserves of traditional energy sources that make up a large portion of the energy used in the world. Perhaps especially in the 20th century, intensively use of fossil fuels such as oil, coal and natural gas have been confronted world with an series of environmental problems that may be impossible to turn back. in years considering that it come near to an dramatic end , scientists have entered into the quest for resources that reserves and pollution will not be an issue. Today, many renewable energy source such as biomass, wind, solar, hydro, geothermal found and continue improving the day to day. Obtaining energy from renewable energy sources in our country as in the world shows the increase and is encouraged by being given priority in regional development.
In this study, investments, the current status and potential constituting the field in renewable energy sources that is rapidly growing in importance in recent years in our country and in the world has been aimed to increase of awareness in the region TRA2 (Ağrı, Ardahan, Iğdır, Kars). The scope of work solar, wind, biomass and geothermal energy sources were determined energy producibility, usage areas, areas that may be conducive to investment in the region examining areas suitable for energy production in TRA2 region.
SOURCES OF ENERGY IN TURKEY
Using both classical energy resources and renewable energy sources in Turkey are obtained energy. While Turkey's gross electricity consumption in 2014 was realized as 257.2 billion kWh, compared to the previous year was 264.1 billion kWh increasing 2.7% in 2015. Compared to the previous year our electricity production (252.0 billion kWh) increasing by 3.1% has been realized as 259.7 billion kWh. Electricity consumption in 2020 according to the high scenario is expected to reach to 392 TWh with 6.9% annual increase of approximately. According to the basic scenario is expected to reach to 357.4 TWh with 5.5% of annual average increase. New power plants that total capacity has been 4,288 MW has been added to the system in 2015 and Turkey's installed capacity has reached 73 147 MW as of the end of 2015. In 2015, country's electricity production has been obtained from natural gas by 37.8%, from coal by 28.4%, from hydraulic by 25.8%, from wind by 4.4%, from geothermal by 1.3% and from other sources to 2,2%. Change of according to the year of the electric power installed capacity has been given in Table-1 and electricity production of according to the types of energy resources has been given in Table-2(TEIAŞ, 2016).
Table-1: Changes by Years of Electricity Installed Power in Turkey(TEIAŞ, 2016).
Energy Sources 2013 2014 2015 2016(End of
February) Natural Gas + LNG 20.255,0 MW (%31,6) 21.476,1 MW (%31) 21.260,9 MW (%29,1) 21.231,9 MW (%28,7) Hydraulic (with Dams) 16.142,5 MW (%25,2) 16.606,9 MW (%24) 19.077,2 MW (%26,1) 19.293,3 MW (%26,1) Hydraulic (stream) 6.146,6 MW (%9,6) 7.036,3 MW (%10) 6.790,6 MW (%9,3) 6.843,9 MW (%9,3) Coal 12.427,8 MW (%19,4) 14.635,9 MW (%21) 15.492,6 MW (%21,2) 15.762,6 MW (%21,3) Thermic (Other) 5.965,2 MW (%9,3) 5.689,8 MW (%8) 4.787,2 MW (%6,5) 4.854,0 MW (%6,6) Wind 2.759,6 MW (%4,3) 3.629,7 MW (%5) 4.503,2 MW (%6,2) 4.561,4 MW (%6,2) Geothermal 310,8 MW (%0,5) 404,9 MW (%0,9) 986,3 MW (%1,3) 979,8 MW (%1,3) Solar 40,2 MW (%0,1) 248,8 MW (%0,3) 327,6 MW (%0,4) Table-2: Changes by Years of Electric Energy Production in Turkey (TEIAŞ, 2016).
Energy Sources 2013 2014 2015 2016(End of
February) Natural Gas + LNG 105.116.347 MWh (%43,8) 120.576.032 MWh (%47,9) 98.193.351 MWh (%37,8) 14.478.731 MWh (%32,9) Hydraulic (Total) 59.420.464 MWh (%24,8) 40.644.663 MWh (%16,1) 66.903.180 MWh (%25,8) 10.641.605 MWh (%24,2) Coal 63.054.360 MWh (%26,3) 75.308.499 MWh (%29,9) 73.872.601 MWh (%28,4) 14.361.912 MWh (%32,7) Thermic (Other) 3.641.744 MWh (%1,5) 4.549.435 MWh (%1,8) 5.750.635 MWh (%2,2) 1.351.298 MWh (%3,1) Wind 7.557.507 MWh (%3,1) 8.520.141 MWh (%3,4) 11.552.121 MWh (%4,4) 2.397.592 MWh (%5,5) Geothermal 1.363.528 MWh (%0,6) 2.363.983 MWh (%0,9) 3.418.417 MWh (%1,3) 724.194 MWh (%1,6) Petroleum
Domestic recoverable oil reserves is 388.5 million barrels (52.5 million tonnes) in 2015. If aren't detected new reserves, There is a 21-year lifetime of reserves of domestic total crude oil with the amount of current produced. 7% of the country's crude oil needs of in 2015 were provided by domestic production and The share of domestic production of natural gas was only limited to 1% (ETKB,2016).
Natural Gas
Reserves of natural gas is located 76 trillion cubic meters (41%) in the Middle East, 59 trillion cubic meters (33%) in Russia and Commonwealth countries of Independent States, 31 trillion cubic meters (17%) in Africa / Asia Pacific countries. Produced reserves of natural gas as of the end of 2015 of our country is 18.5 billion m³. Our installed power to produce of electric power by using
natural gas is 21.222 MW by the end of 2015. This value provides 29.0% of our total installed power (ETKB,2016).
Coal
Our country's installed power based on local coal has been 8.515 MW (13,3%) and its installed power based on import coal has been 4.048 MW (6,3%) and its plant installed power in total has been 12.563 by the end of 2013 and it meets 20% of Turkey's total installed power. Boring works to search coal have been accelarated in recent ten years and as a result of these works, 4,1 billion tone new brown coal reserve was ascertained by May in 2008 as additional to 8,3 billion tone current reserve (ETKB,2016).
Hydraulıc
Hydroelectric plants are sustainable, renewable, plentiful, non- foreign dependent, long-termed and cheap power source for Turkey's power generation. Turkey's mean height with 1132 m is more than Europe's mean height. Our country's theoretical hydroelectric potential is 1% of world's theoretical potential and its economic potential is 16% of Europe's economic potential. Thus, it is possible to do high productive hydroelectric plant (Argun,2011,49).
Our hydraulic sources' theoretical hydroelectric potential which has got the most important place in our country's renewable energy potential is 433 billion kWh and the potential which can be evaluated as theoretical is 216 billion kWh and economic hydroelectric energy potential is 140 billion kWh/ year. 467 pieces of HEP have been available by the end of 2013, total installed power of these HEP's is 22.289 MW and also, it meets nearly 34,8% of total HEP potential in the country. While 24,8% of our power generation was met of hydraulic, this rate reached 25,8% with an increase of 1% in 2015. Within the scope of the country's 2023 goals, it is planned that all of hydroelectric potential are used in the power generation (ETKB,2016).
Wınd
Wind power is a power source which is a power source not having any emission, not consuming natural sources, not contributing to global warming ,not causing acid rains, being sensitive in local environment. Noise that wind power gives to its immediate surroundings, its interaction with TV and radio broadcast, its danger on birds and its visual effects are its common environmental effects (Kumbur et al.,2005). Air movements occur as a result that the ground surface such as land-sea, mountain - valley heat differently, and temperature, humidity and pressure are different. Nearly 2% of solar radiation which is the factor of these air movements turns into wind power (Yeşil,2015).
The mean wind speed is evaluated as medium level for 6,5 km/h , fine for 7,5 km/h , very fine for 8,5% km/h and over for a wind power plant which is planned to be established in our country. Wind plant at 5MW power per square kilometer was accepted in places which are at 50 meter height from Turkey's ground level and have got over 7,5 km/h wind speed. In consideration of these acceptances, REPA map that information on wind source generated with the use of medium-scaled numerical weather forecast model and micro-scaled wind flow model were given were prepared. It is necessary that there is a constant wind flow at 7 km/h or its over in a place so that the investment in wind power plant can be done in the place. It is required in the declaration published by The General Directorate of Renewable Energy that the measurement is done for one year at least in order to get power generation license and investors make the long-termed measurements in the region where the investment is likely to be done near to REPA map's values.
Turkey's wind power potential was determined as 48.000MW. Total area which meets this potential equals with 1.30% of Turkey's surface area. The amount of annual wind power generation
belonging to the end of 2013 is 7.518 GWh in Turkey. The installed power of wind power plant in the operation by the end of 2013 has been 2760MW ( Kumbur et.al,2005). The amount of annual wind power generation at the end of 2015 is 11.552 in Turkey. The installed power of wind power plant in the operation by the end of 2015 has been 4.503 MW. When 3,1% of our power generation was met from Wind Power Plant in 2013, that rate became 4,4% in 2015 (ETKB,2016).
Solar
Solar power is sustainable, non-consuming natural sources , not causing weather pollution, ergonomical and renewable energy source which its violence from sun and out of world's atmosphere is stable and which is 1370 W/m2 , and which changes at the range of 0-1100 W/m2 above the ground. It is used under the control from heating to chilling (Kumbur et.al.,2005). Turkey's annual total sunshine duration is 2.737 hours ( 7,5 hours for total of a day), annual total coming solar power has been determined as 1.527 kWh/m2 (4.2 kWh/m2 for total of a day) (GEPA).
With the establishment of unlicensed power generation plants, while the number of solar power plants has been seen as 362 by the end of 2015, total installed power of those plants has been 248.8 MW. Solar power plants' share in power generation has been 0.3% by 2015 (ETKB,2016). Geothermal
Geothermal power is a heat energy which is obtained by the artificial ways from hot dry rocks with hot water, steam and dry steam which occur as the heat collected in rocks at deep of ground is stored in reservoirs as it is relocated by liquids. Geothermal sources occur around of volcanic and magmatic units intensively with activated fault systems. As the gas emission of CO2,NOx, SOx is very low in modern geothermal power plants based on geothermal power, it is assessed as a clean power source . It is used to produce chemical substance in industry especially in low-tempered areas (20-70°C). Medium-tempered (70-150°C) and high-tempered ( over of 150°C) areas are used in heating practices in an integrated way as depending on reinjection conditions besides power generation (Yeşil,2015).
Our country's geothermal potential is 31.500 MW as theoretical. 79% of areas with the potential in our country are in West Anatolia, 8.5% of them are in Middle Anatolia, 7.5% of them are in Marmara Region, 4.5% of them are in East Anatolia and 0.5% of them are in other regions. 94% of our geothermal sources have got low and medium temperature, they are proper for the direct practices ( heating, thermal tourism, available mineral etc.) , 6% of them are proper for the indirect practices ( power generation) (Yeşil,2015).
As it has been concentrated on developing available sources and on works of seeking new source areas with the support of our Ministry since 2005, the additional 1900 MW heat energy increase has been gotten after the heat capacity which was 3100 MWt usable by the end of 2004 and the additional 190.000 meter-boring research by the end of December 2015 were completed. The number of geothermal areas which were 173 pieces and were found by MTA have been raised to 230 areas with the exploration of new areas which 10 of them are proper to generate power by boring-researches, 5000 MW heat power has been gotten by the holes including natural outputs as totally 592 pieces of 350.000-meter boring research works have been done up to day. This source's share in power generation in our country is 1.3% (Yeşil,2015).
Bıomass
Biomass power turns into chemical power with the power which is taken from sun by photosynthesis and it is a power which occurs by a result of this transformation. Biomass power over world is used in the purpose of warming, fuel generation and power generation. Carcinogen and sulphur are not seen in fossil fuels in biomass. Thus, its danger on environment is significantly
little. Plants, animals and organic wastes are used as a main source in biomass power (Sağır, 2007).
As biodiesel provides carbon cycle as it transforms into CO2 with photosynthesis by the reason that it is gotten from agricultural plants, it does not reflect an effect to increase greenhouse effect (ETKB,2016).
Bioethanol is an alternative fuel which is obtained by the fermentation of sığar, amylum or cellulose-consistent agricultural products such as those with sugar beet, corn, wheat and suffrutescent raw materials , and which is used after it is collated with gasoline at certain rates. There is 160 thousand-tone bioethanol installed capacity in our country as total 22 million tone fuel oil consumption which its 3 million tone is gasoline consumption is available (ETKB,2016).
The following cases have been the most criticized aspect of biofuel agriculture; food and cultivated lands are separated for the generation of biodiesel and bioethanol and so it has got a global risk in terms of food safety (ETKB,2016).
Biogas is mainly coal and carbondioxide gas which occurs as a result that organic substances ( animal wastes, vegetal wastes, city and industrial wastes) are exposured to biodegradation ( anaerobic fermentation)in oxygien-free conditions. Biogas technology gives opportunity to that power is gotten of organic sedimentary wastes and also wastes are brought to soil (Yeşil,2015). It is estimated that biogas amount which would be generated to meet Turkey's animal waste potential is 1,5-2 million tone (MTEP) equal petrol. Our waste potential is nearly 8,6 MTEP, its 6 MTEP is used in the purpose of heating. Biomass power's share in 2015 power generation is seen as 0,6% (TEIAS, 2016).
RENEWABLE ENERGY IN THE REGIONS OF TRA2(IFDIR, KARS, ARDAHAN AND AGRI) There have been significantly improvements in power generation in our country in recent time, it has been given precedence to do hydroelectric plant (HEP) for the power generation in TRA2 region in consideration of these improvements. HEP's were installed on rivers on Aras Basin in TRA2 region via both of the state and private attempts. Moreover, the region has got a geostrategic importance as it is positioned in the passing direction of power transfer lines. Although naturalgas main lines pass through this region, the supply of naturalgas was only done in order to be used in housings in the purpose of heating in Sarikamis in Kars and the supply of naturalgas for Igdir is planned for the city center in 2016 (Caliskan et.al.,2014).
Power usage which is quota per capita in our country is 2490 kWh by data of 2011, this amount in developed countries is nearly 8900 kWh. When TRA2 region is reviewed, the mean power usage per person is less than one third of Turkey's average as 720 kWh (TUIK, 2013).
Although there are renewable energy sources such as Sun, Wind, Geothermal and Biogas except from HEP in TRA2, the only renewable energy sources which was used to the year of 2016 was HEP. Especially, as Agri has got 1700kWh/m2 - annual radiation value in terms of solar power, it attracts the attention both in Turkey and the region (Caliskan et.al. , 2014).
Hydraulic
Although the mean flow of aras basin (figure-1) in the region is 4,63*109m3/year, its technical energy potential is 13.114 GWh / year and its economic usable potential is 2.287 GWh /year, 15 pieces of hep have been done by the state and private attempts up to day, the installed power of these hep is 588 MW and technical potential usage rate is 17,44% (Uluatam, 2011).
Figure-1: HPP structures in the basin Aras (YEGM, 2016) Wınd
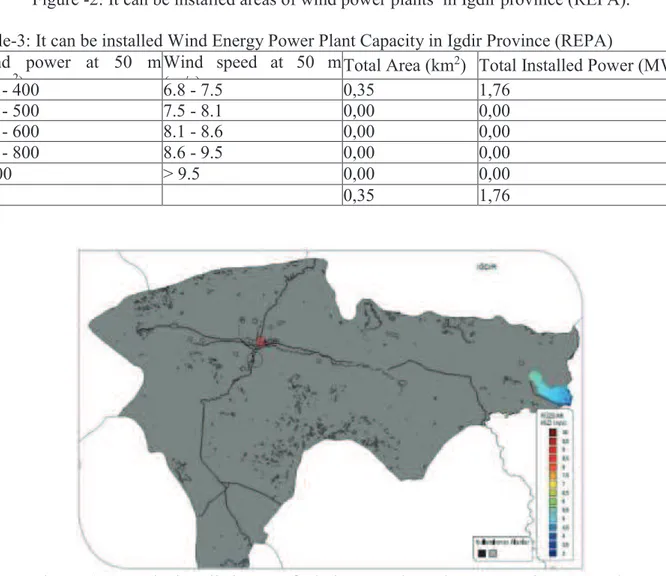
Wind power potential of The Province Igdir comes at the first order among the region's provinces. There are areas that wind speed reaches to 8 km/h in this province's district Tuzluca. There is 0.35 km2 area which has got investable 6,8-7,5 km/h wind speed and its potential power is 1,76 MW (Table3) , as REPA'S data in the province Igdir is reviewed. Even if it increases its investable case with its structure like plain, it will increase the investment costs as tuzluca region where the investment will be done is far away from energy transfer lines (Yeşil,2015).
When the province Agri is reviewed on the wind power atlas (Figure 3), the wind speed in excess of 7 km/h attracts attention around Balik lake in the border of Igdir and the generable power is 0,24 MW (Table -5). Aforementioned place's capacity is 35%, this area is close to the transformer center and this increases its investable area (Yeşil,2015).
According to REPA data of Ardahan (Figure-4), it has got 9,20MW power potential in 1,84 Km2 (Table-5). The province Ardahan is among important areas in terms of The Districts Posof and Cildir's wind power potential. According to measurements which were done by a private firm, it was stated that 7 km/h wind speed is available around the lake and 100 kW plant which will be established will amortise itself in 3 or 4 years. The capacity factor around the lake is over of 35%, the lake is close to the transformer center and this forms a great advantage. While other places in the province having dense wind are in the District Posof, this area has got a distance position to the energy transfer lines (Yeşil,2015).
According to REPA data of The Province Kars (Figure-5), it has got 3,36 MW wind power potential in 0,67 Km2 area (Table-6). There are areas with high wind speed in part in the districts Arpacay and Susuz. Measurements are done in the province's districts such as Kagizman and Sarikamis by private companies and areas which are proper to the investment are searched (Yeşil,2015).
It is clear that total 14,56 MW potential power would be gotten as wind power in the region wide and the investable potentials will revealed by the detailed feasibilities which will be done in the region (Yeşil,2015).
Figure -2: It can be installed areas of wind power plants in Igdir province (REPA). Table-3: It can be installed Wind Energy Power Plant Capacity in Igdir Province (REPA) Wind power at 50 m
(W/m2)
Wind speed at 50 m (m/s)
Total Area (km2) Total Installed Power (MW)
300 - 400 6.8 - 7.5 0,35 1,76 400 - 500 7.5 - 8.1 0,00 0,00 500 - 600 8.1 - 8.6 0,00 0,00 600 - 800 8.6 - 9.5 0,00 0,00 > 800 > 9.5 0,00 0,00 0,35 1,76
Figure -3: It can be installed areas of wind power plants in Ağrı province (REPA). Table-4: It can be installed Wind Energy Power Plant Capacity in Ağrı Province (REPA)
Wind power at 50 m (W/m2) Wind speed at 50 m (m/s) Total Area (km2)
Total Installed Power (MW)
300 - 400 6.8 - 7.5 0,05 0,24
500 - 600 8.1 - 8.6 0,00 0,00
600 - 800 8.6 - 9.5 0,00 0,00
> 800 > 9.5 0,00 0,00
0,05 0,24
Figure -4: It can be installed areas of wind power plants in Ardahan province (REPA). Table-5: It can be installed Wind Energy Power Plant Capacity in Ardahan Province (REPA)
Wind power at 50 m (W/m2) Wind speed at 50 m (m/s) Total Area (km2)
Total Installed Power (MW) 300 - 400 6.8 - 7.5 1,79 8,96 400 - 500 7.5 - 8.1 0,05 0,24 500 - 600 8.1 - 8.6 0,00 0,00 600 - 800 8.6 - 9.5 0,00 0,00 > 800 > 9.5 0,00 0,00 1,84 9,20
Table-6: It can be installed Wind Energy Power Plant Capacity in Kars Province REPA) 50 m'de Rüzgar Gücü (W/m2) 50 m'de Rüzgar Hızı (m/s) Toplam Alan (km2) Toplam Kurulu Güç (MW) 300 - 400 6.8 - 7.5 0,67 3,36 400 - 500 7.5 - 8.1 0,00 0,00 500 - 600 8.1 - 8.6 0,00 0,00 600 - 800 8.6 - 9.5 0,00 0,00 > 800 > 9.5 0,00 0,00 0,67 3,36 Solar
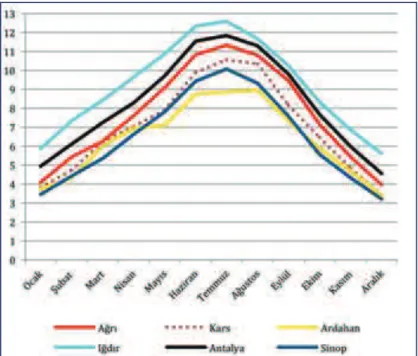
The region is at third order as following South East Anatolia and Mediterranean Regions in terms of solar power. The region's daily mean sunshine duration is more than 7,5 hours which is Turkey's mean and 4,2 kWh /m2 which is Turkey's radiation duration mean. Moreover, the licensed-free power generation from solar power in all of provinces such as Igdir, Kars, Ardahan and Agri Regions is supported by the government promotion. When the GEPA maps are considered as regional, The Province Agri is at the first order in the region with 1600 kwh/m2- annual values in terms of total solar radiation values. When the sunshine duration of provinces is reviewed, Igdir's sunshine duration is very long as its cloudy day's number is low. The province has got longer sunshine duration even than the province Antalya (Figure-6) (Yeşil,2015).
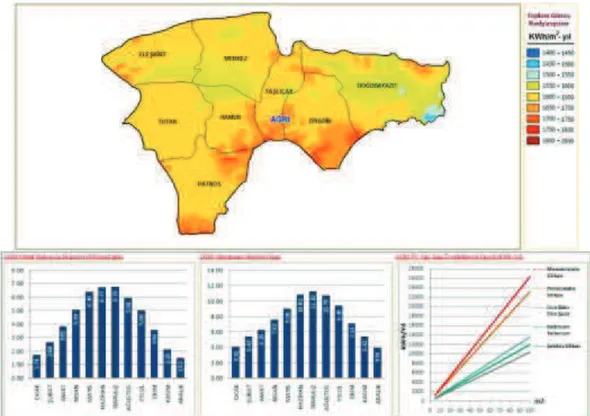
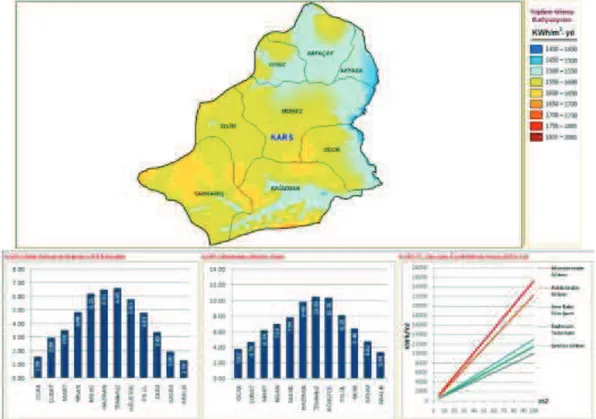
According to GEPA data of Igdir (Figure-7), it has got 249 kWh/m2-year ( with monocrystalline silicon ) solar power potential with the mean daily 4,1 kWh/m2 radiation intensity and the mean daily 9,15-hour sunshine duration. It is understood from GEPA data (Figure-8) that the province Agri has got higher level than other provinces of the region in terms of solar radiation. When the province Agri is reviewed, it has got 261 kWh /m2-year (with monocrystalline silicon ) solar power potential with the daily mean 4,38 kWh /m2 radiation intensity and the daily mean 7,62-hour sunshine duration. When the province Ardahan's solar power potential data are reviewed (Figure -9), it has got a radiation under the mean of Turkey. The province Ardahan has got 246 kWh /m2-year ( with monocrystalline silicon ) solar power potential with the daily mean 4,04 kWh /m2 radiation intensity and the daily mean 6,34-hour sunshine duration. According to data belonging to the province Kars (Figure-10), it has got 252 kWh /m2-year (with monocrystalline silicon ) solar power potential with the daily mean 4,15 kWh /m2 radiation intensity and the daily mean 6,95-hour sunshine duration. According to data of TRA2 Region, it is seen that the mean solar energy potential is 252 kWh /m2-year (GEPA,2016).
Figure -6: Comparison with Solarshine durations of the region TRA2 of the provinces of Antalya and Sinop. (GEPA)
Figure -8: It can be installed areas of solar power plants in Ağrı province (GEPA).
Figure -10: It can be installed areas of solar power plants in Kars province (GEPA). Geothermal
The importance of geothermal sources (Figure-11, Figure-12) from clear alternative energy sources which are concentrated in Aegean Region and are seen locally in the provinces such as Agri, Kars, Van and Erzincan has increased both in our country and over world (MTA, 2012).
There are geothermal sources in the districts such as Susuz and Kotek in Kars in TRA2 Region especially in Diyadin part of Agri (YEGM,2016). Geothermal power research works were firstly done in the region by MTA in 1997 and the boring works were done. In this sense, water with 75°C was gotten as two holes were opened. In the upcoming years, 215 m depth was gotten as 4 more holes were added. Moreover, although the liquified CO2 and dry ice facility in the region of Diyadin was not made ready to the activity, CO2 and dry ice factory was closed due to reasons as the hot water flow could not constantly provided and the sulphur rate in this hot water could not correctly be calculated. The development in areas only such as thermal tourism, heating and greenhouse cultivation would be showed as the temperature of geothermal sources in TRA2 region is low. (MTA, 2012).
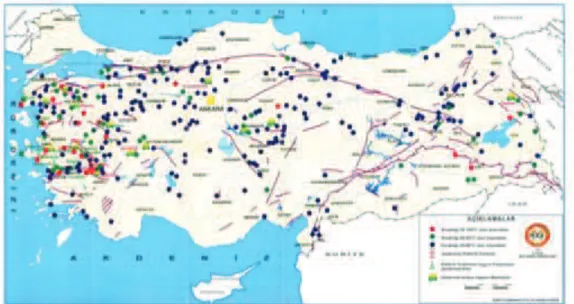
Figure -11: Map Of Distribution Of Geothermal Resources In Turkey (MTA, 2012)
Figure -12: Map Of Geothermal Resources Application In Turkey (MTA, 2012)
Bıomass
Plants which are specifically grown as agricultural products, corn, wheat for biomass , herbs, wood and woody wastes, plants in water, algaes, algaes inşa, animal wastes, food processing processes' wastes, all organic wastes ( fruit and vegetable wastes) which are thrown from homes create source. When the region is reviewed in consideration of BEPA data (Table-7) within the scope of these sources, it is seen that Igdir's Animal Wastes Energy Value is 5.739,23 TOE/Year, Vegetal Wastes Energy Equivalent is 99.960,26 TOE/Year, Civic Organic Wastes Energy Value is 3.502,76 TOE/Year and Wastes' Total Energy Equivalent is 109.202,26 TOE/Year. In Agri that its population is the most in this region, Animal Wastes Energy Value is 18.017,77 TOE/Year, Vegetal Wastes Energy Equivalent is 149.364,46 TOE/Year, Civic Organic Wastes Energy Equivalent is 10.162,02 TOE/Year, Wastes' Total Energy Equivalent is 177.544,25 TOE/Year. When the province Ardahan's data are reviewed as it has got the least potential in the region, Animal Wastes Energy Value is 18.206,90 TOE/Year, Vegetal Wastes Energy TOE is 17.11,64 TOE/Year, Civic Organic Wastes Energy Value is 1.961,80 TOE/Year, and Wastes' Total Energy
Equivalent is 37.980,35 TOE/Year. In the province Kars which the life stock is mostly done in the region , Animal Wastes Energy Value is 29.937,58 TOE/Year, Vegetal Wastes Energy Equivalent is 94.096,88 TOE/Year, Civic Organic Wastes Energy Value is 5.607,49 TOE/Year and Wastes' Total Energy Equivalent is 129.641,95 TOE/Year. When all the region wide are reviewed, Wastes' Total Energy Equivalent is 454.368,81 TOE/Year, in another saying, they have got 5.282.95 GWh/Year total biomass potential. The biogas facility which will have the greatest installed power in Turkey with 6 MW in 12,5-hectare areas in the region was projected, the necessary permission and licenses were taken , villagers were talked about raw material and its construction is about to end (BEPA, 2016).
Table-7: Biomass views of the regions of Turkey and TRA2 Provinces (BEPA)
TÜRKİYE IĞDIR AĞRI ARDAHAN KARS
Population 75.627.384,00 190.409,00 552.404,00 106.643,00 304.821,00 The Number Of Animals In Total
(Piece) 362.734.882,00 810.514,00 1.922.916,00 616.253,00 1.167.235,00 The Amount Of Animal Waste
(tons/year) 156.759.836,61 1.164.521,18 3.390.814,71 2.458.297,40 4.185.852,64 The Energy Value Of Animal Waste
(TEP/ year) 1.323.714,67 5.739,23 18.017,77 18.206,90 29.937,58 The Amount Of Crop Production
(tons/year) 142.418.566,47 838.202,00 1.133.031,00 119.659,00 657.061,00 The Amount Of Vegetable Waste
(tons/year) 142.441.285,37 861.455,72 1.258.885,03 170.414,30 867.530,56 Energy Equivalent of Vegetable
Waste (TEP/year) 15.941.321,26 99.960,26 149.364,46 17.811,64 94.096,88 The Amount Of Urban Solid Waste
(tons/year) 29.618.188,14 55.599,43 161.301,97 31.139,76 89.007,73 Energy Values Of Urban Organic
Waste (TEP/year) 2.186.228,09 3.502,76 10.162,02 1.961,80 5.607,49 Total Energy Equivalent of waste
(TEP/year) 20.307.069,02 109.202,26 177.544,25 37.980,35 129.641,95 Biodiesel Processing License Owner
Firms 24
Bioethanol Processing License
Owner Firms 3 0 0 0 0
The Number Of Electricity Generation Plant with Biomass Sourced
42 0 0 0 0
CONCLUSION
Mankind have needed to energy from the day that they existed and they have met their energy needs with the day's available technologies. The demand on energy has increased with the growing technology and it had to have the anxiety on the consumption of fossil resources. The only problem is not the consumption of fossil fuel, soil, water and weather were destroyed significantly with the usage of these sources and this case obliged the mankind to come up against a case that it is difficult to recycle. Fossil fuels will get a form not to be gotten one data and they will find new sources for power need and these sources will meet the need as the new sources are developed but it will be very difficult and it is also impossible to remove destructions that mankind have done in necessary environment in the event that they would survive as their need more than energy.
In order to minimize destructions on the environment, it was tried that the available case of renewable energy sources which reflected the potential in the region and the preminent energy sources were determined on that study. Within this scope, the usage of hydraulic, wind, solar,
thermal and biomass energies in Turkey (respectively ) and their potential in TRA2 Region were reviewed. As a result the investigation which were done, it was seen that there are geothermal sources in Agri's Diyadin district and Kars' susuz and Kotek districts on geothermal energy and when the temperature value is reviewed, it is used only in the regions such as thermal tourism, heating, and greenhousing . Total power capacity in the region was 14.56 MW in wind power, its total energy potential for biomass energy is 5.282,95 GWh/Year. Moreover the last phases have been about to end in the construction of a biogas facility which has got 6 MW installed power to provide great contributions our country and to all of world especially in the region, Kars, Selim. While the province Kars which has got the highest level in the region with 4,38 kWh/m2 radiation intensity in terms of the radiation intensity in solar power is reviewed, it attracts attention that the province Igdir which has got 9,15 daily mean sunshine duration is more than the province Antalya. It is seen that the region's mean power potential is 252 kWh /m2-year (with monocrystalline silicon). Only 17,44 % of 2.287 GWh/Year hydraulic energy has been used in the region as economic usable potential.
Consequently, it is estimated that it is possible to meet energy sources as the region's energy need with the usage of renewable energy sources to remove fossil fuel and foreign-source dependency and above all to decrease the destruction on environment to some extend that global climate change has raised and improved today.
REFERENCES
Argun M.E., Argun Y.A., “Alternative Energy Sources in Turkey for Sustainable Development”, Int. J. of Thermal & Environmental Engineering, Volume 2, No. 1 (2011) 49-54
BEPA (Biokütle Enerjisi Potansiyel Atlası), Available from: http://www.eie.gov.tr. Çalışkan, U., v.d., “TRA2 Bölgesi 2014 – 2023 Bölge Planı” 2014
ETKB (Enerji ve Tabii Kaynaklar Bakanlığı) – Bilgi Merkezi verileri, 2016, Available from: http://www.enerji.gov.tr
GEPA (Güneş Enerjisi Potansiyeli Atlası), Enerji Ve Tabii Kaynaklar Bakanlığı Available from: http://www.eie.gov.tr
Kadıoğlu S., Tellioğlu Z., “Enerji kaynaklarının kullanımı ve çevreye etkileri”, TMMOB Türkiye Enerji Sempozyumu, s. 55-67, 1996.
Kumbur, H., Özer, Z., Özsoy, H. D., & Avcı, E. D., "Türkiye’de geleneksel ve yenilenebilir enerji kaynaklarının potansiyeli ve çevresel etkilerinin karşılaştırılması." III. Ulusal Yenilenebilir Enerji Kaynakları Sempozyumu, Mersin (2005).
MTA (Maden Tetkik ve Arama) Genel Müdürlüğü Verileri, 2012
REPA (Rüzgar Enerjisi Potansiyel Atlası), Available from: http://www.eie.gov.tr.
Sağır, Hayriye. "Enerji Sorunu, Çevre Ve Alternatif Enerji Kaynakları M. Akif Çukurçayır." (2007).
TEİAŞ, Türkiye Elektrik Üretim - İletim İstatistikleri, 2016
TÜİK (Türkiye İstatistik Kurumu) Seçilmiş göstergelerle Iğdır, 2013
Uluatam E., “Türkiye'de Hidroelektrik Politikaları Ve Yatırımlarına Bakış” Ekonomik Forum, Aralık 2011
YEGM Tarafından Mühendislik Hizmetleri Yürütülen Hidroelektrik Santral Projeleri, 2016, Available from: http://www.eie.gov.tr/HES/index.aspx
Yeşil, M.A., “TRA2 Bölgesi Yeşil Enerji Kaynakları Sektör Raporu”, Serhat Kalkınma Ajansı, Ocak 2015.