PREDICTING BODY WEIGHT FROM BODY AND TESTICULAR CHARACTERISTICS
OF BALOCHI MALE SHEEP IN PAKISTAN USING DIFFERENT STATISTICAL
ANALYSES
M. Jahan, M. M. Tariq*, M. A. Kakar**, E. Eyduran***and A. Waheed****
Livestock and Dairy Development Department Balochistan, Quetta, Pakistan
*Center for Advanced Studies in Vaccinology and Biotechnology (CASVAB), University of Balochistan, Quetta, Balochistan, Pakistan. **Balochistan University of Information Technology, Engineering and Management Science, Quetta
***Biometry Genetics Unit, Department of Animal Science, Faculty of Agriculture, Iğdır University, 76000, Iğdır-Turkiye. ****Faculty of Veterinary Sciences, Bahauddin Zakariya University, Multan, Pakistan
Mohammad tariq <[email protected]>;
ABSTRACT
The aim of this study was to determine the suitable statistical analysis for the prediction of body weight from biometrical and testicular traits in Balochi male sheep. For this aim, statistical performances of Stepwise Regression Analysis, use of factor analysis scores with multiple regression model analysis and Ridge Regression analysis were evaluated on data of 131 Balochi male sheep. The measured characteristics were: body weight (BW), testicular length (TL), scrotal length (SL), scrotal circumference (SC), body length (BL), withers height (WH) and heart girth (HG). In order to determine the best model, determination coefficient (R2%), Root of Mean Square Error (RMSE) and Variance Inflation Factor (VIF)
values were used. Stepwise Regression and Ridge Regression analyses produced multicollinearity problem due to high VIF and RMSE values. In comparison with these two analyses, use of factor analysis scores with multiple regression model analysis offering optimal solution with very low VIF and RMSE values was adopted for the prediction of body weight of the Balochi male sheep. In the factor analysis, the 3 new-uncorrelated variables derived from eight explanatory variables were used as explanatory variables with the multiple regression analysis. Results reflected without multicollinearity problem that 91.1 % of variation in body weight was perfectly explained by the 3 new uncorrelated variables.
Key words: Balochi Sheep, Factor Analysis, Ridge Regression, Multicollinearity, Multiple Regression, Stepwise Regression.
INTRODUCTION
Sheep, which is one of small ruminants that have a high adaptability against harsh climatic conditions in Pakistan, plays an essential role in the improvement of rural economy (Tariq et al., 2011; Sharif et al., 2011). Among indigenous sheep breeds, Balochi sheep is a fat-tail breed, well adapted to a wide range of harsh environmental conditions in the Eastern Iran and Balochistan, Pakistan. The population (3.73 million) of this breed is higher than other indigenous breeds (Beverigh, 1.65, Harnai, 0.55 and Rakhshani, 0.04 million) in the Balochistan province (GOP 2006). While concentration of Balochi sheep is found in Kalat and part of Quetta division, a thin population is present in larger part of the Balochistan province. Balochi sheep, with white body and black, brown, or spotted muzzle and legs, are medium in size, adult male and female weighing 37 and 32 kg, respectively. The male has a slightly Roman nose and horns (Khan and Isani, 1994). The fleece is white with pigmented head and legs. The wool is coarse with modulation (Hasnain, 1985; Sharif et al., 2011).
In sheep, rams constituting important part of the flock are considered as half of the flock. Therefore, selection of sire with superior genetic characteristics is remarkably imperative (Lunstra et al., 1993). Among significant testicular characteristics; testicular diameter, testicular length, scrotal circumference, and scrotal length are taken notice as indirect selection criteria for genetically improving fertility in the sheep (Koyuncu et al., 2005). In sheep breeding, reproductive performance is the key factor relating to profitability (Bilgin et al., 2004). Information on fattening and growth-development performance together with reproductive performance is important not only for identifying breed traits but also for developing beneficial selection strategies in an effort to choice superior animals genetically in a flock.
Investigation of relationship of body weight with biometrical traits has an increasing importance for more effective selection and reproduction of sheep that have the best performance in body weight in terms of selection strategies. In this context, bivariate relationships between trait pairs of the accentuated target trait (body weight) and other quantitative traits are quite simply described by Pearson’s correlation coefficient (Afolayan et.al., 2006). ISSN: 1018-7081
In general, a widely accepted modeling to define variability in the main trait as a response variable via influencer traits as independent variables more than one is a multiple linear regression analysis, which aims to practically predict difficult measurable target trait from easily measurable traits, but it can produce untrustingly parameter estimates (Eyduran et.al., 2009; Tariq et.al., 2012a). Similarly, Ridge regression analysis is a helpful tool to overcome some deficiencies of multiple linear regression analysis in the appearance of multicollinearity problem due to strongly bivariate-correlations between independent variables. In attempt to satisfy the multicollinearity problem and to biologically interpret more trustworthy, a combination of univariate and multivariate analysis techniques (Factor or Principle Component analysis with multiple linear regression analysis) can be a suggestible approach (Eyduran et al., 2009).
In the different sheep breeds, there have been a great number of studies on body weight estimation from morphological traits (Keskin et al., 2007a; Keskin et al., 2007b; Cankaya et al., 2009; Ogah et al., 2009; Sangun et al., 2009; Yakubu et al., 2009; Eyduran et al., 2009; Eyduran et al., 2010). To our knowledge, there is no published documentation on the prediction of body weight of the Balochi sheep from several biometrical traits with the help of the combined statistical technique, on the use of factor analysis scores together with multiple regression model analysis. Hence, the current paper targeted to develop a functional model for predicting body weight using different biometrical traits viz. scrotal circumference, scrotal length, testicular length, body length, withers height and heart girth for indigenous Balochi sheep, which occupy a significant place in rural economy of the Pakistan. With the purpose of obtaining the best functional model, statistical performances of Stepwise Regression Analysis, use of factor analysis scores with multiple regression model analysis, and Ridge Regression analysis were compared each other.
MATERIALS AND METHODS
Animal Data: In the current study, 131 male sheep of indigenous Balochi breed at different ages (1stgroup=2-7months, 2nd group=8-13, 3rd group= 14-19 and 4th
group= 20 and above) were kept at government livestock farm and private sheep flocks at district Mastung, Usta Mohammad and Quetta. Scrotal circumference, scrotal length, testicular length, body length, withers height; heart girth and live body weight were measured using tailor tape and weigh balance.
Statistical Analysis
Stepwise Regression Analysis: Multiple Linear Regression Analysis were used with the aim of predicting body weight as a target variable from a set of explanatory
variables viz. scrotal circumference, scrotal length, testicular length, body length, withers height and heart girth in the Balochi male sheep. For this purpose multiple linear regression analysis model (Erturk and Tatlidil, 2010) was employed given as under:
BW = a + b1SC + b2SL + b3TL + b4BL + b5WH + b6HG + e
Where a, intercept term; b1, b2, b3, b4, b5, and
b6 are regression coefficients of scrotal circumference,
scrotal length, testicular length, body length, withers height and heart girth, respectively and e is the error term. The significance control for each of regression coefficients (intercept and slopes) were performed using a t-statistic. The eligibility of the multiple regression analysis was detected by the coefficient of determination (R2) and Root of Mean Square Error (RMSE) (Tariq et
al., 2012b). In the result of Stepwise regression analysis, statistically significant variables were included in the model.
Variance Inflation Factor (VIF) was also used to determine the existence of multicollinearity and its upper limit for a reliable statistical analysis is 10 in a multiple regression analysis.
Use of Factor Analysis Scores in the Multiple Linear Regression Analysis: The basic factor analysis equation can be written in matrix form: Z = F +
Where Z is a px1 vector of variables, is a pxm matrix of factor loadings, F is an mx1 vector of factors and is a px1 vector of error or residual factors (Sharma, 1996). By reason of the differences in the units of variables for factor analysis, the variables were standardized and eigen values were calculated by a correlation matrix of variables. VARIMAX rotation was used for facilitating interpretation of factor loadings (Lik)
(Yilmaz et.al., 2011). Factor coefficients (Cik) were used
to get factor scores for the selected factors in the factor analysis. Factors with eigen values greater than 1 were considered as new explanatory variables in multiple regression analysis (Tabachnick and Fidell, 2001).
Score values in relation to the extracted factors were used as new explanatory variables. The multiple linear regression equation for fitting standardized body weight and the factor score equation are expressed below: BW = a + b1FS1+ b2FS2+ b3FS3+ e
Where a, intercept (with a value of zero); b1, b2
and b3are regression coefficients of Factor Scores. FS is
the factor score and e is the error (residual) term. The individually significance control for each of regression coefficients (intercept and slopes) was performed using a t-statistic. The eligibility of the multiple regression analysis was detected by the coefficient of determination (R2) and Root of Mean Square Error (RMSE) (Eyduran el
al., 2009; Sakar et al., 2011).
Variance Inflation Factor (VIF) is one of the collinearity diagnostics giving information about level of multicollinearity and its upper limit is 10 in a multiple
regression analysis (Karakus et al., 2010). In the statistical analyses, MINITAB program was used. (www.minitab.com).
Ridge Regression Analysis: In ridge regression analysis, the cross-product matrix for the explanatory variables (scrotal circumference, scrotal length, testicular length, body length, withers height and heart girth) is centered and scaled to one on the diagonal elements. The ridge constant k is then added to each diagonal element of the cross-product matrix. The ridge regression estimates for each explanatory variable are the least squares estimates obtained by using the new cross-product matrix.
Let X be an matrix of the explanatory variables after centering the data, and let Y be an vector corresponding to the target (dependent) variable. Let D be a diagonal matrix with diagonal elements as in . The ridge regression estimate corresponding to the ridge constant can be computed as
where and is a identity matrix.
http://support.sas.com/documentation/cdl/en/statug/63033 /HTML/default/viewer.htm#statug_reg_sect040.htm
RESULTS AND DISCUSSION
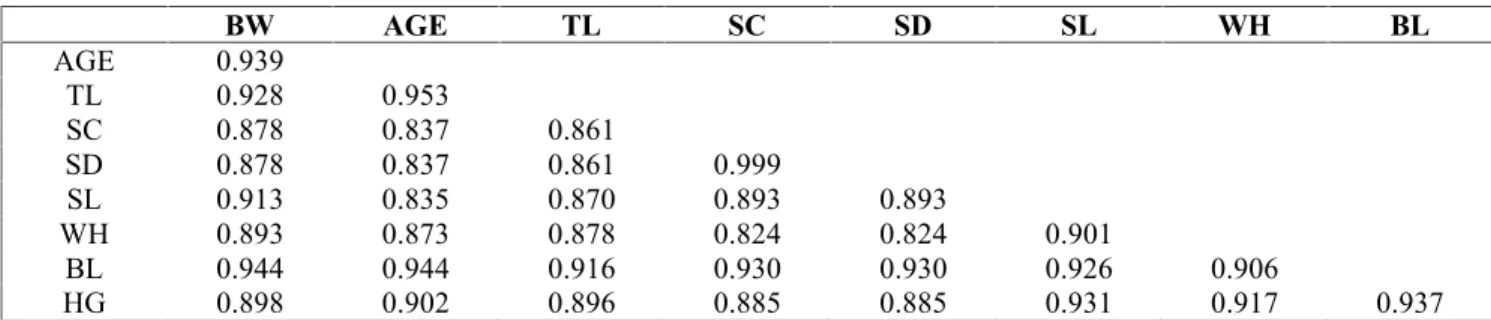
Pearson’s correlation coefficients among all biometrical characteristics obtained for Balochi male sheep in Pakistan are given in Table 1. Very strong correlations between these biometrical traits (P < 0.01) and their respective correlation coefficients were statistically significant. The high correlation coefficients led to multicollinearity and produced large standard errors of regression coefficients in the multiple linear regression analysis.
Table 1: Pearson’s correlation coefficients among all biometrical characteristics of Balochi male sheep
BW AGE TL SC SD SL WH BL AGE 0.939 TL 0.928 0.953 SC 0.878 0.837 0.861 SD 0.878 0.837 0.861 0.999 SL 0.913 0.835 0.870 0.893 0.893 WH 0.893 0.873 0.878 0.824 0.824 0.901 BL 0.944 0.944 0.916 0.930 0.930 0.926 0.906 HG 0.898 0.902 0.896 0.885 0.885 0.931 0.917 0.937
All the coefficients were significant (P<0.01).
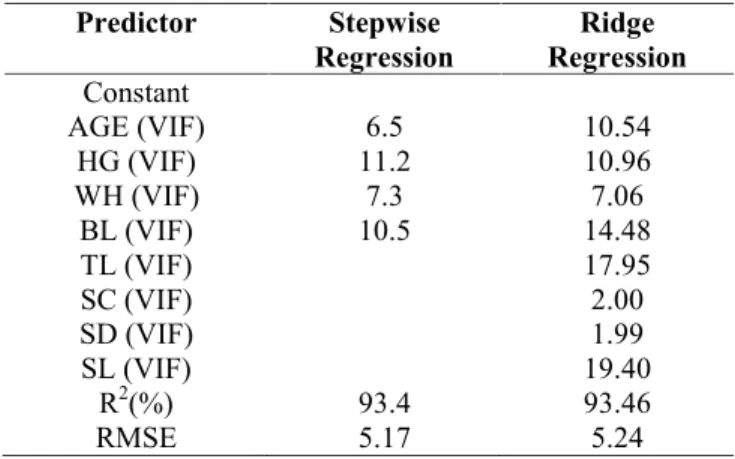
Multicollinearity results of Stepwise Regression and Ridge Regression analyses are given in Table 2. The stepwise regression model and Ridge regression analyses revealed multicollinearity problem with VIF values greater than 10 as a result of very high correlations among traits included in the model. Stepwise regression analysis reflected that age (P < 0.01), heart girth (P < 0.05), withers height (P < 0.05), and body length (P < 0.01) with 93.4 R2 % and S= 5.16661 (RMSE) were
statistically significant explanatory variables included in the model (Table 2). Of total variation in body weight, 93.4 % was explained by age, heart girth, height at withers and body length in the stepwise regression model. VIF values obtained for age, heart girth, height at withers and body length were found 6.5, 11.2, 7.3 and 10.5 respectively. In the Ridge regression analysis, VIF values ranged from 1.99 to 19.40, most of which were greater than 10.
In the circumstances, Stepwise Regression and Ridge Regression Analyses due to high VIF values could not provide an optimal solution for eliminating multicollinearity problem. As an alternative to both analyses, jointly using of factor analysis scores in
multiple linear regression were adopted and elaborated for the current data as recommended by previous authors (Keskin et al., 2007a; Keskin et al., 2007b; Cankaya et al., 2009; Ogah et al., 2009; Yakubu et al., 2009; Eyduran et al., 2009; Eyduran et al., 2010; Tariq et al., 2012b). For removing multicollinearity problem, factor score analysis was primarily applied on these explanatory variables using VARIMAX rotation and then new uncorrelated variables were derived from the explanatory variables. For successfully predicting total variation in body weight of the Balochi male sheep, these derived new uncorrelated variables were included in the multiple linear regression model. At first stage, results of factor analysis are given in Table 3. Number of factor suitable for factor analysis was determined to be three in the current work. In the present data, the explained variation which was 97.4% of total variation was explained by Factors 1, 2, and 3 with 36.3%, 34.8%, and 26.2% variability, respectively. Extremely high communality values with a narrow range from 0.950 to 0.997 were obtained in the factor analysis. High factor loadings are desirable. Among explanatory variables, SD (0.830), SC (0.830), and BL (0.633) made greater contribution to
Factor 1 than other variables. TL (-0.772), AGE (-0.772), and SL (-0.691) were the variables that significantly contributed to Factor 2. Similarly, WH (0.762) and HG (0.630) variables provided more contribution to Factor 3 in comparison with other explanatory variables.
Table 2: Multicollinearity Results of Stepwise Regression and Ridge Regression Analyses
Predictor Stepwise
Regression RegressionRidge Constant AGE (VIF) 6.5 10.54 HG (VIF) 11.2 10.96 WH (VIF) 7.3 7.06 BL (VIF) 10.5 14.48 TL (VIF) 17.95 SC (VIF) 2.00 SD (VIF) 1.99 SL (VIF) 19.40 R2(%) 93.4 93.46 RMSE 5.17 5.24
Table 3: Results of Factor analysis for explanatory variables
Var Factor1 Factor2 Factor3 Commun ality SD 0.830 -0.419 0.364 0.997 SC 0.830 -0.419 0.364 0.997 BL 0.633 -0.520 0.536 0.958 TL 0.470 -0.772 0.405 0.981 AGE 0.425 -0.772 0.434 0.965 SL 0.523 -0.691 0.466 0.968 WH 0.410 -0.479 0.762 0.978 HG 0.535 -0.516 0.630 0.950 Variance 2.9078 2.7868 2.0997 7.7942 % Var 36.3 34.8 26.2 97.4
Factor Score Coefficients Variable Factor1 Factor2 Factor3
AGE -0.368 -0.967 -0.439 TL -0.243 -0.989 -0.609 SC 0.883 0.345 -0.609 SD 0.884 0.346 -0.388 SL 0.123 -0.553 -0.239 WH -0.475 0.633 1.540 BL 0.191 0.227 0.296 HG 0.109 0.353 0.792
Sorted Rotated Factor Loadings and Communalities
The new uncorrelated variables (FS1, FS2, and FS3) obtained from factor analysis were included as new explanatory variables in the multiple linear regression analysis (Table 4). In the regression equation given as
BW = 0.526*FS1 – 0.629*FS2 + 0.489*FS3 with the
determination coefficient of 91.1%, these three new variables were found to be significant (P < 0.01) contributors. Compared with stepwise regression and Ridge Regression analyses in terms of VIF values, the use of the Factor Analysis Scores presented the ideal and lowest VIF values, meaning definitely elimination of multicollinearity problem. On the basis of the use of the Factor Analysis Scores, weight of Balochi male sheep is a function of the respective values of AGE, TL, SC, SD, SL, WH, BL, and HG.
Comparing the three analyses, the best choice with the lowest RMSE and VIF values, the Factor Analysis Scores in the multiple linear regression analysis is more valid. Present finding are in complete agreement with the previous findings by other researchers, which reflected elimination of multicollinearity problem due to the use of the factor analysis scores in the multiple linear regression analysis (Keskin et al., 2007a; Keskin et al., 2007b; Cankaya et al., 2009; Ogah et al., 2009; Sangun et al., 2009; Yakubu et al., 2009; Eyduran et al., 2009; Eyduran et al., 2010; Eyduran et .al., 2012).
Present R2 value (91.1%) was higher as
compared with those reported in the previous studies (Keskin et al., 2007a; Keskin et al., 2007b; Cankaya et al., 2009; Ogah et al., 2009; Yakubu et al., 2009; Eyduran et al., 2009; Eyduran et al., 2010) with exception of Sangun et al., (2009) who reported R2 =
98.4% value closer to those found in this study. The differences might be ascribed to different breeds, different species, type and number of traits, sample size, and various statistical analysis techniques.
In literature, the current paper was the first study on body weight prediction without multicollinearity problem from body and testicular measurements of Balochi male sheep with the use of the factor analysis scores in the multiple linear regression analysis with BW = 0.526 FS1 – 0.629 FS2 + 0.489 FS3.
Table 4: Results of Multiple linear Regression analysis for Factor scores
Predict Coef SE Coef t P VIF FS1 0.5258 0.02643 19.89 0.000 1.0 FS2 -0.6294 0.02643 23.81 0.000 1.01 FS3 0.48856 0.02643 18.48 0.000 1.0 S(RMSE) = 0.3014 R2= 91.1%
Conclusion: With the aim of trying to get the best model, Stepwise Regression Analysis, use of Factor Analysis Scores with multiple regression model analysis, and Ridge Regression analysis were compared. With respect to eliminate remove the multicollinearity problem, use of Factor Analysis Scores in multiple regression model analysis offered more successful solutions compared with
Stepwise Regression Analysis and Ridge Regression analysis as indicated by VIF and RMSE values. Results with use of Factor Analysis Scores reflected body weight could increase with the increase in biometrical traits in the current work.
REFERENCES
Afolayan, R. A., I. A. Adeyinka and C. A. M. Lakpini (2006). The estimation of live weight from body meauserements in Yankasa sheep. Czech J. Anim. Sci., 51: 343-348
Bilgin, O. C., E. Emsen and M. H. Davis. (2004). Comparison of non-linear models for describing the growth of scrotal circumference in Awassi male lambs. Small Rumin. Res. . 52: 155-160. Blockey, M. A. (1980). Getting the most out of rams and
boars. Proc. Aust. Society Anim. Prod. 13:46. Cankaya, S., A. Altop, E. Kul and G. Erener (2009).
Body Weight Estimation In Karayaka Lambs By Using Factor Analysis Scores. Anadolu J. Agri. Sci. 24(2): 98-102.
Eyduran, E., K. Karakus, S. Karakus and F. Cengiz (2009). Usage of factor scores for determining relationships among body weight and body measurements. Bulg. J. Agri. Sci. 15: 374–378. Eyduran, E., M. Topal and A. Y. Sonmez. (2010). Use of
factor scores in multiple regression analysis for estimation of body weight by several body measurements in brown trouts (Salmo trutta fario). Intl. J. Agri. Biology.12: 611–615. Eyduran, E., M. Topal, A. Y. Sonmez and S. Keskin
(2012). Carcass weight estimation from some morphological traits of Capoeta capoeta capoeta (Güldenstädt, 1772) using factor scores in multiple regression analysis. Pakistan J. Statist. 28(1):159-165.
Erturk, Y. E. and F. Tatlidil (2010). The effect of the quality assurance systems certificates on the purchasing behaviors of consumers. 5th Central
European Congress on Food. 19th-22nd May
2010, Bratislava, Slovakia.
Government of Pakistan (GOP), (2006). Economical Survey of Pakistan, Islamabad.
Hasnain, H. U. (1985). Sheep and Goat in Pakistan. Animal Production and Health P. 56. FAO Rome.
Karakus, K., E. Eyduran, T. Aygun and K. Javed (2010). Appropriate growth model describing some testicular characteristics in Norduz male lambs. The J. Anim. Plant Sci. 20(1): 1-4.
Keskin S., A. Kor and S. Karaca (2007a). Use of factor analysis scores in multiple linear regression model for determining relationships between milk yield and some udder traits in Goats. J. App. Anim. Res., 31: 185-188.
Keskin S., I. Daskiran and A. Kor (2007b). Factor analysis scores in a multiple linear regression model for the prediction of carcass weight in Akkeci kids. J. App. Anim. Res., 31: 201-204. Khan B. B. and G. B. Isani (1994). Breeds and types of
livestock in Pakistan. Animal Husbandry (Book) published by National Book Foundation, pp 56-60.
Koyuncu, M., S. Kara Uzun, S. Ozis and S. Duru (2005). Development of testicular dimensions and size, and their relationship to age and body weight in growing. Kivircik (Western Thrace) ram lambs. Czech J. Anim. Sci., 50(6): 243-248.
Lunstra, D. D. and G. H. Coutler, (1993). Beef Research Progress Report No. 4. Roman L. Hruska US Meat Animal Research Center,Clay Center Nebraska.
MINITAB. www.minitab.com
Ogah, D.M., A.A. Alaga, and M.O. Momoh, (2009). Use of factor analysis scores in multiple regression model for estimation of body weight from some body measurement in Muscovy duck. Intl. J. Poult. Sci. 8(11): 1107-1111.
Sakar, E., S. Keskin and S. Unver (2011). Using of factor analysis scores in multiple linear regression model for prediction of kernel weight in Ankara walnuts. The J. Anim. Plant Sci., 21(2): 182-185.
Salhab, S. A., M. Zarkawi, M. F. Wardeh, M. R. Al-Masri and R. Kassem (2001). Development of Testicular Dimensions and Size, and Their Relationship to Age, Body Weight and ParentalSize in Growing Awassi Ram Lambs. Small Rumin. Res., 40: 187-191.
Sangun, L., S. Cankaya, G. T. Kayaalp and M. Akar (2009). Use of factor analysis scores in multiple regression models for estimation of body weight from some body measurements in Lizardfish. J. Anim. Vet. Advances. 8: 47–50.
Sharif, M. K., M. M. Tariq, A. Waheed, M. A. Bajwa, M. A. Awan, and M. A. Kakar (2011). Evaluation of economic traits of Balochi and Bibrik (Beverigh) sheep breeds of Balochistan Iğdır Uni. J. Institute of Sci.Tech., 1: 133-139. Sharma, S. (1996). Applied Multivariate Techniques.
John Wiley and Sons, Inc., New York.
Tabachnick, B. G. and L. S. Fidell (2001). Using Multivariate Statististics. Allyn and Bacon Pearson Education Company, Boston Massachusetts.
Tariq M. M., M. A. Bajwa, F. Abbas, E. Eyduran, M. A. Awan, M. Rafeeq, A. Waheed, A. Hussain, F. A. Bukhari, M. A. Attiq, Z. Ahmad and Y. Javed. (2011). Some Morphological, Fertility and Growth Traits for Mengali Sheep of Balochistan,
Pakistan. Iğdır Uni. J. Institute of Sci. Tech., 1(1): 63-68.
Tariq, M. M., M. Rafeeq, M. A. Bajwa, M. A. Awan, F. Abbas, A. Waheed, F. A. Bukhari and P. Akhtar (2012a). Prediction of body weight from body measurements using regression tree (RT) method for indigenous sheep breeds in Balochistan, Pakistan. The J. Anim. Plant Sci., 22(1):20-24.
Tariq, M.M., E. Eyduran, M.A. Bajwa, A. Waheed, F. Iqbal and Y. Javed, (2012b). Prediction of body weight from testicular and morphological characteristics in indigenous Mengali sheep of Pakistan: using factor analysis scores in multiple linear regression analysis. Int. J. Agric. Biol., 14: 590–594
Waheed, A., M. S. Khan, A. N. Ahmed, M. M. Tariq, M. Rauf E. Eyduran (2011). Relationships among testicular traits, body measurements and body weight in Beetal male goats in Pakistan. Iğdır Uni. J. Institute of Sci. Tech., 1(1):59-62. Yakubu, A. (2009). Fixing collinearity instability in the
estimation of body weight from morpho-biometrical traits of West African dwarf goats. Trakia J. Science. 7: 61-66.
Yilmaz, I., E. Eyduran, A. Kaygisiz and K. Javed (2011). Estimates of genetic parameters for lactation shape parameters with multivariate statistical technique in Brown Swiss cattle. Int. J. Agric. Biol., 13, 174-178.