One of the main determinants of the macroeconomic performance of any coun-try is the structure of the labor market. In particular the degree of “flexibility” of the labor market is one of the key determinants of the evolution of wage rates, employment, unemployment and hence competitiveness of the country. After considering the main characteristics of the Turkish labor market in Section 1, Section 2 studies labor market flexibility and Section 3 the labor market rules and regulations determined by the government. Section 4 deter-mines the size of the formal and informal sectors. Productivity, real wages, and unit labor costs in manufacturing are analysed in Section 5. The chapter con-cludes with a short assessment of labor market flexibility in Section 6.
1. Labor Market
Since demographic indicators have great importance for labor supply a brief review of these indicators is presented. The population of Turkey in 2000 was 65.3 million. The annual population growth rate, which was 2.52 percent dur-. ing the period 1965—1970, declined to 1.62 percent during 1995—2000. About 63 percent of the population was in the 15—64 year age group. Turkey has a very young population with a median age of 22.2 years. The dependency ratio,
defined as the number of people in the age group 0-14 and 65+ to every 100
persons in the age group 15—64 was 64.2 percent in 1990. Sharp decreases in crude birth and death rates and increase in the life expectancy at birth are observed. By 1995—2000 the birth rate, death rate, and life expectancy at birth were 2.14 percent, 0.65 percent and 68.55 years respectively.
Although population growth is expected to decline over time, annual addi-tions to the population in the near future will still be very significant, at an aver-age of one million persons per year. What this implies is that over time, Turkey must continuously create new jobs, implement basic infrastructural invest-ments, and provide education and health services to the growing population.
Over the past decade Turkey has had a very high urbanization rate. The urbanization rate, defined as the proportion of the population living in places with 10,000 or more inhabitants, increased from 32.4 percent in 1970 to 70.6 percent in 2000. Internal migration,which dominates population dynamics of the country, is caused by many factors including regional income differences.
Subidey Togan .353 C ”323% 803* Emu «Emu C mutmtu~m\o 28.22: 23.0 62:00 :33 093%» .35.? Siam. 996k Baud 300330: $00.60 NEG NERVEU ~33; mMEQE mi 9 .60.? EuQ .632 m9: 0:: mo.3 OF»: 3.2 50.2 :42 5.3 8.2 3.2 00.9 0.2 3233 $50 0m.N hmd ovd SN 5:6. mmd «Nd Nvd wfim 0_.N Nm.N SUN moomfiom RESET— mm.m_ wmdg 00.2 0 _.v 85 vmé 00% 31V mo;V Mme hmé mmé :oumfloamc fib 34m 9.6 Kg“ flim— sNN— 9.9 3.29 mmdg 3.: Eu: 5.: NW: ova; 3.0 mad 0o.0 mad N00 a0.0 No.0 9.0 mm.m 0N0 ~00 mm.m :ocoEumcoU 26m Omdv 0N.ov mv.wm 38m No.wm mw.wm _w.mm ww.mm 50.0m $.mm oo.0m moumtom mmd mmd vmd Nvd N06 006 mmd mmd d mmd mmd 0m.o A925 3.3 5&0— hw fig 50.3 3.2 8.: 511 0.0— 0?: 9.: 0.}: £41 wctsuoflscmz _0.o mud 05.0 5.0 :6 0wd and cod wad No; cod vmg 9:52 2.: N52 3.: 3.2 2.2 0N.0_ N52 3.0— 3.2 00.2 3.2 3.2 $305 wbdv mV mv 059‘ 00.5» N59“ 3m? 53% NW? whfiv 3:? 3%: aha—sutm/x EB .00 82m 3 EoEoEu 5.530 mg. 50 0.0 v0 v.» m.w Wm Wm 0.w ow 5m 06 9x9 88 HEFF?EEMED m3: v9} 5m; mum; mmmJ am; 000; CR.— Nofifi mg; «mm; 90>; Soap EoEoEocD ~mo.mm ‘3m 500.3 395 0.2.5 hmmdm v3.3 3&2 03.2 mmmdfi $5.2 :d— Soc; Evie—ac; 5:35 a0.wv vowv wv 0m.mv 0060 00.00 flmdm whim Noam 0m.mm 34.0 0060 AK; 0:3 setup—Bram anhmm wVQmN mixmm Sang $0.3. wm_.NN o0v._m vow._N wmifi 0vo._N moohom Smdm Soop 088 50mm— omwdw owofiv oww.0v :wfiv :wxuv v2.9 Nn0nmv NmmJV mmvdv 0omdm 0.8.?” mNNKm B>o can 2 comm scam—25m aovcn0 0m0.m0 0mm.N0 90:0 3060 Nm0dw 30.3 2m mmvdm vomfim 9560 «£13 889 coca—anon 5:36 33 wam— E3— 023 022 33— 83 N93 33 ga— awm— mam.—
ESnuEE
«8:32
.593
:0
«ENE
208It is expected that with the completion of the South-Eastern Anatolian Project a major factor causing migration will be eliminated. In previous decades labor-supply trends were influenced by migration abroad. It has been emphasized that income differences between Turkey and EU countries were the major factors causing external migration. The flow of Turkish workers to Europe in the 19603 and 19705 came to an abrupt halt after the recession in Europe in the mid 1970's. In 1999, the number of workers and their dependents abroad amounted to 3.57 million, 1.18 million of which were workers.
One of the positive trends that has accompanied Turkey’s demographic transition is the increase in the working age population. Turkey’s population of aged 12 and over has increased from 37.2 million in 1988 to 48.8 million in 1999. Simultaneously, the labor force participation rate declined from 54.6 in 1988 to 48.7 percent in 1999. The decline in the participation rate is the result of growing educational involvement and change in the composition of labor force away from agriculture towards non-agricultural activities. By 1999 the labor force stands as shown in Table 6.1 at 23.8 million. The amount of employment generated by the economy has increased from 18.5 million in 1988 to 22 million people in 1999. By 1999 (1988) 45.8 (47.4) percent of the labor force was employed in agriculture, 14.1 (14.3) percent in manufacturing, 39.1 (36.9) percent in services and the unemployment rate was about 7.8 (9.5) percent.
In Turkey, agriculture has economy-wide importance. During 1998 it accounted for about 13.5 percent of GDP. The share has been falling over time, but compared to other countries the share is still relatively high. Table 6.2 reveals that value added per agricultural worker in Turkish agriculture amounts on average to only 23 percent of the value added per worker in manufacturing sector. Table 6.2 further reveals that employment (value added) in agriculture has increased from 8.96 million (12.64 billion TL) in 1980 to 10.1 million (15.4 billion TL) in 1999, that employment (value added) in agriculture on average has increased at an annual rate of 0.48 (1.27) percent, and that labor productivity in agriculture has increased by 0.8 percent. On the other hand, during 1998, industry accounted for 28 percent and services for 58.5 percent of GDP. As employment in industry (services) increased from 2.4 (5.2) million in 1980 to 3.3 (8.6) million in 1999, industrial value added (value added in services) increased from 11.2 (26.5) billion in 1980 to 31.8 (63) billion in 1999. As a result, labor productivity in industry (services) has increased at an annual rate of 3.6 (2.03) percent.
Su'bidey Togan 35.2 3%: 5...: 3a.: 215 5.8 25.2 $2. 5.2 an: ”3.2 :3: 83: $5.: Sn: 8:: 25.: 5.: 3...: an: .392. 82 $3 $3 :3 Ea SE 22 23 53 ”EN EA $3 83 $3 9.3 :3 so: 5.: on: :2 32.52.50 0% NE SW 3. :2. E. .3. ME. 5. ME. :3. as. 3:. gm 2% 5 SM mmm mm 02 32.52322; 3.3 83 9.3. am a.» .3 mg a: B» m; a a: E 3 n: so :5 9.0 as as cosgoacfi 8” w: a; £3 53 :3 2mm 3.: 8m.” RE :33 as...” 3.3 as: 85 85 .3: ma: :2 3} 2.5 N2: 32 :2 ma: :2: we: a: E: 9.3 33 3.3 08.: 8o: .8: a; N3 .8 ma .3 mg 55.528 83 83 we...” as... E: 9.5 3.: NS.“ 53 £3 3% 5.... £3 53 5mm 8% a? 5% 23 ~26 82.5w a. m: m: 8 8: z: x: S E 8 S S 3 E mm mm mm a 9. 3. 3.2: :2 :2 9.3 a} :5.” :3 8m.“ 33 £3 E.“ 33 3.0.“ “m3 Ea 9.3 on.“ 32 a3 8..” 83 3:23:52 5 m2 :2 E a: m: m: w: m: we a: as om on .8 8m 8. a: N: a: 9:52 3.2 29m $3 a} 83 22 2; £3 82 Boa as: 3.3 Eu...” E." MR.” as.” an“ 23 Sim 33 5%: 83: SN... 2....” 5:... «8.2 32 an.” E.” 5.... mm... 82 a; 8% 2m.” 5.” 83 a”: .8.” m3... 8% 2230:»... Sec. VEu fizo—nEm 8%: :3: 5.2. 9.5.... an; an; an: 5:3 mm...» ”5.8 3...; 8....2. an: “5.8 3:8 5.5 3.5.. 23m 3% 5.3 :fioy $2.2 33: ES 212 83.: 2a.: 26.2 8:: in: 8w: :2: ”3.2 ~32 9.3: end :3 $3 8: $3 £2 33% E5558 ma.” :3 93 as.” 5.” 5..” $3 $3 23 09..” 3: an.” ”a...” BS 83 as.” 2.3 83 m8: :2 32.2.: 33.: ”2.2 33.: 3...: :3: 3.: :5: 8%: 30.2 3:: Sod a; 83 on? $3 $5 2: :3 Em... RE SEEQEE ”8.9 SEN V8.2 3.2 and” “3.: “5.: 8a.: 8.3: as: to: 02.2 5.: 02.: .8: E: 02.2 :3. 805 an.” 2.3 0:.“ 83 :3 8% 5% 33 NR... E.“ E...“ 5..“ 3..“ a} a} 2.5. 23. GE 3% 8w.” 3% Sea . 822528 55.2 94.3 $3... 22% St? warm 3%? atom 32:. 8.5. ”3.? 3.9. 3.9. an: ”2.2 3...: was :3 233 $12 3238 £2 £2 £2 a; 23 osd $3 $2 :2 82 $2 08.: a} 5:... mm: a: 8m 0% “3 m: 2282”: $3; 83: mag 93.: :32 Sam 02.3 :38 :2: a5: 08.: :3: an: 5.: 2m: 30.: as: 3.2 $2: $2 @5325: 83. 85 as: $2 an: 9...: an: .8: OS: on“: 82 55 m5: 3.: mm: 5: as: N:._ we: :8: was: v5.5 at? and 2.2% 8:: 35A 08.8 $3.” 83m .83” $2“ :3: 05: so: 8a.: 3.: 3...: 53 «2.: 5.: 9.2.5 8...: 312 Sq: 33.2 9.9: $3; 8}: 5.: 9.3.: E: E: on: :2: mm: $0.: 5.: $3: 3:: an: 98.2 223:? 93.: 52 .d. 55:: 32:. 2:...» a: :2. a: a: a: 3.: a: a: a: a: $2 $3 5.: £2 £2 a: 8.: a: :2: 8.:
33.262:
2:..5533:
.33....
22...»
”S
2.3.
210in Turkey Labor Market F lexibili .QEREuEAoEEu 8 ES. 335 we? MERE: 3 353% E: 2% Qatawfim .632 .359... 32:: b.8335? $5.55 38m. 3355 \o «033m; E8335 ..3.So.w 211 Eoow :hm fi awvfim 336 33.». owned $.56 nNNmé $.54. mmnmé 58.». 3:6 88.”. as: $.36 Svmd tuna amvud ave—.m 3.36 43.0% _~_m.m mtvd 3.2% 336 mmwow 88+ 336 03:. 256 #33. 3.3;. 35v 0256 8—3. $56 an; moo—é 0:3” vomoé mmooé 33.5w EcsEEoU $a .326 Snood 33% 3.3;. $86 ommmw mam—.m Emma 23% omvmw 50%.». mommd cmwm fi 2.a Sham 336 good :mvw $36 3655; 3.36 mmmmfi cmoow $3.2 33.3 53.2 32.2 m_¢m.m_ 03E: 32.2 83.2 22...: 52“.: 33.2 93.2 32”.: 33.2 33.2 mmmod Emma countoamcfih moomsm :ovdm Noemdm :Bmd v2.0.5 22; Emmd 3v 73.2. 95.5 32.5 fioms Gems momma mbmod ”~36 83.0 wnofio 33%. 236 owe... meow;q $26 woo—6 cmomé Emmi So fim 2.36 526 ~mmm.m mvmmd mean $86 33% mmmmi vvomé nomad mmmm; 2N; 59am 832m 552550 $02. $36 Smog. oflms mmoos 3.3.6 202. mound mmood moved emvmd ohm—.0 oommé hmvad 35% 82am mmwmfi mmmmfi ommmfi 82% 323% mmvmfiv .vwmdm mmdm omvmdm mmgdm oowfiom enmndm mammém ovmoam mmmndm Snows“ 23.2” SEEN 83.2.. 83.8 mmoodm 3%.: Bow: mmmndmomvodm bfiEuo—m mmmm.m. momvfi Emma can»: mamas 53.50 mvmns :unmd nmmhé 3.8.0 $2.0 oommd 3.3.0 33% momvfi mama $.36 :34. mnooé $26 wctauflscaz 23.2 3%.: E_N.o_ $56 22.6— 2”d 3.46.2 vmfld Sums.» $m New; 5.3.0 3:3 336 mica mmmefi mmmm.m ombofi omhnfi :m~.m mEEE
Subidey Togan
2. Labor Market Flexibility
Flexibility in the labor market refers to the ease with which employment and wages adjust, usually downward to disequilibria, in the labor market. Economists distinguish between numerical and financial flexibility, where numerical flexibility refers to the adjustment in employment, hours of work,
and financial flexibility to the pay adjustment in response to changes in
prod-uct markets and profitability.
The flexibility of labor markets is a major determinant of the economy’s
ability to adjust to external shocks without creating unemployment in the econ-omy. As shown in Togan (2000), the Turkish labor market is extremely flexi-ble. The reason behind the flexibility lies in the fact that the labor market is not homogeneous. It has different wage-setting mechanisms in formal and infor-mal sectors. The inforinfor-mal sector is largely free from most type of labor regu-lation and does not pay most of the taxes and related charges. Activities in this sector rely mostly on provision of labor services without formal employment contracts. Job insecurity is pervasive and workers get very few benefits from their employers. Since wages in the informal sector are determined by demand and supply conditions, the informal sector is flexible. Labor regulations are observed by the formal sector which pays all taxes and related charges such as social security contributions and payments to various funds. Thus, this sector is not as flexible as the informal sector.
Although the informal economy is universal it has a relatively larger share in Turkey and this share has been increasing. The main reason for the rise of infor-mal economy in Turkey is the fact that the government imposes excessive taxes and regulations, but does not enforce compliance. In Turkey, economic units choose to be partially or completely informal by weighing the costs and benefits a legal status entails. In this sense, the choice to be informal is a rational one.
Before studying the labor market flexibility in Turkey in more detail let us
turn to a theoretical explanation of the rationality of being informal. For this purpose we follow the approach of Squire and Suthiwart-Narueput (1997) and
consider an economy with n firms. Let F(K,, L) be the production function of
the i-th firm where K, denotes capital and L, labor employed by the firm, and
F is assumed to be twice differentiable, increasing, and strictly concave. Let 0, represent the talent of enterpreneur i, where 0. is drawn from a cumulative dis-tribution G(0.). Considering the enterprenerial technology to be separate from production technology, so that 0. behaves as a shift parameter to the
produc-tion funcproduc-tion F(K,, L.), we represent the output offirm i managed by an
enter-preneur with talent 0. by 0. F(K,, Li).
Let p be the price of product, w the wage rate and r the rental rate of capi-tal. The profit maximizing firm chooses the amounts of labor and capital satisfying the condition:
Hi(9,, w, r) = maks [p 6, F(Ki, L.) — wLi — rKi]
Ki) Li
The firm is supposed to face the wage rate in the informal economy w, and
the wage rate in the formal'economy w*, where w* is assumed to be larger than w. Let B be the probability of being inspected by regulators and let P be
the fine the firm has to pay if on inspection it is found to employ labor at the
wage rate w.
Let Hi(6,, w*, r) be the expected profit ofthe firm when the firm complies with the regulations, and let:
(1 - B) Hi(6i, w, r) + B {H.(Gi, w*, r) - 1"}
be the expected profit of a firm that does not comply with the regulations. Squire and Suthiwart-Narueput (1997) assume that B is an increasing function
of firm size and that firm size is an increasing function of the productivity
parameter 9.. Then B is an increasing function of 9, shown by the relation B(9.).
Similarly, the authors assume that fine F is an increasing function of the
pro-ductivity parameter 6. shown by the relation l“(6i).
Since the profit when the firm does not comply with the regulations is I'Ii(6i, w, r), and profit when the firm complies with the regulations is Hi(6i, w*, r), the difference between the profits can be taken as the cost of complying with the regulations. Hence we obtain from the above relations:
> meme.)
(145(91)
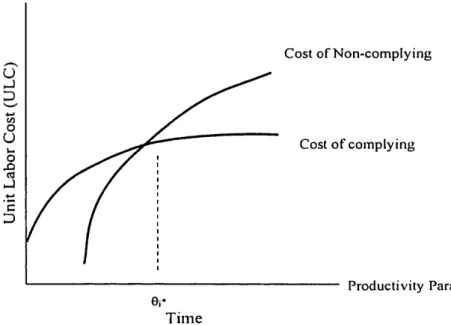
The left side of equation (1) shows the cost of complying and the right side of equation (1) cost of non-complying with the regulations. The authors using the envelope theorem show that the left side, the cost of complying, is an increasing fiJnction of the productivity parameter 9, as shown in Figure 6.1. Similarly the right hand side, the cost of non-complying, is an increasing function of the pro-ductivity parameter 6. as shown again in Figure 6.1.
Suppose that the cost of non-complying intersects the cost of complying
from below. Let 91* be the firm size for which the cost of complying equals
cost of non-complying. Then for 9. < 9.* the cost of complying exceeds cost of non-complying, and for 9, > 9,* the cost non-complying exceeds cost of
complying. Thus the firm will comply for 6, > 91* , and will not comply with
regulations for 9, < 93“. Furthermore, Squire and Suthiwart-Narueput (1997) show that an increase in either B or F shifts cost of the non-Compliance curve to the left, causing a decrease in 61*. Finally, an increase in w* leads to an out-ward shift ofthe cost of complying to the regulations. As a result the increase
in w* leads to an increase in 93*. From these considerations it follows that:
Sz'lbidey Togan
o It is advantageous for large firms to comply with regulations, and it is
advantageous for small firms not to comply with regulations.
0 A relative increase in w*, the wage rate in the formal economy relative to
the wage rate in the informal economy, causes a larger number of firms not to comply to the regulations.
0 An increase in B, the probability of getting inspected by the regulators,
causes a larger number of firms to comply to the regulations.
0 An increase in 1", the fine the firm has to pay if found to employ labor at the
wage rate w, causes a larger number of firms to comply to the regulations. Figure 6.1: Cost of Complying and Non-complying
Cost of Non-complying Cost of complying Unit Labor Cost (ULC) Productivity Parameter 6' Time
Thus, according to Squire and Suthiwart-Narueput (1997), the main factors
determining the size of the informal economy can be summarized under four
headings: (i) size of the firm, (ii) the ratio of the wage rate in the formal
econ-omy to the wage rate in the informal econecon-omy, (iii) the probability of getting
inspected by the regulators, (iv) the fine the firm has to pay if it is found to
employ labor at the informal economy’s wage rate. Employment in the
infor-mal sector increases as the size offirms decreases in the economy and/or as the
ratio of the wage rate in the formal economy relative to the wage rate in the informal economy increases. On the other hand, as the regulatory authority increases the inspection resources and/or increases the efficiency of
inspec-tion, and/or the fine the firm has to pay if found guilty, the size ofthe informal
sector decreases.
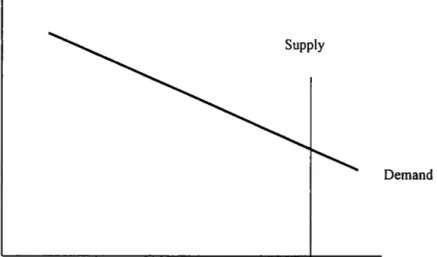
Let us now turn briefly to consideration of the macroeeconomic effects of regulation. Consider an economy composed of formal and informal labor markets. Figure 6.2a shows the demand and supply schedules in the formal labor market, where the vertical axis measures the real wage rate and the
horizontal axis the employment in the formal labor market. Suppose that for
every TL of wages, the firm must pay in addition, a fraction f in taxes and
fringe benefits. Then the cost to the firm of an additional unit of labor is (1+f)w*. Let MPL be the downward sloping marginal product of labor sched-ule showing how much extra output one can get for a marginal one unit increase in labor input. The optimality condition for a profit maximizing firm becomes p MPL = (1+f) w* where p stands for the price of output. Writing the marginal condition as [MPL/(1+D] = (w*/p) we note that an increase in the tax rate ‘f’ leads to a downward (leftward) shift of the labor' demand schedule.
Let S graph the quantity of labor supplied at an after tax real wage of (H) (w*/p) where t denotes the tax rate to be paid by the workers. Given the tax rate ‘t’ we assume that the labor supply is perfectly elastic at the after-tax real wage rate prevailing in the formal labor market. We note that an increase in the tax rate ‘t’ induces an upward shift in the labor supply schedule.
Given the values of the parameters (f, t), the employment in the formal labor market is determined by the intersection of demand and supply sched-ules in Figure 6.2a. From the total labor supply we subtract the employment in the formal market and obtain the labor supply in the informal labor market. Given the demand for informal labor shown in Figure 6.2b, the intersection of the demand and supply schedules in the informal market determines the wage rate and employment level in the informal market.
Consider now an increase in ‘f’ due for example higher social security contributions or higher taxes in the formal labor market. The increase in ‘f’ shifts the demand curve for labor in the formal market to the left. As a result, employment in the formal market decreases. This leads to an increase in the
supply of labor in the informal labor market causing a decrease in the
equi-librium wage rate of the informal labor. On the other hand, an increase in the tax rate ‘t’ causes an upward shift of the labor supply schedule in the formal market. This causes a decrease in employment in the formal sector, a right-ward shift of the supply curve in the informal market, and hence a decrease in the wage rate in the informal sector.
The above considerations reveal that the tax parameters ‘f’ and ‘t’ are of
importance for the analysis of labor market flexibility. An increase in ‘f’ or ‘t’
leads to a decrease in employment in the formal sector, and to an increase in the employment level and a decrease in wage rate in the informal sector. Hence equilibrium in the labor market is attained by adjustments in wages and
employment of the flexible informal labor market.
Starting from a situation where the wage in the formal sector, w*, is substantially higher than the wage in the informal sector, w, we note that labor
market flexibility in the economy can be increased by decreasing the values
Sz'lbidey Togan
Figure 6.2a: Labor Market Equilibrium
Real wage in the regulated
Supply
Demand
Employment in regulated sector
Figure 6.2b: Labor Market Equilibrium
Real Wage in the Regulated sector Supply
\
DemandEmployment in the unregulated sector
Alternatively, labor market flexibility can also be increased by increasing
the values of ‘f’ and ‘t’, but by not enforcing the rules on all economic units in the economy. But lax enforcement of the laws may create different problems for the society. In this case, the economic units may start to take it for granted that they can avoid the rule of law.
3. Labor Market Rules and Regulations in Turkey
The labor market rules and regulations summarized below concern the formal sector and they are analyzed under the headings of system of taxation,
mini-mum wages, social safety net and social security systems, and labor market
System of Taxation. The legal framework governing the taxation of per-sonal income is provided by the Income Tax Code (Statute 193). Wage and salary income is defined very broadly to include the cash value of virtually anything (including all benefits) that an employer provides to his/her employ-ees as a result of their employment. Employemploy-ees take a personal exemption. Premiums paid for personal insurance purchased from companies in Turkey are deductible provided that the amount deducted does not exceed the amount that the employee pays as his share of social security. Employer-provided sev-erance pay and marriage allowances are also tax free, subject to certain condi-tions. Personal income tax rates vary between 15 and 40 percent depending on the size of taxable income.
The Social Security Law requires that employers and employees contribute
by premiums to the financing of social security institutions. Since services
pro-vided by the Social Insurance Institution do not in general meet the demand, employers have been forced to insure employees through private retirement and health insurance companies. This has further raised the premiums paid by the employers.
According to Law No. 3289 on the ‘Establishment of the General
Directorate for Youth and Sports’ all firms employing more than 500 workers
are required to have sporting facilities. Firms not fulfilling this condition are fined, and the fine amounts to one third of each worker’s gross salary
multi-plied by the trial number of employees. The fine has to be deposited to the
Turkish Sport Incentive Fund.
Minimum Wages. Article 33 of Labor Law No. 1475 specifies that mini-mum wages be determined at least every two years by a committee compris-ing representatives from trade unions, employers, and the government. In prac-tice, minimum wages are determined annually with adjustments every six
months. Previously separate minimum wage rates were determined for
differ-ent regions and sectors. Since January 1, 1989 the same minimum wage has been applied to all sectors and regions, with lower wages only for workers younger than sixteen years old. The statutory minimum wage is binding across the economy, work status, or contractual relationship with the employer. Unfortunately, there are no reliable data on the coverage of minimum wage. It is claimed that in a number of small establishments a large number of workers who are registered as minimum-wage earners receive substantially higher wages. The workers are registered as minimum-wage earners in order to min-imize the tax and social security contributions. Finally, it should be empha-sized that lax enforcement of the law provides incentives to evade the law.
Social safety Nets and Social Security System. In Turkey there has been no unemployment insurance until very recently. On September 8, 1999 the Turkish government enacted new social security reform bill which introduced unemployment insurance. It became compulsory for all members of the social
Sabidey Togan
security institutions from June 1, 2000. With the introduction of unemploy-ment insurance, payunemploy-ments to forced saving funds amounting to 2 percent of wages by the employee and 3 percent of wages by the employer were elimi-nated. Contributions to the unemployment insurance are paid as 2 percent of wages by the employee, 3 percent by the employers and 2 percent by the government. Members who have been unemployed are eligible to receive unemployment benefits provided they have paid their contributions for 600 days over the last three years and for at least 120 days uninterruptedly prior to being unemployed. The unemployment benefit, amounting to 50 percent of the last four months, average wage, will be paid over 180 days as long as the mem-ber has paid contributions for 600 days, for 240 days with 900 days of contri-butions or 300 days with 1080 days of contribution.
The social insurance system in Turkey is under the responsibility of three independent agencies. These agencies are the “Retirement Fund” (RF) whose members are public servants; the “Social Insurance Institution” (SII) responsi-ble for workers in private and public sectors; and the “Self-Employment Institution” (SEI), which meets the social security needs of self-employed individuals. In addition to pensions, all three funds provide health, disability, and death benefits. Each fund functions on a pay-as-you-earn basis.
In the following we concentrate on the Social Insurance Institution (811), as similar considerations apply for the Self Employment Institution (SE1). As of
1998 the 811 had 5.6 million insured contributors in formal employment with an additional 0.9 million voluntary members and'0.2 million contributors from agriculture. There were 2.9 million pensioners and 25.2 million dependents. The dependency ratio, defined as the ratio of the sum of pensioners and amounted to 4.19, dependents for every contributor. Contributions were paid at 33.5 percent of wages, 14 percentage points being paid directly by the
employee with the balance paid by the employer. The wage on which
contri-butions were based was capped at 1.8 times the minimum pensionable wage in order to cap the consequent pension benefits. Since average private sector
wages were five times the minimum wage, the effective contribution rate for
those that earned the average wage was not 33.5 percent but 12 percent of actual wages.
One of the problematic features of the Turkish social security system was the absence of a minimum retirement age. Until 1992, the minimum retirement age in Turkey was 60 years for men and 55 for women, but the minimum retirement age limit was removed in 1992. Henceforth members who have been enrolled in the pension system for at least 25/20 years for men/women were eligible to receive full pension benefits upon the completion of a rela-tively short minimum contribution period of only 5000/3600 days by men/women. As a result of this legislation, women at the age of 38 and men at the age of 43 had the chance to retire. These pensioners drew benefits for a
long time, as life expectancy of women at the age of 38 is calculated as 38.5 more years and that of men at the age of 43 as 30.8 more years.
In the $11, the reference period for calculating benefits was the last five years of contributions for those paying on the lower pension scale and the last ten years for contributors on the upper scale. Pensioners retiring after 14 years, which was the statutory contribution period for full pension, received a replacement ratio of 60 percent of their average salary during the reference period, and each additional contribution year raised benefits by 1.5 percent of salary. The maximum replacement ratio amounted to 85 percent. The low rate of increase in the replacement ratio after 14 years of contributions relative to the cost of continuing to pay into the system provided a strong incentive for participants to declare retirement as soon as they satisfied the minimum con-tribution period. Furthermore the system had the inherent incentive for employers and employees to under-declare incomes of the workers until the final 5—10 contribution years before the worker became eligible for a pension. There were also major compliance problems due to administrative deficien-cies. First, the S11 faced problems of enrolling contributors. Second, even among those enrolled, there were problems in collecting contributions due. The compliance rate (cash receipt/accrued contribution revenues) was esti-mated at 84.5 percent of the declared pensionable wage bill.
The combination of early retirement, generous benefit formulas, and poor
collection and enforcement practices have combined to create serious financial
problems in each of the social security funds 311, RF, and SEI. The social secu-rity deficit, amounting to 2.7 percent of GNP in 1998, increased to 3.3 percent in 1999. This deterioration was expressed in a decline in revenue and rapid rise in expenditures. It was estimated that in the absence of serious reform, the
deterioration in the social security
finances would continue. The deficit was
projected to rise to 6 percent of GNP by the year 2005.
In summary, the pension scheme has suffered from serious weaknesses.
The system has become a major fiscal burden, has fostered high
intergenera-tional inequities as younger participants have contributed to a non-sustainable system, and evasion has been encouraged by high replacement rates for short contribution periods and other administrative weaknesses.
On September 8, 1999 the Turkish government enacted the social security reform bill. This law included a number of major changes, including the intro-duction of a minimum retirement age; increases in the minimum contribution periods for pensions; changes in the replacement ratio, basing pensions on indexed lifetime earnings rather than earnings in the years immediately before retirement; increasing the retirement pension in line with changes in prices; and a significant increase in the ceilings on contributions.
Minimum retirement age was introduced and for new workers the retire-ment age was set as 60/58 for men/women. For current workers the minimum
Sfibidey Togan
retirement age was raised and it was set at 56/52 for men/women who still have more than 10 years before retirement. Members who have been enrolled
in the pension system for at least 25 years were eligible to receive full pension
benefits upon the completion of the contribution period of 7000 days. For seasonal workers, the contribution period has been set as 4500 days (12.5 years). The benefit formula for new entrants to 811 provides for 3.5 percent accrual rate for each of the first 10 years, 2 percent for each of the following 15 years, and 1.5 percent accrual rate for each year thereafter. Thus the replacement rates for 10, 25, and 40 years of contributions are 35 percent, 65 percent, and 82.5 percent respectively, as a percentage of the reference wage. The new system is basing pensions on lifetime earnings. The system thus removes incentives to distort earnings. The contribution ceiling has been raised
to five times the minimum wage, and annual indexation of pensions has been
limited to changes in the CPI. In addition, the government has taken measures
to improve administration, increase enforcement measures, and expand
membership. .
Finally, we note that the social security system is financed by payroll-based
social security contributions. Contributions are paid at 33.5 percent of wages (20 percent for pensions, 12 percent for health care, and 1.5 percent for other benefits). Fourteen percentage points of contributions are paid directly by the employee and 19.5 percent by the employer. By law, there are lower and upper limits for earnings which form the basis of the social security contributions by the employer. The contribution rate equals 33.5 percent as long as earnings lie between the lower and upper bounds and will equal 33.5 percent of the lower (upper) bound if earnings are below (above) the lower (upper) bound.
Regulations in the Labor Market. Labor regulations can change the price of labor, its quantity, its quality, and the way labor is exchanged in the market. We consider in this section the regulations concerning hiring, trial periods, working hours, rest periods, protection of female employees, dismissals, forced employment obligations, the obligation to have a day nursery and kindergarten, and the obligation to employ medical doctors in the workplace.
Recruitment. The typical employment contract establishes a permanent and full-time relationship between employer and employee. Hiring procedures in the public sector differ widely from those in the private sector. It is widely held that political parties play a large role in the hiring procedures of the public sec-tor. In the unionized sector, work contracts are usually of unlimited duration. In addition to the indefinite labor contract the labor law allows for temporary
or fixed term contracts. Employment, which owing to its nature, does not last
for more than 30 working days is deemed to be “temporary” employment and employment for a longer period is considered as “permanent” employment. This distinction is based on an objective criterion, that is, the nature of the work itself and thus of employment, rather than on any subjective will or
decision of the parties. Labor contracts for an indefinite period are much more common in Turkish labor practice. Turkish employers can in principle choose among the following employment contracts when hiring a new employee:
0 Full-time permanent employment contract, which is the normal form of
employment contract.
0 Contract for temporary jobs which do not entail any severance payments in
the case of dismissals.
o F ixed-term contracts under which there is no requirement of a minimum
tenure. Work contracts over one year have to be made in writing. In case of dismissal from work after one year, workers are entitled to receive lump sum severance payment. In case of dismissals during the fixed term peri-od, the employee has the right to sue the employer in the labor court for compensation of social rights. The decision of the court is conclusive.
o The training and apprenticeship contract for youngsters which, under
Turkish law is the contract which establishes the relationship between an apprentice and his/her employer. The subject matter of the apprenticeship contract is the acquisition of a certain skill or trade by the apprentice. Being special legislation, the Act of 1977 on Apprentices, Journeymen, and Master Workmen aims to cover general provisions concerning apprentices. The Act has laid down the lower (12) and upper (18) age limits for the acquisition of the apprentice status. However, the apprenticeship contract shall continue to be valid even if the apprentice attains the age of 18 dur-ing the existence of the contract. The Act requires the employer to pay the apprentice, effective from the date on which he begins work, a certain wage, which must not be less than 30 percent of the prevailing minimum wage. Furthermore, these contracts entail substantial reductions in the social security contributions paid by the employer.
Note that part-time contracts are not covered by the labor law. The above
considerations reveal that the main characteristics offixed-term employment
contracts is that they involve substantially lower firing costs than the typical
contract. Furthermore, workers employed under fixed-term contracts cannot
sue the employer for “unfair” dismissal.
Working Hours. The maximum number of normal working hours is set, by law, at 45 hours to be divided into 5 to 6 working days. Regarding the remu-neration of overtime hours the law says that there should be an overtime pre-mium of at least 50 percent over ordinary hours. The maximum number of overtime hours is restricted to 90 days per year per worker. According to the labor law, night work hours are not remunerated with a premium. But in general, collective bargaining includes clauses on 25 percent premium pay-ment for night work. Holidays must be at least 12 and at most 34 days per year and paid leave no less than 30 days. The holiday period can be extended by
Silbidey Togan
collective bargaining. Holidays do not include weekends and official holidays. The labor law also stipulates that daily working hours cannot exceed 9 hours and between full work spells there should be a minimum gap of 12 hours. There is little flexibility in the organization of working hours.
Dismissals. Dismissal of workers is regulated by the Labor Law. The
min-imum period of notice for dismissals increases with the length of service at the
firm, not with age. During the period of notice, the employee can take two hours per day off per week to look for a new job. Alternatively, the employee can use the time at the end of the notice period. In addition Article 14 of the Labor Law requires that workers dismissed at the employer’s initiative (except disciplinary dismissals) receive lump-sum severance payments. The severance payment corresponds to one month’s salary for each completed year of service, paid at the wage level prevailing at the time of leaving, with ceilings of 30 years. Dismissed workers may sue employers in the labor courts. If the court decides in favor of the worker, that is, if the dismissal is judged as “unfair,” the minimum severance payment is increased by about three times. The lump-sum severance'payment will not be affected.
Forced Employment Obligations. According to Article 25 of the Labor
Law, Law No. 3713 on Terrorist Activities and Law No. 4131 firms
employ-ing more than 50 workers have to employ 3 percent of the workforce from dis-abled people, 3 percent of the workforce from former convicts and 3 percent of the workforce from those people who have suffered from terrorist activities. Obligation to have Day Nurseg and Kindergarten and Obligation to Employ Medical Doctors at the Workplace. According to the Labor Law all firms employing more than 150 female workers must have a day nursery and
kindergarten. Furthermore, all firms employing 50 or more workers must
employ one or more medical doctors depending on the size of the workforce.
The regulations summarized above and imposed by the government lead to
a divergence of the cost of labor to the employer from the wage rate received by the employee after taxes and related charges. The size of this difference turns out to be one of the main causes for the emergence of the informal sec-tor in the labor market.
In Turkey, the basic wage includes payments for period worked as well as payments for period not worked such as weekends, public holidays and paid leaves. In addition to the basic wage there are other payments such as overtime payments, payments for night work, shift indemnity, and work hardness indemnity, etc. Even though these payments are determined by the Labor Act, most of the prevailing amounts are negotiated and determined in collective agreements. The sum total of all these payments make up the wages and salaries. Earnings include wages and salaries, bonuses, premiums, and various social benefits. Social benefit payments consists of payments such as child allowances, fuel, education, holiday pay, and other social allowances. In the
private sector, some of these allowances are paid since they are compulsory. However, in the public sector, there are social benefit payments agreed by col-lective bargaining. In these agreements payments for meals, fuel, holiday and additional pay are always determined as social benefits. By law, family and children allowances are determined using the seniority chart of the employees. By collective agreements, these allowances, particularly meals, transportation, clothing, heating, marriage, birth, death allowances, subsidy for employee under military service, rent, and nursery allowances may be determined as lump-sum amounts.
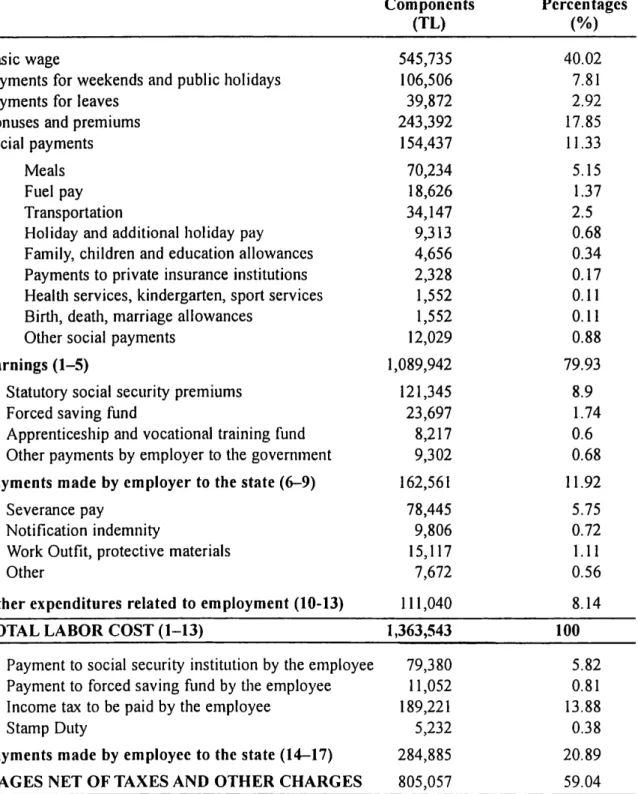
Labor cost is defined as the sum of earnings, social security contributions, severance payments, notification indemnity, employer’s contribution for housing, and compulsory savings fiinds. There are additional costs such as expenses related with sports centers, canteens, camping facilities, apprentices, and vocational training funds. Some of these payments are also obligatory and some of them are paid under the consent of the organizations. According to the Turkish Confederation of Employer Association (TISK) the composition of labor cost during 1998 was as shown in Table 6.3. From the table it follows that the share of basic wage in total labor cost is 40 percent and the share of fringe costs, 60 percent. To obtain wages after taxes we have to subtract from total labor cost payments for social security premiums, severance pay, notification indemnity, and payments to various funds such as the defense industry encour-agement fund, the incentive for social assistance and solidarity fund, the appren-ticeship and vocational training fund, the housing fund, and the sports center fund that are not paid to the worker. In addition, we subtract from the remaining figure the income and related taxes and employee’s social security premiums and obtain wages after taxes and related charges. The table indicates that during the year 1998 out of every 100 TL paid as labor cost by the producer, the work-er received only 59 TL.
Consider next the case of a worker paid the minimum wage which during
the first six months of the year 2001 was TL 139.5 million. The social
securi-ty contribution by the employee, amounting to 14 percent of the minimum wage, is estimated as TL 19.593 million. On the other hand, the unemployment insurance contribution by the employee, amounting to 2 percent of the mini-mum wage, is estimated as TL 2.799 million. According to the Personal Income Tax Law the personal exemption entitles the worker to a total exemp-tion ofTL 21.9 million. Since in addiexemp-tion to the personal exempexemp-tion, the social security and the unemployment insurance contributions are deductible, the tax base is estimated as TL 95.658 million. The income tax, calculated as 15 per-cent ofthe tax base, amounts to TL 14.3487 million. The stamp duty calculat-ed as 0.6 percent of the minimum wage amounts to TL 0.8397 million. Since total deductions amount to TL 37.5804 million the amount received by employee after taxes and contributions is calculated as TL 102.3696 million.
Siibidey Togan
Table 6.3: Labor Cost during 1998 (TL/Hour)
Components Percentages
(TL) (%)
Basic wage 545,735 40.02
Payments for weekends and public holidays 106,506 7.81
Payments for leaves 39,872 2.92
Bonuses and premiums 243,392 17.85
Social payments 154,437 11.33
Meals 70,234 5.15
Fuel pay 18,626 1.37
Transportation 34,147 2.5
Holiday and additional holiday pay 9,313 0.68
Family, children and education allowances 4,656 0.34
Payments to private insurance institutions 2,328 0.17 Health services, kindergarten, sport services 1,552 0.11
Birth, death, marriage allowances 1,552 0.11
Other social payments 12,029 0.88
Earnings (1—5) 1,089,942 79.93
6 Statutory social security premiums 121,345 8.9
7 Forced saving fund 23,697 1.74
8 Apprenticeship and vocational training fund 8,217 0.6
9 Other payments by employer to the government 9,302 0.68 Payments made by employer to the state (6—9) 162,561 11.92
10 Severance pay 78,445 5.75
11 Notification indemnity 9,806 0.72
12 Work Outfit, protective materials 15,117 1.11
13 Other 7,672 0.56
Other expenditures related to employment (10-13) 111,040 8.14
TOTAL LABOR COST (1-13) 1,363,543 100
14 Payment to social security institution by the employee 79,380 5.82 15 Payment to forced saving fund by the employee 11,052 0.81 16 Income tax to be paid by the employee 189,221 13.88
17 Stamp Duty 5,232 0.38
Payments made by employee to the state (14—17) 284,885 20.89
WAGES NET OF TAXES AND OTHER CHARGES 805,057 59.04
Source: 'liu'kish Confederation (if/EmployerAs's'ncialions (I 999).
From previous considerations we know that there are lower and upper limits for earnings which form the basis for social security and unemployment insurance contributions. During the year 2001 the upper bound TL 600 million and the lower bound TL 150 million. For a worker on the minimum wage we determine the total social security contribution to be paid by the employer and employee as 33.5 percent of the TL 150 million, i.e. TL 50.25
million. To obtain the social security contribution by the employer we deduct from this amount the contribution paid by the employee, i.e. TL 19.593 mil-lion. The result is TL 30.657 milmil-lion. Similarly the unemployment insurance contribution to be paid by the employer and the employee amounts to 5 percent of the TL 150 million, i.e. TL 7.5 million. To obtain the unemploy-ment insurance contribution to be paid by the employer, we deduct from this amount the contribution paid by the employee, i.e. TL 2.799 million. The labor cost to the employer of employing a minimum wage earner is thus the minimum wage before deductions plus the social security contributions paid by the employer, plus the unemployment insurance premium paid by the employer. Thus, the labor cost to the employer amounts to TL 175.308 million.
The above considerations reveal that the employee receives TL 102.3696 million whereas the employer pays TL 175.308 million. Thus, during the year 2001 a worker on minimum wage receives only TL 58.39 out of every 100 TL paid as labor cost by the producer. Hence the size of the difference between the cost of labor to the employer and the wage received by the employee after taxes and related deductions is substantial by any standard. This kind of diver-gence, as mentioned above, is the main cause for the emergence of the unrecorded sector in the labor market.
Consider now the term “f” introduced above within the context of the dis-cussion around Figure 6.2, where “i” was defined as the amount the firm has to pay in terms of taxes and fringe benefits. In terms of the components of labor cost presented in Table 6.3, this term would include cost items such as statutory social security premiums paid by the employer, payments by the employer to the forced saving and the apprenticeship and vocational training funds. On the other hand the term “t” showing the tax rate on wages to be paid by the employee would include costs such as payments by the worker to social
security institutions, payments to the forced saving fund and income tax to be
paid by the employee.
4. Formal and Informal Labor Markets
There are various methods to estimate the size of the informal sector in the labor market. Castells and Portes (1989) define informal employment as the sum of unpaid family workers, domestic servants, and the self-employed, minus professionals and technicians. While the ratio of informal employment in the non-agricultural sector to urban employment was 34.05 percent in 1988 according to this definition, the share has amounted to 31.04 percent in 1999. On the other hand, most of the workers in agriculture are, as shown in Table 6.4, unpaid family members and self-employed people. These people formed 94.9 percent of all workers in agriculture during 1999. It is emphasized that
Siibidey Togan
wage setting of unpaid family and self-employed labor in the agricultural sec-tor is dominated by informal arrangements. The secsec-tor faces a low tax wedge on wages and they are largely free from most types of labor regulation. Because of the absence of regulatory restrictions this type of labor market can be assumed to be part of the informal labor market. Considering the unpaid family members and self-employed people in agriculture as part of the infor-mal sector we note that the share of inforinfor-mal employment, as defined by Castells and Portes (1989), in total employment amounted to 54.89 percent in
1988 and 54.71 percent in 1999.
An alternative approach to determination of the informal sector, followed by Assaad (1997), considers the coverage of workers by social security insti-tutions. The workers are divided into two groups: those who are covered by a social security program and those who are not covered by any social security program. The covered workers are considered as part of the formal sector and uncovered workers as part of the informal sector. Here we consider the “Retirement Fund” (RF) whose members are the public servants, and “Social Insurance Institution” (811) whose members are workers in private and public sectors, and exclude from consideration the members to the “Self Employment Institution” (SE1) which meets the social security needs of self-employed individuals. Members belonging to SE1 are considered as part of the informal sector. According to this definition the share of informal employment in total employment amounted, as shown in Table 6.5, to 73.84 percent in 1989. The share decreased to 58.15 percent in 1999.
A third approach to determination of the informal sector is provided by Bulutay (1999) who considers the data provided by Household Labor Force Survey Results on "Employed persons by size of workplace and status in employment". He defines the informal sector as consisting of (i) the self employed, (ii) unpaid family workers, (iii) employers employing two or three workers, and (iv) regular and casual employees in private sector work places employing 1-3 workers. The Household Labor Force Survey Results provide information on the self employed, unpaid family workers, and employers employing two or three workers presented in Table 6.4. Data on regular and casual employees in private sector work places employing 1-3 workers is not
directly available. Bulutay ( 1999) multiplies the figures for private sector
reg-ular and casual employees with the share of employees at workplaces with 1-3 workers in total private sector employment. The share has been estimated as 0.3386. Table 6.6 reveals that the share of the informal sector in Turkey, when the third approach is adopted, is 58.95 percent of total employment in 1999.
Togan (1997) in his estimation of informal employment deducts from total employment public sector employment and obtains employment in the private
sector. Deducting from this figure the employment in the agricultural sector he
in Turkey Labor Market F lexi ili .8324 33.6; .65:Sh\o 2835 88m. : .wuhnuufi Sand: 6.630% .3333 AAAEQEUSS. ES .mmASQEm PE noEEm$mM \o 53. m5 3 «63333 MA 363. nmhgoumxzb .632 Nvfim 56m owmho>< 2.6m v0.2” 3t 302 53: ommw New mwwm 32: 9m 3% comm mo¢m< NmNm ow.A m 2m m3: mNAVNA 2mm mwv Son in? v3 5% 3mm mm-60 93mm mA.Nm Awwmm AwwoA ENE 85 m3 owom omoo m? Son mmmm mm.E< mm? 00.2” mmmmm m8: 83— mo; mwm 3:” 2mm mmo wag. comm 3-60 hmdm mad.” hmmmm RNA: van: ~55 mi» 3am boom wow 3% Sam SEE wofim ww.mm omomm cmmoA wmb Z momw oav owom Noam mm» mmhm v53” 3-60 mm.mm mmdm wowmm moms VS: 9% mav Nwwm Ammo Now 00% owmm oofia< NAHm whdm oommm 5AA: w: 2 mm: mov comm wmmoA Sm mwom wmnm 3-60 9.3 $.Nm wvvmm 83 $2: 52. «Am Vmbm ammo v Sam Am mo¢a< wmém wmém om ANN 38— ohm: mnwb omm Nam mmom owv vcmm mnmm $-60 omdm NWNM mSNN $3 22: E: 3.». gum comm Nmm mmmm comm vo¢a< w A.Vm oaém mNoAN mwma New: m A mm 5». wmmm 93 gm :3 mmwm 3-60 modm wmdw A: MAN «mg :2: 3N5 9% SR 026 mmv mmnm Aomm ma-&< vwdn 3.: SEN 83 Duo: 2: wow mmom 2% wmv mwmm Aomm $-60 ofimm Amfim momAN owvm :2: 23. am 33 Nmow m 3 mmmm Noam mm¢a< omdm nmfim mwNAN Goo oomoA >30 vow on: $8 a: mmwm mmom 5-60 .2 .mm Noam SEAN Nnom >22 ovmo mom Sum mama 5N come mnmm Ao¢a< awdm modm Noam NAma mono. mmmh mom omwm mmmm m3 2% mo; 8-60 moém mmNm ammom wmhm wwmm bib 9% mama :3 mmv mmom mvom oa¢a< modm 05mm mwmom hmww Com 2% v; gmm 020 gm Aim :3. 3-60 3.5m 3.9m oAmom wmow 83 Sub mwv Nmmm ommo Nov omwm mmom mm¢a< mwdm moém momom mm $3 3% m9. omvm om; new 3% min 3.60 Aé Ax; A 88 A 2:: A 8A: A 38 A 8A: A 88 A 8A: A 8A: A 8A: A
83 6.9.95 Loy—.33 2...“ 1:30 coho—QEH Each. 33 coho—n56 63.53 33 .330 3.3.93. :23. EoEAoEEH fim «cofimoi 5 Ext: EuEhoEEm EofiaoEEm
23 .53. E .365 3333:: FAB—autucrgz E EuEmoEEm “6333:: .6 225 .53. 53.5 . .83. Sac—QEH .5...q EEum Ewan: ago—A—Eo zum cyan—autu<-:oz ammo—nfim .3...q £54.."— EaaE. coho—n50 .=ow flaiutu< 227
S fi bidey Togan .nmznfl $6.29» 63:55»k Mmmnnui 83m. : 528%“: 3.80%. Emu £50289. .6933. EM 8 a. 55.6.? .fimaEuEKo 55. m5 .3 «$33,930 a .383. Eaton? 5 EmEkoEEm .632 3.3 31v mm.wm 5.: Sim owém wwdm hmdm wwdm mwfim wwdm fix; 380m @0938 .«0 Banm m~.wm omdm 3.3 3.8 bméo omfiw 09$ mode 0?: 2.3. 2.3. AXQ .583 3282:: .«o 8.2m mNNd wad Smd wwwK mNmK wwofi vovd X56 Nmo fi Smfi S 1m 8009 583 @0988 E .EoEoEEm w.m~ c$.-cad; $92 392 mnfifl cot? 35.2 we <3 5%.? 03.2 See .563 cop—08E: E “conic—arc”; mmmd wvmd Smd wwwfi mNmK vwofi v9.6 vood Nmofi Smfi 9 1m 8009 mm .5 2m 553 mo Eon—E02 mo fim NS.N omo.m 3m; 8w; mam; NE; on: owe; own; cow; 809v use EoEoEB Mo 33802 ONHK 05.0 m£6 vmafi mwofi wwfim .8v EN6 mama amfi MGR. Soc» coufltmcm oogamfi 308 mo £3602 fimo.NN van. 5 fine. a 3m. 5 cm fl.3 bmmdm $5.2 $5.3 09.9 mm fle 392 809V Evie—Eco 138‘ 33 waa— E3— ema m9: vaa— 83 33 33 .53 $3 238m 3339.:D "Ea 36.83% E “Egg—mam “m6 «ENE 228
Labor Market Flexibility in Turkey .833 .3953 .mUEQSMF 85.5.5 23m. : .mutwtua. Baud: 6.830% .5238 Egtnfi ufik fifizz MUQAQNQEN 33.30 mu mug :a 533% Amtzm. musk gonad Eommwzotxw firm. mB fl EEKEMESQQ 53 man: .633. 29m E wmoEEm 33.39 .m £538 Sgtmfi m fikb fima 398326 33MB .3 092 2.31 53.3% Avian 33k Bead Eofiwzoixw mwfi flank EEKnmfi uBo 53 9:3 .633. 833.3 E QuaoEEm .33m .N .33.q m 33 N $53355 mLmASQEmKo EB. m5 .3 33 ELEV .333: Avian. musk Sana Eofifismko 3th SSE EEKRSEQQ 5.3 93: 282mm m .6 N MEASQEM ENASQEM .~ .332 mm.wm $.m 29: 5mm g RV on? Ev mmmo 8% 5&2 moi 3.5m 2m Si: NmE vam owvv o: Sum mmmm 82m wofl .53 Somm mwofl mmo. 9% mix“ 20 09% Nmmm 5&2 mmfl Q; 88; 825 825 825 825 825 825
825 homo—QEH 3:33 289:5 355.5 Stem 32.:— 33% m; 28.8; 38% Eon—zoEEH fim Eofihoi
.33. E .33. 69332:: E w:$c:—EH 5 macho—QEH E amaze—QEH m .8 N mam .25 coma—QEH houuom EtoEEm mafia—SEW 5 3:30 pained wig—95m Ema—.5 :om cutonohnb ”Ev—.83 wage—QEH flame—QEH 229
Sfibidey Togan
To determine the informal employment in the private non-agricultural tor he subtracts from the regular and casual employers in non-agricultural
sec-tor figure (reported in Table 2.2 ‘Employment by Professional Status and
Branch of Economic Activity’ of “Household Labor Force Survey Results April 1999”) the number of registered wage earners from the Ministry of Labor Registrations as formal by the Ministry of Labor publication “Call_ma Hayat1 _statistikleri,” to obtain the estimate of informal wage earners in the private non-agricultural sector. Employment in the private non-agricultural formal sector is then obtained as the residual. Total employment in the formal sector is derived as the sum of public sector employment and employment in the'private non-agricultural formal sector. Employment in the informal sector is obtained as the sum of employment in the agricultural sector and in private non-agricultural informal sector. The data reported in Table 6.7 reveal that the share of the informal sector in Turkey is about 65 percent of total employment. A different estimation method used for determining the size of the informal sector considers the share of subcontracting activity in the economy. Recently, the growing integration of national economies into the international system has
led firms to reduce their labor costs. This has largely been achieved through
subcontracting. In this system of organization, the parent firms subcontract a
portion of their unskilled labor-intensive production operations to take
advan-tage of lower wages in smaller firms, which usually operate in the informal
sector.
According to a survey conducted by the State Institute of Statistics (1996), covering all public sector establishments in the manufacturing industry and all private establishments in the manufacturing industry employing at least 25 workers, 48.69 percent of the 5219 establishments in 1987 were involved in subcontracting. The share increased to 51.33 percent of 5969 establishments in 1992. The share according to the number of employees increased from 49.92
percent in 1987 to 53.67 percent in 1992. On the other hand, the share
accord-ing to value added increased from 43.35 percent in 1987 to 47.49 percent in 1992. Table 6.8a shows the results of a survey conducted in 1992 on 186,902 establishments in the private sector employing 1—9 workers, and Table 6.8b shows the results of a survey on 5550 establishments in the private sector employing 25 and more workers. The table reveals that the share of small enterprises engaged in subcontracting is 33.8 and that of large enterprises is 53.1 percent. Among the small enterprises, 19.45 percent of all enterprises do only subcontracting work, 11.01 percent of enterprises are involved in own production and subcontracting, and 3.34 percent of enterprises give subcon-tracting work. The equivalent shares among large enterprises are as follows: 4.9 percent of enterprises are doing only subcontracting work, 22.11 percent are engaged in own production and subcontracting, and 26.09 percent of large enterprises give subcontracting work.
Labor Market Flexibility in Turkey .QQQC SE65 60.50% 3% 5.1m 2.3 8.: E43. 8.? ex; “85835 Be 5 838 82830 225 8.3 8.8 8.8 3.8 2.8 3.8 g EOEOEED 39 e 558 82825 M0 22m O36 £3 £3 :3 2% 03.0 825 888 3282 E H:o§o_aEm Sq: OS“: 33. Sq: .82 gas 825 538 8282:: E “5:53c 8? 83 R3 a? £3 £2 82: Eoioaeo 8282 EEEUEEE SSE 83 E? 3% Eva $3” 33 :58 20833.5 8282:: EEBEZS BEE 2m 9mm 8am 23 $2 $3 808 Space 9255 2: E 8282 80335 was 23 2: Ed SS 2% see eaaofiméc E 3&2a Esmom $3 $3 3; a: $3 we.» see assocmmeo: E EoaEm 83 3% Q; a? mad mama 825 2330c E EQEOEEm -eta: 03,2 mag mag 33. 83. sea 533, 82% E “85335 Swnm cam omw.m ow; omg $3 88» 558 233 E “5&2q -~38 08.2 NE: wmwa 82: 83: 608 “55295 ES 32 m9: 2.: 32 82 $2 231
Su'bidey Togan
Thus the table shows that large firms are mostly subcontracting their work to
smaller firms, and small firms are largely engaged in work subcontracted by
large firms. The subcontracting activity of all public firms and all private firms
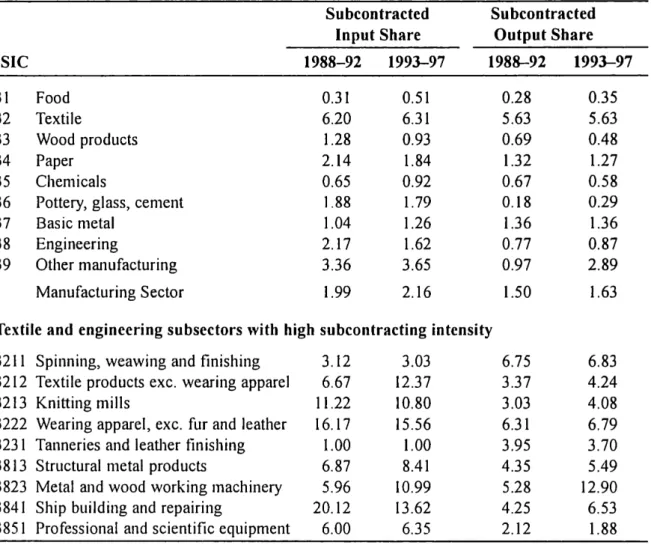
employing 25 and more workers in the manufacturing sector has recently been analyzed by Taymaz and Kilicaslan (2000). Their results are summarized in Table 6.9. According, to the table the subcontracting intensity as measured by the share of subcontracted inputs in all inputs and the share of subcontracted output in total output is rather low in manufacturing industries.
There are significant inter-industry variations in subcontracting intensity. The textile industry has the highest subcontracted input and output shares, fol-lowed by machinery and equipment industry. The shares increase for sub-sec-tors in the textile industry. The relatively low subcontracting intensity observed by Taymaz and Kilicaslan is due mainly to their neglect of small firms in the manufacturing industry. It should also be emphasized that sub-contracting is quite common in the services sectors, which have also not been analyzed by the authors.
The above considerations reveal that the share of informal labor in Turkish total employment is in the range of 60 percent. The share is quite substantial by any standards.
5. Productivity, Real Wages, and Unit Labor Costs in
Manufacturing
Turning to consideration of empirical evidence on value added, employment, productivity, wages, and unit labor costs in the manufacturing sector we note that Table A6.1 summarizes the statistics obtained from the “Annual Manufacturing Industry Statistics” of the State Institute of Statistics for the
period 1980—97. The surveys cover all
firms in the public sector, and private
firms employing more than or equal to ten employees. The table reveals that the three sectors with the highest share in total value added of the manufactur-ing sector are ‘petroleum refineries,’ ‘spinnmanufactur-ing, weavmanufactur-ing and finishmanufactur-ing tex-tiles,’ and ‘iron and steel basic industries,’ and the three sectors with the high-est growth rates of value added over the period 1980—97 are ‘fur dressing and dying industries,’ ‘manufacture of professional and scientific, measuring and controlling equipment, n.e.c.,’ and ‘manufacture of electrical appliances and housewares’.
In terms of employment the sectors with the highest shares in total manu-facturing employment are ‘spinning, weaving and finishing textiles,’ ‘fur dressing and dying industries,’ and ‘knitting mills,’ and in terms of employ-ment creation the sectors with the highest growth rates are ‘manufactures of motor vehicles,’ ‘cordage, rope and twine industries,’ and ‘manufacture of transport equipment n.e.c.’
Labor Market Flexibility in Turkey .«mg C Suck 6.230% 5.3. $.N 8.: 3:. 3.. ”€355.33 E 39%,; 3: 3553358 E ESP 3..m mm.m cod mam 8.8 35852358 550 9 mcuogcofi sm mm.w cod one aim wmfi 35852833 550 9 wcsoabsoonsm 32 2f 9% 8a 3.2 m3: wcsumbcoona 23m 8.8 gm Mam 38 :.NN mcsombcoonsm new 85255 :30 .23 cod 3% 3.. :.m wccogcoopsm 229:8 nmd 8.2 ofiow 8.. Q..— mcuombcoonsm 03325:: and 36 no.3 EN 3. mcuogcoogm 3:0 3% 8... 52 3% 2.8 3:35:82... 5 39%.; 35.5%338 z 3.; NQQN M323! hLMfi LQi MN uWUNN uG MflmAQNQEN hufi msfi nfifiuuhm kcwumu. NuuamLaN 2.» MfimuUUhEQUQRMKW 9325” .g SS 8.: 8.: 3% 3.8 $535.83.; 5 cowawfi. 3: 3553338 ho Bob v: mg: 86 :1. 3:,“ 3:08:23s 550 2 manombcoonsm wws cod mm. a omd N2: 85852398 550 9 wcuombcoona 32 E; om. : $.0— wo._ ad mcsombcoonzm 2Q 86 23 mmdm mm? 3.: $383893 can 88805 :30 mad cod 3.3 ND: off wcuombcoonsm 803800 #2 8.3 5.8 w: 3.0 wcuogcooea savages 2.: 0:: 2.0m 2.2 3.2 wcsombcoonsm 3:0 35 as 3:. mm? 3.2 ”€85.82: 5 Emmy; 3552358 E 3.: @035. E “3:53:0a 2:8:— m343>> mucofifi znfimm 33> 33H 33H. 5 3:53. .3 .3 9:25 5 mouzxuzomxm wzzuatgonzm :3: $393. 93.5 u=$onbcounsm 0:32: .3 93.5 .3 22m .3 22m 233
Siibidey Togan
Given the value added figure of sector i, VA,, we deflate it by the implicit manufacturing price index p obtained from national income accounting data published by the State Institute of Statistics. The real value added figure is obtained as va,- = (VAi/p), and given the employment level of sector i, L,, the productivity of labour in sector i is defined as PROD,- = (va,-/L,-). Table A6.1 shows the large differences between the productivity levels in the various man-ufacturing sub-sectors. The sectors with high productivity figures include ‘petroleum refineries,’ ‘malt liquors and malt,’ and ‘tire and tube industries,’ and the sectors with low productivity figures include ‘cordage, rope and twine industries,’ ‘manufacture of structural clay products,’ and ‘manufacture of wood, and cork products not elsewhere classified.’ The sectors with the high-est productivity growth rates include ‘fur dressing and dying industries,’ ‘soft drinks and carbonated waters industries,’ and ‘manufacture of soap and clean-ing preperations, perfumes, cosmetics, and other toilet preperations.’
The “Annual Manufacturing Industry Statistics” include information on
annual payments to employees denoted by w,- L,-. Dividing this figure by
employ-ment we obtain the nominal wage data. The real wage is then obtained as (wi/CPI), where CPI denotes the consumer price index. Table A6.2 shows the developments in real wage in the manufacturing sector. From the table it follows
that there have been large fluctuations in the real wage. The real wage rate in the
manufacturing sector decreased by 20 percent over the period 1982—88, and increased by 97.9 percent over the period 1988—91. The fall in the real wage rate during 1993—96 amounted to 28 percent. The picture does not change very much when one considers the developments in manufacturing sub-sectors.
The above considerations, showing the extreme flexibility of labour
mar-kets in Turkey, need some clarification. The country, after pursuing
inward-ori-ented development strategies for fifty years, switched over to
outward-orient-ed policies in 1980. With the real depreciation of the Turkish currency, real
wages started to decline as indicated in Chapter 1. In 1989 the government reversed its real exchange rate policy and conceded substantial pay increases
during the collective bargaining in the public sector during 1989.
Consequently, pressure built up in the private sector to arrive at similarly high wage settlements. As a result of these developments the real wages increased. But the increase in real wages was not sustainable. In 1994 the country faced balance of payments crises. With the introduction of stabilization measures the trend in real wages was reversed. But again political pressure increased to reverse the policies. At the end of 1999 Turkey had to sign a stand-by-agree-ment with the IMF, again reversing the trend in real wages.
The ultimate aim of any society is to increase the real wage over time. But
the increase in real wages has to be sustainable. Large fluctuations in real
wages reveal that the policies pursued, e.g. over the period 1988—93 have not been sustainable.
Table 6.9: Subcontracting in Manufacturing Industries
Subcontractcd Subcontracted Input Share Output Share
ISIC 1988—92 1993—97 1988—92 1993—97 31 Food 0.31 0.51 0.28 0.35 32 Textile 6.20 6.31 5.63 5.63 33 Wood products 1.28 0.93 0.69 0.48 34 Paper 2.14 1.84 1.32 1.27 35 Chemicals 0.65 0.92 0.67 0.58
36 Pottery, glass, cement 1.88 1.79 0.18 0.29
37 Basic metal 1.04 1.26 1.36 1.36
38 Engineering 2.17 1.62 0.77 0.87
39 Other manufacturing 3.36 3.65 0.97 2.89
Manufacturing Sector 1.99 2.16 1.50 1.63
Textile and engineering subsectors with high subcontracting intensity
3211 Spinning, weawing andfinishing 3.12 3.03 6.75 6.83
3212 Textile products exc. wearing apparel 6.67 12.37 3.37 4.24
3213 Knitting mills 11.22 10.80 3.03 4.08
3222 Wearing apparel, exc. fur and leather 16.17 15.56 6.31 6.79 3231 Tanneries and leather finishing 1.00 1.00 3.95 3.70
3813 Structural metal products 6.87 8.41 4.35 5.49
3823 Metal and wood working machinery 5.96 10.99 5.28 12.90 3841 Ship building and repairing 20.12 13.62 4.25 6.53 3851 Professional and scientific equipment 6.00 6.35 2.12 1.88 Source: Taymaz and K[hoax/an (2000).
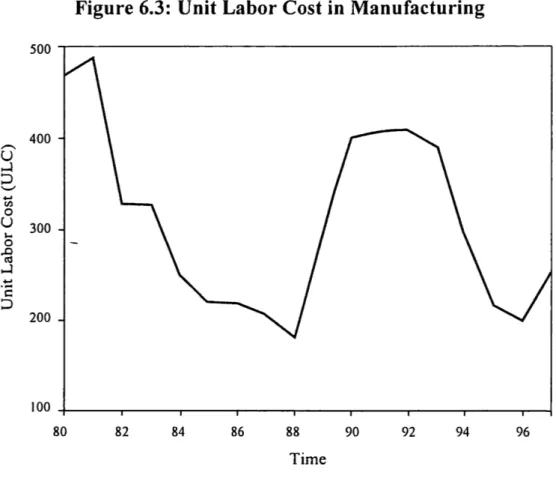
Let us now turn to consideration of the developments in unit labor costs defined as (w,- /PROD,-) where PROD,- denotes the productivity of labor in sec-tor i. The unit labour cost measured in terms of foreign currency units is then obtained as [w,- / (PROD->1: E)], where E denotes the exchange rate. Data on unit labor costs measured in foreign currency units are provided in Table A6.3. A close consideration of the data reveals that unit labor costs decreased during the 19805 up to 1988. Thereafter there is a sharp increase in unit labor costs. With devaluation in 1994, unit labor costs decreased again, but after 1995 the country reversed its economic policies. Unit labor cost started to increase until 1999 when the country signed the stand-by-agreement with the IMF. Thereafter the unit labor cost started to decrease again. The development of unit labor cost for the aggregate manufacturing sector is shown in Figure 6.3. 6. Conclusion
It is widely believed that enterprises tend to become reluctant to take on new employees when faced with relatively high labor costs and with associated high
Siibidey Togan
firing costs. Employers become cautious about hiring new workers with con-tracts of indefinite duration, opting instead to rely on casual labor, subcontract—
ing, or fixed-term contractual relationships. In Section 1 it was mentioned that
the Turkish population increases on average at a rate of one million persons per year and that over time, Turkey must continuously create new jobs. In the past Turkey has successfully solved the unemployment problem through the exis-tence of the large informal sector. Over time this sector has grown considerably through the lax enforcement of tax, social security, and labor laws. But lax enforcement of the laws has created different problems for the Turkish society. The economic units started to take it for granted that they could avoid the rule of law.
In addition, with increasing globalization, international pressure will also increase on Turkey to change its institutions, regulations, and legislation protecting workers in the formal sector. The current system of formal and
informal sectors, with informal sector accounting for about 60 percent of total
employment, does not seem to be sustainable in the long run. In particular, we may expect EU firms to complain about unfair trade practices by Turkey and the EU may ask Turkey to enforce its own labor laws, laws on the social secu-rity system, and tax laws.
When the country starts to enforce the tax, social security, and labor laws uniformly, the informal sector will experience a rise in labor costs leading to a decrease in the demand for labor and hence an increase in unemployment. In order to minimize the problems of unemployment, the policy makers have to
change the current job security legislation in order to reduce firing costs,
decrease the high social insurance contribution and tax rates, and eliminate whenever possible other payments. In short, measures should be designed to reduce the difference between the labor cost to producers and the amount received by labor after taxes and related charges. A system where even a work-er on minimum wage receives only TL 58.4 out of evwork-ery 100 TL paid as labor cost by the producer is not sustainable. Efforts should be made by the state to increase the contribution collection in the social insurance and tax systems. Furthermore, part-time contracts could be incorporated into the labor law. It should be emphasized that policy makers, when implementing the compre-hensive labor market reforms, will have to consider the goals of attaining
increased labor market flexibility, avoiding potential increase in
unemploy-ment, enforcing uniformly the tax, social security and labor laws throughout the country, decreasing the share of the informal sector in total employment, and any possible trade-offs between these goals.
Unit
Labor
Cost
(ULC)
Figure 6.3: Unit Labor Cost in Manufacturing
500 400 -300 4 200 _ IOO 80 82 84 86 88 90 92 94 96 Time
Su'bidey Togan Annex omd dN.mN 3N vod nwv Sum-vod 21m; _ 8:5s 2:3 mm _ m mmd 36m mod. and mwm.m mvN .vd wowhv: 9E9. $653 25 $5502 .wgzfia E m dud mwdm mod mmd mmmd NNd ovd dmmdfl 808 38:5 @8805 do 232%,:v NE m mod amb— hdd mod 81mm do.»q mm; nmmdbm 20:33? wocmmmflo Ho: £2605 doom do 2383,82 S: m Gd ow._ N 9 . T dd._ mow. : mo.m_ mwd 5d._ mm bacocofl coo Ema new Bfloooco “moooo mo 230$:m 2 _ m and C .N. mod-do; mmmd_ 0N6 dwd dmmdm _ mucosa“: dam motodofi 5m w d g m mNH S. : 36 odd vownmm ovd wad wwmdom 3268a Emu—3.5 888.352 n _ _ m mmé 51m. ovd-Ed ovmno mm.m Sud om_.mm_ £2605 EE EEO 2 _ m 58 dmdv Pd-odd 32: 3 .0 do; wwvdvv flfl Ea mzo EEEN 25 058%? mo 8333,82 m _ _ m mmd 3.2 3d. 2d now; 8.2 2d wtnmm mcmooSmEo cam 2mm mo mEmmoooE ES @5585 “mcmccmo .1 _ m nwé mw.m_ no..-Nb; Sod. Ed 2.. 0mm; .m 838%? 98 38¢ mo wEEomBQ dam cc 2 _ m 2d tm mud mmd mwdd 3.: mm d bdwnmf 3268a bad mo 838?:d 2 _ m mwd ~N.o_ mm...“ d _._ :m.N_ odd cwd mmmdvm $.08 mEEomoa nan wctwaoa nwctofiws flm :3. Sim mod. Rd 002 movK: mod 3. 2 mtdmmfi 0839 van mowfigon 600% do ohaoflscmz .m 3.23-33 5 3-33 EofizoEEm 53— E Edwa— Uouc< 03.5 5153 05— btfiuscohm 333309:— EoEEm war—33.352 EoEbzn—Em U023. ~=_a> 3:398:52 83... .—O 09am ho Quad Each. :_ ho Guam Each. :_ Uofifl< 05—5? 539.0 5.530 EoEzo—QEH 5.59.0 <> .3 22w ho Ohms—W