S C H E M E F O R A L L O C A T IN G
tiAARiNF
^ ,0
£i i m O N C O S T S-Â C A S E S T U D V C f
İZ M İT B A Y A R E A
THESiS
S U Z A N K A Ş /K Ç I
A N K A R A . J U N E 1994
A SCHEME FOR ALLOCATING
MARINE POLLUTION COSTS-A CASE STUDY OF
İZMİT BAY AREA
A THESIS
SUBMITTED TO THE FACULTY OF MANAGEMENT AND
GRADUATE SCHOOL OF BUSINESS ADMINISTRATION OF BILKENT UNIVERSITY
IN PARTIAL FULFILLMENT OF THE REQUIREMENTS FOR THE DEGREE OF
MASTER OF BUSINESS ADMINISTRATION
BY
SUZAN KAŞIKÇI
ис
79
•P5f
lcS7
i99
^6 0 2 7 0 0 2
I certify that I have read this thesis and in my opinion it is fully adequate, in scope and quality, as a thesis for the degree of Master of Business Administration.
Assoc. Prof. Can §imga MUGAN
I certify that I have read this thesis and in my opinion it is fully adequate, in scope and quality, as a thesis for the degree of Master of Business Administration.
Assist. Prof. Serpil SAYIN
I certify that I have read this thesis and in my opinion it is fully adequate, in scope and quality, as a thesis for the degree of Master of Business Administration.
Assist. Prof. Ayşe YÜCE
Approved for the Graduate School of Businesss Administation.
j q
ABSTRACT
A SCHEME FOR ALLOCATING MARINE POLLUTION COSTS A CASE STUDY OF İZMİT BAY AREA
BY SUZAN KAŞIKÇI
SUPERVISOR: ASSOC. PROF. CAN ŞIMGA MUGAN
JUNE, 1994
This study determines what should be the contribution of each firm to the cleaning up cost of the eastern part of İzmit Bay. The total initial investment of cleaning up the eastern part of the bay consists of: the costs of the inciniration plant, waste water purification plant, collector, and solid waste depositing plant. As the marine pollution is considered in this study, calculations are based on the initial investment costs of collector and waste water purification plant. At the first step, establishments are ranked and scaled with respect to their daily total discharge in volume. After
this initial stage two models are designed to determine the
contribution costs. In the first model costs are determined for each establishment, where as, in the second model costs are determined per parameter for each establishment. The results indicate that the second model is more accurate since, it is possible to be more specific in cost allocation.
ÖZET
DENİZ KİRLİLİK MALİYETİNİN DAĞILIMI İÇİN SINIFLANDIRMA-İZMİT KÖRFEZİ ÇALIŞMASI
SUZAN KAŞIKÇI
Yüksek Lisans Tezi, İşletme Enstitüsü
Tez Yöneticisi; Doç. Dr. Can Şımga Mugan
Haziran, 1994
Bu çalışma, İzmit Körfezi doğu bölgesinde bulunan her
kuruluşun körfez temizleme maliyetine katkı paylarını belirlemek için yapılmıştır. Doğu bölgesini temizlemenin ilk yatırım maliyetleri; yakma tesisi, atık su arıtma tesisi, kollektör ve katı atık depolama tesisleri maliyetlerinden oluşmaktadır. Bu çalışmada deniz kirliliği
gözönünde bulundurulduğundan hesaplar atık su arıtma tesisi ve
kollektör üzerine kurulmuştur. İlk adımda kuruluşlar günlük atık miktarına göre sıralanmış ve derecelendirilmişlerdir. Bu ilk adımdan sonra katkı paylarını belirlemek için iki model izlenmiştir. İlk modelde maliyetler kuruluş başına belirlenmiştir, oysa ikinci modelde
katkı payları her kuruluş için parametre başına belirlenmiştir.
Sonuçlar, maliyet dağıtımının ikinci modelle daha doğru ve daha spesifik olduğunu göstermektedir.
I am grateful to Assoc. Prof. Can Şımga Mugan for her supervision and constructive comments throughout the study. I would
also like to express my thanks to the members of the examining committee for their contribution, to my father, to Ercüment Bölükbaş and to Veziroğlu İnşaat for their support throughout my study.
ACKNOWLEDGEMENTS
ABSTRACT ... i
ÖZET ... i i ACKNOWLEDGEMENTS ... iii
TABLE OF CONTENTS ... iv
LIST OF THE TABLES ... vi
LIST OF FIGURES ... viii
1. INTRODUCTION ... 1
2. BASIC CONCEPTS ABOUT ENVIRONMENTAL POLLUTION ... 3
2.1. GLOBAL ENVIRONMENTAL POLLUTION ... 3
2.1. A. ECONOMIES OF ENVIRONMENTAL POLLUTION ... 9
2.1. B. "TAXMAN COMETH" MODEL ... 10
3. MARINE POLLUTION IN TURKEY AND İZMİT BAY ... 14
3.1. PRESENT CONDITION OF MARINE AND COAST POLLUTION IN TURKEY 14 3.2. ENVIRONMENTAL PREVENTION FUND ... 16
3.3. POLLUTION IN İZMİT BAY ... 17
CONTENTS
Page
3.3. A. THE BASES TO APPROACH TO WASTE-WATER DISCHARGE
STANDARDS ... 19
3.3. B. THE APPROACH FOR INSPECTION OF THE INDUSTRIES DUE TO WASTES AND EFFLUENTS ... 21
4. DATA GATHERING, MODEL SPECIFICATION AND APPLICATION ... 23
4.1. DATA GATHERING ... 23
4.2. INDUSTRIES WHICH NEED LOCAL INDIVIDUAL PURIFICATION FACILITIES ... 24
4.3. CLEANING UP PROJECT FOR EASTERN PART OF İZMİT BAY ... 28
4.4. RANKING OF ESTABLISHMENTS... 32
4.5. MODEL SPECIFICATION AND APPLICATION... 36
4.5. A. TOTAL CONTRIBUTION COST OF EACH ESTABLISHMENT... 36
4.5. B. CONTRIBUTION COST OF EACH ESTABLISHMENT WHEN THE TAX-PAYER CONTRIBUTES AS WELL... 41
4.5. C. CONTRIBUTION COSTS PER PARAMETER FOR EACH ESTABLISHMENT... 43
5. CONCLUSION ... 48
LIST OF THE TABLES
Page
TABLE 1. Four Significant Pollutants and Status of
Discharges in 1984 25
TABLE 2. A New Profile After Improvements in the Industries Which Need Local-Individual Purification Systems
Proposed by TÜBİTAK 1984 Study 26
TABLE 3. Initial Investment Table 29
TABLE 4. Standards Stated by "Water Pollution Prevention
Regulation" Sept. 4, 1988 31
TABLE 5. East Part of İzmit Bay Polluting Industrial
Establishments and Total Discharge Loads (KG/DAY)
February, 1993 33
TABLE 6. Ranking of Establishments 35
TABLE 7. Total Discharges and Contributions That Could Be
Collected Annually 38
TABLE 8, Cost Allocated (Scenario 1), Legally Collectible Amounts and Percentage That Could Be Met From The
Prevention Fund 40
TABLE 9. Cost Allocation for Scenario 2 and Comparison With
Scenario 1 42
TABLE 10.Loading and Cleaning Costs for Each Parameter 44
TABLE 11.Percentages of Parameters for Each Establishment 45
TABLE 12 Cleaning up Costs per Parameter for Each 46
Establishment (DM)
LIST OF FIGURES
Page
FIGURE 1.1. The Throughput of Materials in the Economy
FIGURE 1.2. Relationship Between the Level of the indicator and the stepwise changes in the discharges in the
discharge of a residual. 8
1. INTRODUCTION
The purpose of this study is to determine what should be the contribution of each firm to the cleaning up cost of the eastern part of İzmit Bay. In this way, a cost allocation scheme of marine pollution is constructed.
İzmit area is examined in this study because the area is developing as the densest center of industry in Turkey. The bay is polluted at an increasing rate by domestic waste water, effluents and
discharges from industrial premises, greasy wastes from ships,
industrial gaseous wastes and particle pollutants, and eraded earth and organic pollutants introduced by the streams. The production in the area constitutes a large amount of total production in Turkey. Besides the industrial development, the region is rapidly growing as a commercial center as well.
The pollution in the bay area has reached to levels
threatening human lives and marine life, and therefore there is a need for immediate precautions and solutions to prevent further pollution. The government spends huge amounts of money annually to cover the damage that the pollution has caused on human life.
It is believed that more serious steps should be taken to
prevent and solve environmental problems causing pollution and
damaging natural life. Environmental regulations should be revised and applied so that establishments will be under regular control and
standards will be obeyed seriously. İzmit region is a good example to examine, since pollution level has reached to threatening levels. Another reason to examine this region, is that there is a project under construction that consists of; inciniration plant, collector, waste.water purification plant and waste solid depositing plant in eastern part of the bay. This project cost will help us in determining contributions to the cleaning up cost of each establishment.
The focus of this study is the, marine pollution and thus only initial investment costs of the collector and waste water purification plant are taken into consideration. Two methods are then proposed to determine the contributions to the cleaning up cost.
In chapter 2, basic concepts about environmental pollution are explained. In chapter 3, present condition of marine pollution in Turkey and İzmit Bay is described. Finally, in data gathering, model specification and application, by the help of the loadings in volume of each parameter for each establishment total daily discharges are determined and, a ranking from the most to the least polluting establishment is obtained. Based on the ranking system proposed, annual payments by each establishment are determined. Meanwhile, for each establishment, annual contributions that could be collected for
the environmental pollution prevention fund as stated by the
Environmental Regulation No. 2782, is calculated. Proposed payments and payments that could be collected for the fund are compared to observe what percentage of cleaning up cost could be covered from the
fund. In the second method, starting with the percentages of
parameters for each establishment, cleaning up cost is determined per parameter for each establishment.
2. BASIC CONCEPTS ABOUT ENVIRONMENTAL POLLUTION
2.1. GLOBAL ENVIRONMENTAL POLLUTION
In considering the impact of industrial activity on
environmental quality and on health, one needs to remember that the environment was not really taken seriously until the beginning of the 19th century. Before then, there was the concept of "Garden of Even" which resembled clean, peaceful and fertile environment. In the past
few years' environmental protection has become a challenging
scientific task. Signs of environmental awareness and a willingness to cooperate on an international level are increasing. A number of international conferences on environment have been held and more are scheduled. {Dohlberg, 1985)
The industrial development resulting in increased level of industrial pollution of the environment has already begun disturbing the ecological equilibrium in many regions of the globe. Most production and consumption activities have some effect on the physical environment.
The rise of the petroleum and chemical industries has
introduced vast quantities of toxic chemicals into water and soil. The synthetic-chemical industry is largely a product of post 1945 economic and scientific development. Just before World War II the U.S. produced only about 1 billion pounds (0.45 billion kilograms) of synthetic
organic materials annualy. By 1950, production had already passed 20 billion pounds (9 billion kilograms) and by 1985 it had reached 225 billion pounds (101 billion kilograms). Roughly half of the 70,000 chemicals now in commercial use are considered by the governments of the United States and the European Economic Community (EC) to be definitely or potentially harmful to human health. (WHO, 1990)
Commercial fertilizer consumption world wide jumped from 14 million metric tons in 1970 to an estimated 146 million metric tons in 1989. These chemical compounds, which have been so important in agricultural production also pose a potential threat to human health worldwide through their disposal into water supplies. (WHO, 1990)
Oil, which has been the world's main source of energy for industry and transport, has also been discharged directly into the soil in the process of shipment to markets. Official data on oil discharges into the seas from shipping are lacking, but it is estimated that by the 1990's such discharges had reached roughly 1.5 million metric tons annually. (WHO, 1990)
The rise of nuclear power as a source of energy has led to the disposal of low level radioactive wastes into the oceans. The cumulative volume of such nuclear wastes raise from less then 20,000 metric tons in 1967, with a negligible radroactivity, to almost 100,000 metric tons with a million curies of radioactivity in 1984. (WHO, 1990)
Coastal areas reflect the effects of rapidly growing concentrations of population, industrialization, mariculture, tourism, eutrophication and plankton blooms from sewage and nitrates, plastic litter, lost habitats from the destruction of beaches, coral reefs, wetlands and mangrove forests. Coastal area destruction for land-based activities is now the major cause of immediate concern in the marine environment on a global basis. (J.Vig, 1990)
Oceans and seas are fed by rivers through many estuaries and outlets which also act as channels for agricultural, industrial and chemical effluents. The great oceans have a high capacity for absorbing organic and inorganic materials from both man made and natural sources. The extent of this capacity can only be speculated, but the effects of pollution on coastal zones and enclosed seas are very apparent.
Economic activity, production and consumption, influences the natural environment in three fundamental ways;
1. by the occupation of space
2. by the extraction of raw materials, such as minerals, oil, fish, etc.
3. by the discharge of residuals that find no further use in economic activities.
In order to analyse the relationship between economic
activities and pollution, it will be convenient to distinguish between the following three steps;
1. the relationship, between economic activities and the discharge of residuals.
2. changes in nature due to these discharges
3. social costs related to these changes in the natural environment. (Strom, 1988)
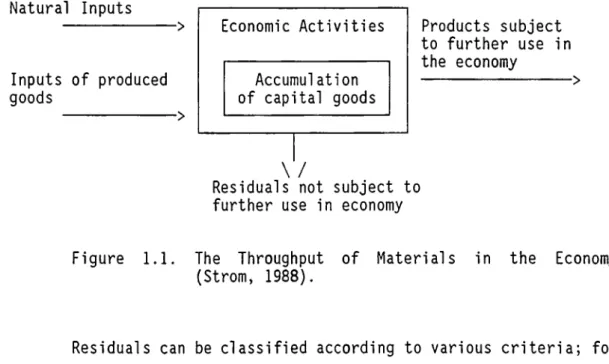
Discharge of residuals is a fundamental feature of economic activities. The through put of materials is illustrated in Figure 1.1. Materials of substances used in economic activities are incapable of disappearing in a physical sense. We can draw up a material balance of the economy. The amounts of materials or substances extracted from nature must either remain in the economic cycle, or be discharged and return once again to the natural environment. (Strom, 1988)
Natural Inputs Inputs of produced goods Economic Activities Accumulation of capital goods Products subject to further use in the economy \ /
Residuals not subject to further use in economy
Figure 1.1. The Throughput of Materials in the Economy
(Strom, 1988).
Residuals can be classified according to various criteria; for example, according to physical conditions and chemical composition or according to the effects of the discharges. The main type of residual are;
Material residuals; sol id
fluid
gaseous energy residuals; heat
noise
radiation. (Strom, 1988)
For the sake of simplicity the natural environment can be divided into recipients. The main types of recipient are air, land and water. It is presumed that the state of recipients can be described in
terms of certain measurable conditions, which we may call
environmental indicators. Examples of such indicators are;
- the oxygen content per volume unit of water; - the quantity of fish in a lake;
- the amount of bacteria per volume-unit of water; - the acidity of water measured in pH values; - visibility depths of water;
- the quantity of algae in water;
- concentrations of sulphur compounds, dust, carbon monoxide, mercury, lead and nitrogen compounds in the air;
- the number of birds within a certain area.
- the probability of contracting ailments such as bronchitis, asthma, lung cancer and thrombosis. (0. Vig. 1990)
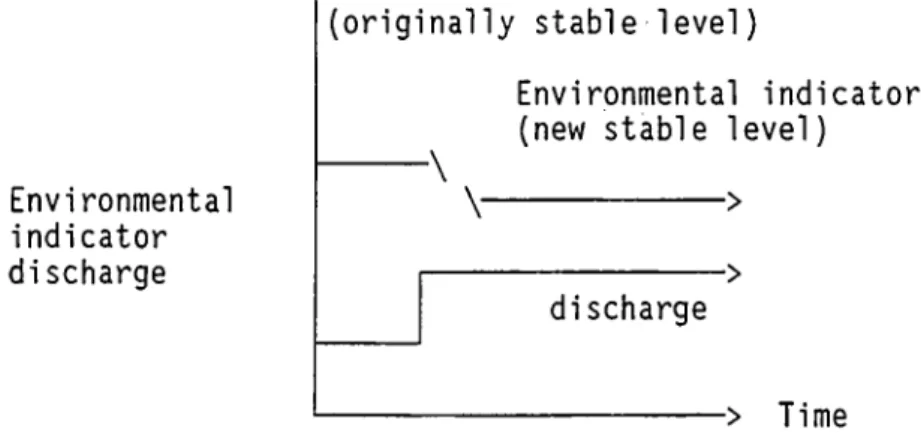
Under constant external conditions balance will occur in the
alterations in the factors involved in this balance will displace the equilibrium. The magnitude of this displacement will depend on the influence exercised by the factor in equilibrium oxygen, water and dissolved nutrients are factors included in the system that take the form of a more or less continuous supply. If the continuous supply of important materials is increased or reduced, some time will elapse
before equilibrium is reestablished. The observed environmental
indicators can often show a time variation, as illustrated in Figure 1.2.
(originally stable level)
Environmental indicator discharge
- \
Environmental indicator (new stable level)
V
->-> discharge
Time
Figure 1.2. Relationship between the level of the indicator and the stepwise changes in the discharges in the discharge of a residual. (J.Vig, 1990)
When the supply of residuals suddenly increases, some
organisms may after a while be reduced in number or possibly die out, while others will increase in number. If the external change is not excessive, a new equilibrium will be established. However, it is also possible to imagine that if the sudden increase is sufficiently great, then the decrease in the level of the indicator may be reduced to almost zero.
2.1.A. ECONOMIES OF ENVIRONMENTAL POLLUTION
One approach to an economic analysis might be to consider the natural environment as a form of production capital; nature 'produces' certain goods and services. In order to arrive at the principle problems involved, the services provided by nature can be divided into three main categories;
1. waste disposal services 2. extraction services
3. amenity services. (Portney, 1990).
Discharge of residuals from economic activities is countered by a waste disposal service provided by nature. The exploitation of substances existing in the natural environment, such as minerals, oil, forest, fish, water, oxygen, etc. is countered by extraction services. Amenity services, here intended in a very wide and comprehensive sense, may include everything from open air activities, angling, bathing, etc. to a aesthetic experiences.
Pollution means that discharge of residuals reduce the quality and scope of extraction and amenity services. Providing mechanisms that ensure effective utilisation of resources is one of the main tasks of the economic theory. In a free market the price mechanism plays a dominant role in the allocation of resources for various purposes. The question here is whether the negative effects of
pollution are reflected to a sufficient degree in the production cost of the goods and services responsible for this pollution. It can be concluded that negative effects of pollution have not been absorbed in the market system sufficiently, which means that economic activity creates negative effects that are not reflected in market prices. (Portney, 1990)
The principal economic solution to problems involving indirect effects as applied to problems of pollution may be said to involve the following:
1- finding the prices for waste disposal services
corresponding to the social marginal cost, measured in terms of
alternative use of the natural environment to supply us with
extraction and amenity services;
2- establishing systems so that decision making bodies take these prices into account. (Portney, 1990).
2.I.B. "TAXMAN COMETH" MODEL
Several models have been developed to determine the charges that a polluting establishment has to pay. "Taxman Cometh" is one of the models that determines charges of polluting firms, considering purification costs and environmental damage. It is assumed that the authorities have decided to impose effluent charges as a means of regulating the amount of pollution. The environmental protection authorities are in a position to measure conditions in the recipients
involved, and arrive at a charge that will give the environment in the recipient a desired quality. This system presupposes that firms respect the rules and regulations for effluent charges. If no supervision of any kind is exercised, firms will be in a position to evade charges by discharging more effluent that their own charge returns would warrant. For this reason the environmental protection authorities, as well as the tax authorities, are anxious to supervise the sources of discharge. It is also assumed that the authorities are not in a position to undertake continous measurements, either for economic or for technical reasons. The charge has to be pard for a period taken as a whole (Strom, 1988).
Two approaches available to the authorities in effecting a solution to the charge is considered:
1- the discharge amount for the entire year is estimated by making a random check on one of the days. The firm must then pay a charge equal to the result of the random check multiplied by 365 days.
2- Firms themselves submit reports on their daily discharge, either implicitly in the payment of an effluent charge, or explicitly in a return of charges to the authorities. A random check is carried out on one day, and the result is then compared with the information the firm has submitted in its effluent charge return. If there is no
agreement between the result of the discharge check and the
information, a penalty is imposed on the firm. (Strom, 1988)
A simple partial pollution model is introduced at this stage of the study. It can be assumed that a situation in which a number of factories or plants are discharging a residual that affects the condition of a recipient. The plant is described in terms of three relations: a cost function which tells how much it costs to produce the product in the cheapest possible way; a discharge function that acts as a link between production and the discharge of residual; and a purification cost function, which tells how much it costs to purify
(Strom, 1988).
It is assumed that the amounts firms wish to discharge every day in the course of a year, without any effluent charge, are given
and known magnitudes for each firm. These primary or maximal
discharges may, for example, be unambiguous functions of production levels every day in the course of a years. The firm's purification cost function could be defined as;
C. = C (Z. - d.) C' > 0, C (0) = 0
where is the given primary discharge in the subperiod; and d^ the
actual discharge to the recipient. The actual purification cost function is the same for all subperiods, while the given primary discharges and the actual discharges may vary from one sub-period to another. (Strom, 1988)
The social problem of adjustment is to minimise the firm's total purification costs and the community's environmental damage in the course of the year.
dl.... dn
i=l
= M. = N 1
Environmental damage is measured in a monetary unit by the function D (d^). Furthermore it is possible for the primary discharge level or output levels to be constant over a period of several days in the course of the year. The year is divided up into M. periods with the same primary discharge within each period. N is the number of days
(Strom, 1988).
Necessary optimum conditions are:
C'(Z. - d.) = D'(d.)
The marginal purification costs are therefore to be equal to the marginal damage for each period. Marginal damage may generally vary from one period to another. Only if the damage function were to prove linear the same marginal damage in each period is obtained. A common charge, t, in the course of the year can either be justified on this basis or because it has been institutionally decided that the charge must be the same for the whole year. The common rate of charge, t, can be defined as:
C'(Z. - d.) = t
Although this model is suitable for the purpose of this study, it is not possible to use it because purification costs of individual firms are not available.
3. MARINE POLLUTION IN TURKEY AND İZMİT BAY
3.1. PRESENT CONDITION OF MARINE AND COAST POLLUTION IN TURKEY
The total coastal line in Turkey is 8362 Km. in length. Mediterranean, Agean, Marmara and Black Sea constitute a major role in fishing and in marine transportation. (TÜBİTAK, 1984)
Industrial development, marine transportation, urbanization and.tourism have not obeyed the regulations set by the government. Coastal regions and bays have suffered the most from pollution caused by these developments. (TÜBİTAK, 1984)
2
Black Sea is 420.000 Km in surface area with an average depth of approximately 1300 m. The available data are only for phosphate and biological oxygen demand. Average value for BOD has been determined to be 0.95 mg/1. BOD values have been observed to be high near the
surface where as, lower values have been determined as depth
increased. Phosphate has been measured to be 0.0175 mg/lt at the surface and 0.225 mg/lt at deeper levels. BOD values have reached to high levels, where as phosphate level is normal. (TÜBİTAK, 1984)
In the Agean Coast the most polluted area is the Izmir Bay. Total length of the Agean coast is 2800 Km. Sources of pollution are the industrial establishments in Aliağa region and domestic wastes
from the city of İzmir. Also, wastes are carried through the rivers of
Meriç, Gediz and Büyük Menderes. The region is developed in
agriculture, and thus mercury content has reached to high levels due to utilization of pesticides. Nitrate concentration in İzmir Bay region has been determined to be 0.246 mg/lt. Sulphur and cadmium concentrations have been measured to be 0.008 mg/lt and 0.078 mg/lt respectively. All the measurements for nitrate, sulphur and cadmium show a normal level, according to the above results. (TÜBİTAK, 1984)
Mediterranean Sea is exposed to pollution due to the
industrial development of surrounding countries. Turkey is located in the north-east part of the region and is the major pollutant of the sea in this region. Between Taşucu and İskenderun coastal area, plants of textile, food, dye, pulp and fertilizer production exist. Total BOD, COD and phosphorus discharges annually are 133000, 513000, 19000 tons respectively. Those annual discharges indicate high amounts.
(TÜBİTAK, 1984)
Marmara Sea is the most chemically polluted inland sea in Turkey. The region is ecologically damaged since the sea is closed to currents for natural purification. In the past, wastes of İstanbul were discharged to the sea without purification, and as a consequence the pollution has reached high levels. 158000 tons of BOD and 370000 tons of COD are disposed only from Istanbul region annually. Those discharges indicate high amounts. İzmit Bay, which is the most polluted region in Marmara Sea is further examined in the next sections. (TÜBİTAK, 1984)
3.2. ENVIRONMENTAL PREVENTION FUND
In Turkey, "Environmental Pollution Prevention Fund" exists by the law No. 2782, that was enacted on August 11, 1983. The purpose of the fund is to support activities to prevent pollution and improve the existing conditions. In that 45 % of investment costs to prevent environmental pollution could be met by loans provided by the fund.
The establishments that cause environmental pollution should pay a contribution to the fund each month. The establishments are classified into five groups and each group is split into three categories as follows: (Official Gazette, Aug 11, 1983). However, no
rules or regulations exist that state the criteria used for
categorization.
ESTABLISHMENTS POLLUTING
ENVIRONMENT 1^^ DEGREE 2"^ DEGREE 3 DEGREE
Group 1 600.000 TL 400.000 TL 200.000 TL Group 2 400.000 TL 200.000 TL 100.000 TL Group 3 200.000 TL 100.000 TL 50.000 TL Group 4 100.000 TL 50.000 TL 25.000 TL Group 5 50.000 TL 25.000 TL 12.500 TL 16
The most polluting establishment should pay 600.000 TL each month. The criteria for the establishment's standing could not be determined from authorities or any law, since the collection of these amounts each month has never been applied in practice. As a first step the standing of each establishment is determined and then each month a fixed amount of contribution is collected according to the standing of the firm. These amount to be collected was published in the Environmental Law in August 11, 1983, as stated above.
3.3. POLLUTION IN İZMİT BAY
İzmit Bay, developing as the densest center of Industry in Turkey is being polluted at an increasing rate by domestic waste water, effluents and discharges from industrial premises, greasy wastes from ships; industrial gaseous wastes, and particle pollutants; eroded earth and organic pollutants introduced by the streams.
Pollutants have pronounced detrimental effects on the
environmental health and marine life as a consequence of the fact that İzmit Bay is closed to currents. A great water mass with approximately 20 Km in length, and 80 km surface area situated at the east of
Degirmendere-Yarimca line, has become an extremely dangerous
environment to marine life, and quite unsuitable region for camping and recreation of public. (TÜBİTAK, 1984)
In the past 3 decades, a very fast industrial development and a consequential regional population boom, have brought up a pollution
problem. This problem lead us to limit the use of natural resources, and more over endangered the human lives. Among the overall pollution problems throughout our country, the pollution of İzmit Bay, is the one which forces us to search for rapid solutions due to consequential threatining socio-economic dimensions. (TÜBİTAK, 1984)
The followings are the sources of pollution for İzmit Bay
1. Industrial Waste-water and effluents, 2. Domestic waste-waters,
3. Domestic and Industrial solid wastes, 4. Surface streams arriving to İzmit Bay, 5. Marine transportation throughout the Bay, 6. Surface water at the Bay,
7. İzmit Bay - Marmara Sea Interactions, 8. Air - Water interactions
A long term study had been conducted with the co-operation of
public and private sectors along with academic and scientific
institutions. (TÜBİTAK,1984)
As a result of this study;
a) The qualitative and quantitative diagnoses of pollutants have been concluded.
b) The cleaning and/or purification alternatives for each pollution source have been determined. Purification is here
meant in a general sense of utilizing all possibilities of. reducing primary and secondary discharges such as reducing
level of production, substitution of input factors,
installation of purification equipment and so on.
The remaining tasks are to constitute an action strategy and plan within the limits of laws and statutes. This action strategy and plan must be achieved with the co-operation of academic and scientific institutions, the authorised representatives of public and private sectors, and administration.
The Key-word in this stage is STANDARDS. The standard to be applied will bring clear understanding to the usage concept of the recipients.
3.3.A. THE BASES TO APPROACH TO WASTE-WATER DISCHARGE STANDARDS
The standards generally comprise the purification technology and its rank of applicability in local conditions. They have to be reviewed and renewed in the course of time by accounting the rehabilitation occurred in recipient media and socio-economic benefits and the economic liabilities brought-up by them.
As such:
"To enable the standards to have consistency and durability, according to the environmental-law number 2782, published in 1983, is
originated from the concept of differentiation of short and long term precautions. Thus, step by step standard applications will determine the realistic structure of the ultimate goal and will bring a meaning to the studies for observation and evaluation of the quality of the recipients"
The basic philosophy of the Environmental Law, is that the cost of all measures to protect environment, should not jeopardize the economical development efforts of the country. For this reason, the
standards to be proposed for the principles of environmental
protection, should envisage the cost of the investment and operation in such a way that, the investment and dispositon speed of industries suggested by the development plans of the country should be in a complete harmony. Only a system of step by step standards and a package of measures in tune with the development economy can be functional and realistic.
"The main task is an optimization of the investments to be
made for the rehabilitation of environmental quality through
implementation of standards, in such an acceleration that overall economy should not have negative impacts". (TÜBİTAK, 1993)
The sole control criterion during the success and the
restoration of the standards is to observe the recipients. The strategy to be applied for all surface waters, can not be isolated from the activities made on recipients.
It is worthwhile to defend the optimum timing of the purification facilities and more oven than that, a planning for the construction of individual and collective purification facilities.
3.3.B. THE APPROACH FOR INSPECTION OF THE INDUSTRIES DUE TO WASTES AND EFFLUENTS
The most important element in solving the pollution problem of İzmit Bay is the establishment of the regional and collective purification facilities through a canal system.
The industries which reduced their wastes and effluent to a certain level, will have monetary contribution to this approach. A realistic planning is extremely essential, since the time is the most
important element for the solution of the triangle of
Technology-Recources-Applicat ions.
On the other hand, a very significant pollution source in İzmit Bay is the discharges of the vessels. These discharges will be definitely forbidden and the control of these activities shall be given to Coast Guard organization.
The following improvements were recommended, in the TÜBİTAK 1984 study.
1. In the initial stage, the purification of the waste waters must be encouraged in regional collective purification
facilities. Such a solution can be suggested for Metal Industries in Gebze Region and Dilovasi.
2. The following improvements must be implemented by the industry and the inhabitants in order to minimize the pollution and cost of operations:
- Inter-process precautions (e.g. technology improvements), - Raw-Material modifications,
- Conservative water using practice,
- Re-cycling of used water and waste-reclaiming.
These aspects must be persuaded in a certain work-programme and their importance in industry must be emphasized. The scientific studies in these fields must be co-ordinated in an integrity.
3. The importance of advanced technology must be encouraged,
the design and construction of large purification
facilities in the area should be tendered to well
experienced infrastructure consulting and contracting
companies.
4. Special training programmes must be arranged in order to increase the number of personnel who will operate and control purification systems.
TÜBİTAK (1984) study also recommended that the government pollution standards should be enforced and followed up by the industries and the inhabitants.
4. DATA GATHERING, MODEL SPECIFICATION AND APPLICATION
4.1. DATA GATHERING
Major data used in this study are the loadings of wastes in volume, discharged to the sea by the establishments, and the cost of the cleaning up project for the eastern part of the bay.
The first contact was made with the director of the
environmental pollution prevention department at the Ministry of Environment, in November 1993. Required data, were not available at the ministry. We were advised to visit the local government and administration units in İzmit to collect the data, since each city in Turkey has its own unit responsible of environmental pollution. Furthermore, we were also told that data related to environmental pollution in that city, including the· financial aspects, are only available in the responsible units of that city's administration. Consequently, we were led to believe that there is no flow of
information from the individual units to the ministry.
Following the advise, an appointment was made with the director of the environmental pollution prevention unit in İzmit. Data about the wastes discharged by each company were not publicly available. The only data available was in the report prepared by TÜBİTAK in 1984. In this report wastes discharged by some of the establishments were listed. It was not possible to get information
about the costs of the cleaning up project, since this type of information is considered to be confidential, and is not open to public. After returning to Ankara contacts were made with the president of the Turkish Contractors Association. Through the help of this association, the name and the adress of the firm, Veziroglu
İnşaat, that won the bid of the cleaning project was obtained.
Veziroglu İnşaat, located in Ankara is an infrastructure
construction company. The personnel of the company were very helpful,
and they supplied us with the costs of the cleaning up project. They
have also provided us with a copy of the study on wastes discharged by the establishments in the eastern part of the bay, which was prepared
by TÜBİTAK in February 1993. Veziroglu İnşaat, had based its
feasibility study on the data available from this study.
As a final step an interview was done with Mr. Dogancan
Akyiirek who was the previous minister of Environment. We asked questions about the environmental regulations and charges that should be paid by pollutant establishments. However, Mr. Akyürek was not able to provide additional information. Furthermore, he believed that the industrial contributions should be cancelled.
4.2. INDUSTRIES WHICH NEED LOCAL INDIVIDUAL PURIFICATION FACILITIES
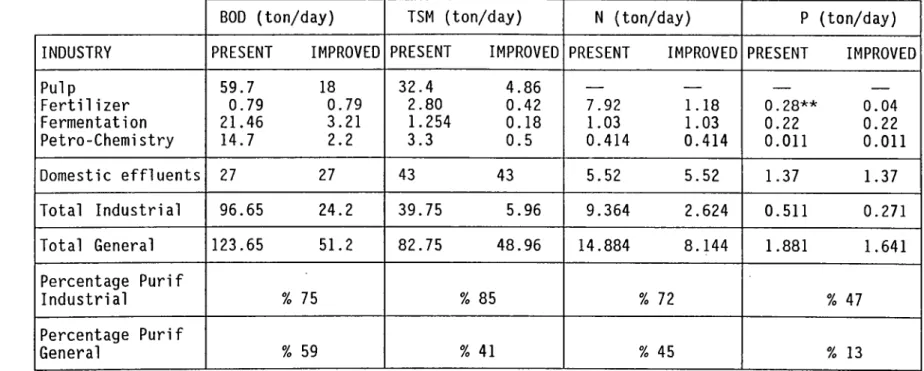
Table 1 shows the four significant pollutants (BOD, TSM, N, P) and present status of discharges in 1984.
TABLE 1. FOUR SIGNIFICANT POLLUTANTS AND STATUS OF DISCHARGES IN 1984 BOD = Biological oxygen demand
TMS = Total material suspended
N = Total nitrogen
P = Total phosphorus
PARAMETER SOURCE NORTH PART EAST PART SOUTH PART BAY
t*/day % t/day % t/day % t/day %
BOD Industry 78.72 80 22.36 92 0.78 1 0 1 0 1 . 8 6 78 Domestic 19.60 2 0 1.95 8 6 . 1 0 80 27.65 2 1 Drainage 0 . 1 0 0 0 . 0 0 0 0.77 1 0 0.87 1 TOTAL 98.42 75 24.31 16 7.65 6 130.38 1 0 0 TSM Industry 60.19 56 6.31 58 1.26 1 67.76 31 Domestic 29.60 27 2.90 27 9.30 1 0 41.80 2 0 Drainage 18.42 17 1.05 15 85.94 89 106.02 49 TOTAL 108.21 50 1 0 . 8 6 5 96.50 46 215.58 1 0 0 N Industry 8.79 69 2.13 84 0 . 0 1 1 10.93 65 Domestic 3.95 31 0.40 16 1.24 8 6 5.59 33 Drainage 0.04 0 0 . 0 0 0 0.19 13 0.23 2 TOTAL 12.78 76 2.53 15 1.44 9 16.75 1 0 0 P Industry 0.43 30 0.19 6 6 0 . 0 0 0 0.62 31 Domestic 0.99 70 0 . 1 0 34 0.29 94 1.38 6 8 Drainage 0 . 0 0 0 0 . 0 0 0 0 . 0 2 6 0 . 0 2 1 TOTAL 1.42 70 0.29 14 0.31 16 2 . 0 2 1 0 0
Source: İzmit Körfezi'nde Kirlenmenin Önlenmesi ve Giderilmesine Yönelik Çözüm Önerileri, Tübitak, March, 1984
*: tons
Table 2 represents a comparison of domestic effluents with improved stage of effluents of primary industries. The significance of domestic effluents can be seen after the improvement of prime
industrial effluents. The improvements include; inter process
precautions, raw material modifications, conservative water using practice, recycling of used water and waste redaiming.
TABLE 2. A NEW PROFILE AFTER IMPROVEMENTS IN THE INDUSTRIES
WHICH NEED LOCAL-INDIVIDUAL PURIFICATION SYSTEMS
PROPOSED BY TÜBİTAK 1984 STUDY
BOD (ton/day) TSM (ton/day) N (ton/day) P (ton/day)
INDUSTRY PRESENT IMPROVED PRESENT IMPROVED PRESENT IMPROVED PRESENT IMPROVED
Pulp 59.7 18 32.4 4.86 — — — _____ Fertilizer 0.79 0.79 2.80 0.42 7.92 1.18 0.28** 0.04 Fermentation 21.46 3.21 1.254 0.18 1.03 1.03 0 . 2 2 0 . 2 2 Petro-Chemi stry 14.7 2 . 2 3.3 0.5 0.414 0.414 0 . 0 1 1 0 . 0 1 1 Domestic effluents 27 27 43 43 5.52 5.52 1.37 1.37 Total Industrial 96.65 24.2 39.75 5.96 9.364 2.624 0.511 0.271 Total General 123.65 51.2 82.75 48.96 14.884 8.144 1.881 1.641 Percentage Purif Industrial 5i 75 ?i 85 ?i 72 % 47 Percentage Purif General ?i 59 9i 41 9i 45 % 13
Source: İzmit Körfezi'nde Kirlenmenin Önlenmesi ve Giderilmesine Yönelik Çözüm Önerileri, Tübitak, March, 1984
All the industrial effluents other than the industrial effluents indicated above shall be considered as domestic effluents.
The residential domestic effluents will need effective cesspit systems while the industrial domestic effluents will need first stage
purification system i.e. neutralization, fat-elimination,
sedimentation. First stage purification systems should be constructed by industrial establishments themselves.
The followings are the proposed quality of domestic effluents:
Temperature : 30“ BOD : 150 mg/1 TSM : 50 mg/1 NH3 -N : 40 mg/1 T-PO4 : 1 0 mg/ 1 Total CN : 1 . 0 mg Heavy Metals (Pb,Cv, Ni, Cd, Zn,Cr, As) Total Heavy Metals Detergents Toxicity PH Fat-Grease 1 . 0 mg/ 1 per each 5 mg/1 1 0 mg/ 1 1 . 0 6-9 30 mg/1. (TUBiTAK, 1993) 27
4.3. CLEANING UP PROJECT FOR EASTERN PART OF İZMİT BAY
The cleaning project used in this thesis is prepared by Veziroglu İnşaat. The project consists of the installation of four plants. The plants could be listed as follows;
- Inciniration plant
- Waste water purification plant - Collector
- Solid waste depositing plant {Veziroglu İnşaat, 1994).
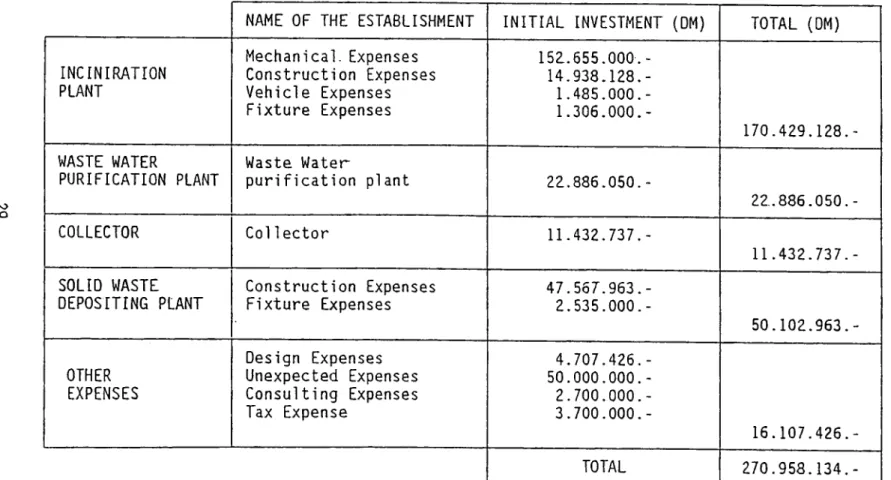
Both domestic and industrial wastes are to be treated through the plants stated above. Initial investment costs are given in Table 3. Total cost for the project is D.M. 270.985.134. Approximate waste
3 3
flow to the bay is determined to be 21000 m /day. 15000 m consists of 3
industrial waste water, and the remaining 6000 m consists of domestic waste water (Veziroglu İnşaat, 1994).
Major assumptions made after the project is in life are as fol1 ows:
- Each firm should have its individual purification facility. The firm should construct its individual plant and spend additional money, in addition to the contribution that it should pay for the project.
TABLE 3. INITIAL INVESTMENT TABLE
NAME OF THE ESTABLISHMENT INITIAL INVESTMENT (DM) TOTAL (DM)
INCINIRATION PLANT Mechanical. Expenses Construction Expenses Vehicle Expenses Fixture Expenses 15E.655.000.- 14.938.128.1.485.000. 1.306.000. - 170.429.128.-WASTE WATER PURIFICATION PLANT Waste Water purification plant 22.886.050.-COLLECTOR Collector 11.432.737.-SOLID WASTE DEPOSITING PLANT Construction Expenses Fixture Expenses 47.587.963.- 2.535.000.- 50.102.963.-OTHER EXPENSES Design Expenses Unexpected Expenses Consulting Expenses Tax Expense 4.707.426.- 50.000.000.2.700.000. 3.700.000. - 16.107.426.-TOTAL 270.958.134.-PO L Û
- The waste water that is going to be treated in the main purification plant should first be treated in the individual purification plant.
- Life of purification facilities is 25 years.
- The individual purification plants should work 24 hours per day (Veziroglu İnşaat, 1994).
- The following limits should be obtained after the individual treatment.
Parameters Limit (mg/1)
Biochemical Oxygen Demand (BOD) 250
Chemical Oxygen Demand (COD) 800
Total Suspended Solid Material (TMS) 350
Total Nitrogen (N) 40
(Official Gazette, Sept. 4, 1988)
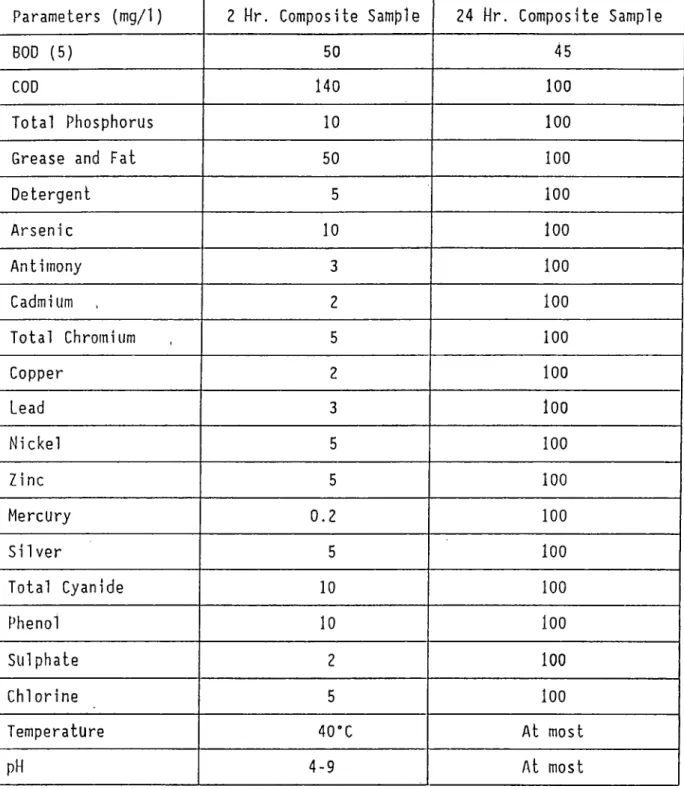
The water that is going to be discharged to the bay after the final treatment, should meet the following standards in Table 4, that was published on September 4, 1988 according to the "Water Pollution Control Regulation".
TABLE 4. STANDARDS STATED BY "WATER POLLUTION PREVENTION REGULATION" SEPT. 4, 1988
Parameters (mg/1) 2 Hr. Composite Sample 24 Hr. Composite Sample
BOD (5) 50 45
COD 140 1 0 0
Total Phosphorus 1 0 1 0 0
Grease and Fat 50 1 0 0
Detergent 5 1 0 0 Arsenic 1 0
l o o
Antimony 3l o o
Cadmium 2l o o
Total Chromium 5 1 0 0 Copper 2l o o
Lead 3l o o
Nickel 5 1 0 0 Zinc 5 1 0 0 Mercury 0 . 2 1 0 0 Sil ver 5l o o
Total Cyanide 1 0 1 0 0 Phenol 1 0l o o
Sulphate 2loo
Chlorine 5l o o
Temperature 40’C At most pH 4-9 At mostSource: Water Pollution Control Regulation, Sept. 4, 1988..
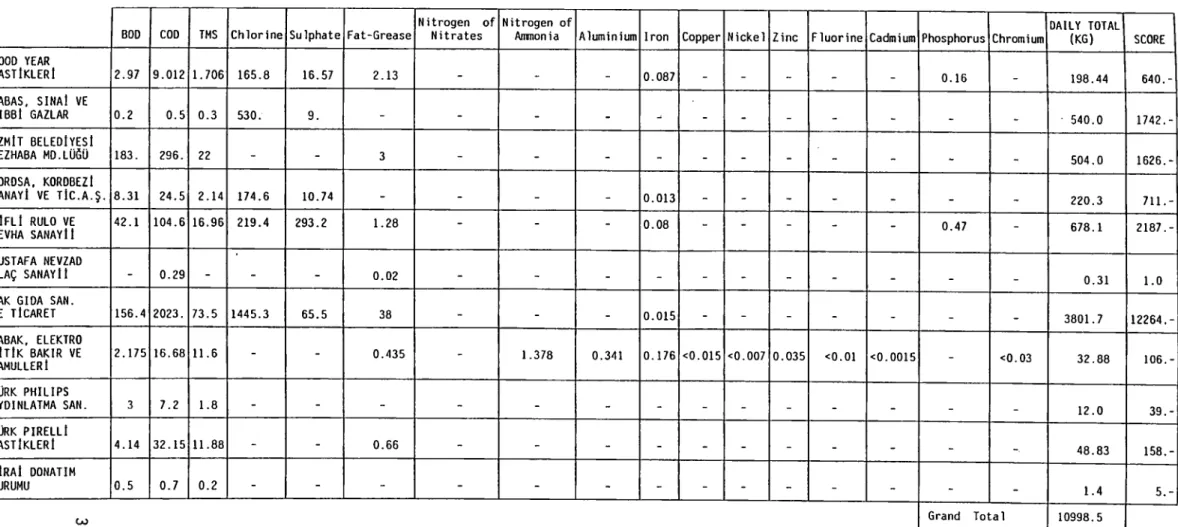
A ranking of polluting establishments have been obtained by adding total pollution loads in volume of each parameter for each establishment. The data have been obtained from the "Improvement Study of the east part of İzmit Bay", TÜBİTAK, 1993. Table 5. shows total daily discharge of each establishment and their scale.
Table 6 is a rearrangement of Table 5. Ranking is obtained
from the most to the least polluting. Since, MUSTAFA NEVZAT İLAÇ SANAYİ is the least polluting (0.31 kg/day) it is taken to be as the reference. It is assumed that Mustafa Nevzat İlaç Sanayi, scores one, the score of the other establishments could be determined accordingly. 4,4. RANKING OF ESTABLISHMENTS
TABLE 5. EAST PART OF İZMİT BAY POLLUTING INDUSTRIAL ESTABLISHMENTS AND TOTAL DISCHARGE LOADS (KG/DAY) FEBRUARY. 1993
BOD COD TMS Chlorine Sulphate Fat-Grease Nitrogen of Nitrates Nitrogen of AiTinonia Aluminium Iron Copper N ickel Zinc Fluorine Cadmium Phosphorus Chromium DAILY TOTAL (KG) SCORE
BASTAŞ, BİRLEŞİK AYDINLATMA SANAYİİ 19 48 12.6 14.4 1.6 0.04 - - - - - - - - - - - 95.64 309.-BEKSA, SANAYİ VE TİC. 0.61 2.95 8.82 372.4 8 0.103 0.107 0.140 0.044 2.361 0.174 0.04 1.856 - - - - 392.15 1265.-BRISA, SABANCI LASTİK SANAYİİ 27.92 55.6 36.0 103.8 0.5 1.043 - - - 0.169 - - - - - - - 244.97 790.-ÇELİK HALAT VE TEL SANAYİİ - 6 6 - - < 1.2 - 0.135 - 0.585 0.18 0.05 1.56 0.06 0.06 - - 15.83 51.-ÇELİKORD A.Ş. - 7.26 6.99 - 1092 - 6.9 - - 0.32 - - - - - - - 1113.5 3592.-DETAŞ, AMBALAJ VE kimya SANAYİİ 2.875 2.25 0.175 0.950 0.6 - - - - 0.30 - - - - - 0.016 - 7.166 23.-DEVLET SU İŞLERİ 15.ŞUBE MD.LÜĞÜ 3 9 7 - - - - - - - - - - - - 19.0 61.-DUŞA, ENDÜSTRİ EL İPLİK SANAYİİ VE TİC. A.Ş. 8.91 15.31 1.1 145.8 10.85 0.68 0.18 - - 0.04 - - - - - - - 182.87 590.-FURSAN, FERMENTASYON ÜRÜNLERİ 373.7 1723.3 416.9 1342.2 27.9 5.36 _ - _ 0.02 - _ _ . . _ 0.04 3889.4 12546.-co Sub Total 5960.5
TABLE 5. CONTINUATION
BOD COD TMS Chlorine Sulphate Fat-Grease Nitrogen of Nitrates Nitrogen of Aimionia Aluminium Iron Copper Nickel Zinc Fluorine Cadmium Phosphorus ChromiumDAILY TOTAL (KG) SCORE
GOOD YEAR LASTİKLERİ 2.97 9.012 1.706 165.8 16.57 2.13 - - - 0.087 - - - - - 0.16 - 198.44 640.-HABAS, SINAİ VE TIBBİ GAZLAR 0.2 0.5 0.3 530. 9. - - - - - - _ • 540.0 1742.-İZMİT BELEDİYESİ MEZHABA MD.LÜĞÜ 183. 296. 22 - - 3 - - - - 504.0 1626.-KOROSA, KOROBEZİ SANAYİ VE TİC.A.Ş. 8.31 24.5 2.14 174.6 10.74 - - - - 0.013 - - - _ _ _ _ 220.3 711.-LİFLİ RULO VE LEVHA SANAYİİ 42.1 104.6 16.96 219.4 293.2 1.28 - - - 0.08 - - - - - 0.47 - 678.1 2187.-MUSTAFA NEVZAD İLAÇ SANAYİİ - 0.29 - - - 0.02 - - - - - _ 0,31 1.0 PAK GIDA SAN.
VE TİCARET 156.4 2023. 73.5 1445.3 65.5 38 - - - 0.015 - - - _ 3801.7 12264.-RABAK, ELEKTRO LİTİK BAKİR VE MAMULLERİ 2.175 16.68 11.6 - - 0.435 - 1.378 0.341 0.176 <0.015 <0.007 0.035 <0.01 <0.0015 - <0.03 32.88 106.-TÜRK PHILIPS AYDINLATMA SAN. 3 7.2 1.8 - - - 12.0 39.-TÜRK PIRELLİ LASTİKLERİ 4.14 32.15 11.88 - - 0.66 - - - -48.83 158.-ZİRAİ DONATIM KURUMU 0.5 0.7 0.2 - - - - - - - 1.4 5.-L O Grand Total 10998.5
TABLE 6. RANKING OF ESTABLISHMENTS
NAME OF THE ESTABLISHMENT COMPERATIVE SCORING OF POLLUTANTS
1. FURSAN 12546 2. PAK GIDA 12264 3. ÇELÎKORD A.Ş. 3592 4. LİFLİ RULO 2187 5. HABAŞ 1742 6 . İZMİT MEZBAHA 1626 7. BEKSA 1265 8 . BRISA 790 9. KORDSA 711 10. GOOD YEAR 640 11. DUŞA İPLİK 590 12. BASTAŞ 309 13. TÜRK PIRELLİ 158 14. RABAK 106 15. DEVLET SU İŞLERİ 61 16. ÇELİK HALAT 51 17. TÜRK PHILIPS 39
18. DETAŞ AMBALAJ KİMYA 23
19. ZİRAT DONATIM 5
20. MUSTAFA NEVZAD 1 (REFERENCE)
TOTAL SCORE 38,706
The cost of collective purification facilities to be established is DM. 270.958.134 As the marine pollution is considered in this study the initial investment costs of the collector and waste water purification plant is to be considered. The total cost of the
initial investment of the two items from Table 3 is DM. 34.318.787.
4.5. MODEL SPECIFICATION AND APPLICATION
4.5. A. TOTAL CONTRIBUTION COST OF EACH ESTABLISHMENT
The purpose of the study is to design an allocation scheme to determine the contribution of each establishment to the cleaning up cost of the bay, two scenarios are developed and compared at this stage. In the first scenario of the first model, establishments should pay the complete amount of the proposed contributions. In the second
scenario, proposed contributions should be paid 75% by the
establishments and 25% by the tax payers. In the second model, which is going to be explained in the next section, contributions per parameter for each establishment are determined.
To proceed with the model, we should assign the companies to certain groups as stated on page 16. The law is not clear on the rules for assigning the companies to certain groups. In this study all establishments are assumed to be in Group 1. A subcategorization is assumed as follows:
1000 > TOTAL DISCHARGE > 500 (kg/day) Degree 2
TOTAL DISCHARGE < 500 (kg/day) Degree 3
The rates that were given on page 16 are to be collected each month. According to a recent information obtained from the Ministry of Environment, the rates that are to be collected each month are being revised.
Based on the assumptions and the existing rates the charges for each establishment are calculated and presented in Table 7.
TOTAL DISCHARGE > 1000 (kg/day) Degree 1
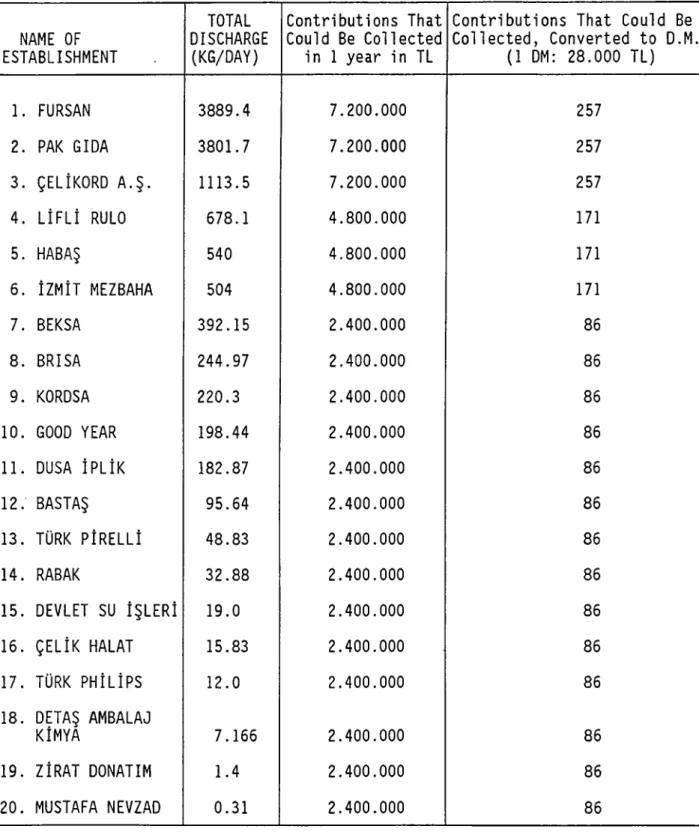
TABLE 7. TOTAL DISCHARGES AND CONTRIBUTIONS THAT COULD BE COLLECTED ANNUALLY NAME OF ESTABLISHMENT TOTAL DISCHARGE (KG/DAY) Contributions That Could Be Collected in 1 year in TL
Contributions That Could Be Collected, Converted to D.M. ( 1 DM: 28.000 TL) 1. FURSAN 2. PAK GIDA 3. ÇELİKORD A.Ş. 4. LİFLİ RULO 5. HABAŞ 6. İZMİT MEZBAHA 7. BEKSA 8. BRISA 9. KORDSA 10. GOOD YEAR 11. DUŞA İPLİK 12. BASTAŞ 13. TÜRK PİRELLİ 14. RABAK 15. DEVLET SU İŞLERİ 16. ÇELİK HALAT 17. TÜRK PHİLİPS 18. DETAŞ AMBALAJ KİMYA 19. ZİRAT DONATIM 20. MUSTAFA NEVZAD 3889.4 3801.7 1113.5 678.1 540 504 392.15 244.97 220.3 198.44 182.87 95.64 48.83 32.88 19.0 15.83 1 2 . 0 7.166 1.4 0.31 7.200.000 7.200.000 7.200.000 4.800.000 4.800.000 4.800.000 2.400.000 2.400.000 2.400.000 2.400.000 2.400.000 2.400.000 2.400.000 2.400.000 2.400.000 2.400.000 2.400.000 2.400.000 2.400.000 2.400.000 257 257 257 171 171 171 86 86 86 86 86 86 86 86 86 86 86 86 86 86 38
If the life of purification facilities is 25 years, the installation cost for one year is DM. 34.318.787 /25 which is DM. 1.372.752. If the operation and maintenance cost is assumed to be 30 % of this amount, then the total annual cost will be DM. 1.784.578. Since, reference firm is MUSTAFA NEVZAD İLAÇ SANAYİ, the amount this firm has to pay is DM. 1.784.578 / 38.706 = DM. 35.47.
If similar calculations are done, costs allocated for each
establishment can be determined. Table 8 presents a comparison of
annual costs allocated for each establishment and legally collectible annual amounts. Percentage that could be met from the prevention fund
for annual project cost is also presented in Table 8 .
TABLE 8 . COSTS ALLOCATED (SCENARIO
PREVENTION FUND
1), LEGALLY COLLECTIBLE AMOUNTS AND PERCENTAGE THAT COULD BE MET FROM THE
NAME OF ESTABLISHMENT COST ALLOCATED IN DM. FOR 1 YEAR SCENARIO 1 LEGALLY COLLECTIBLE AMOUNT IN 1 YEAR (DM.)
PERCENTAGE THAT COULD BE MET FROM THE PREVENTION FUND FOR ANNUAL
PROJECT COST OF DM. 34.318.787 1. FURSAN 445000 257 0.00057 2. PAK GIDA 435000 257 0.00059 3. ÇELÎK0RD A.Ş. 127408 257 0 . 0 0 2 0 4. LİFLİ RULO 77573 171 0 . 0 0 2 2 5. HABAŞ 61788 171 0.00276 6 . İZMİT MEZBAHA 57674 171 0.00296 7. BEKSA 44870 8 6 0.00191 8 . BRISA 28021 8 6 0.00306 9. KORDSA 25220 8 6 0.0034 10. GOOD YEAR 22700 8 6 0.00378 11. DUŞA İPLİK 20297 8 6 0.00424 12. BASTAŞ 10960 8 6 0.00785 13. TÜRK PİRELLİ 5604 8 6 0.0154 14. RABAK 3760 8 6 0.0228 15. DEVLET SU İŞLERİ 2164 8 6 0.0397 16. ÇELİK HALAT 1809 8 6 0.0475 17. TÜRK PHİLİPS 1384 8 6 0.0621
18. DETAŞ AMBALAJ KİMYA 816 8 6 0.105
19. ZİRAT DONATIM 177 8 6 0.48
20. MUSTAFA NEVZAD 35.47 8 6 2.42
-P!·
According to the above calculations, to meet the contribution of each establishment to the annual cost of DM. 34.318.787 the amount collected for each firm in the prevention fund is not sufficient except for Mustafa NEVZAD İLAÇ SANAYİ and partly for Ziraat Donatım and Detaş Ambalaj.
4.5.B. CONTRIBUTION COST OF EACH ESTABLISHMENT WHEN THE TAX-PAYER CONTRIBUTES AS WELL
In the first scenario allocation scheme of the establishments were developed by assuming that te complete amount of proposed payments were done by the establishments themselves. In the second scenario we assume that 75% of DM. 34.318.787 can be paid by the owners of the industrial establishments. Remaining 25 % of this amount can be met from the government since these industries are helping the Turkish economy and the inhabitants indirectly.
75 % of DM. 34.318.787 to be paid by the industries is DM. 25.739.090 As the life of the purification facilities was assumed to be 25 years, the installation cost for one year is DM. 1.029.563 If the operation and maintenance cost is assumed to be 30 % of this amount, then amount to be paid will be DM. 1.338.432.
As the reference is MUSTAFA NEVZAT İLAÇ SANAYİ the amount that should be paid by the firm must be DM. 1.338.432/38.706 = DM. 34.58 in the first year. Due to an average 5 % inflation level in DM. currency
(CITIBANK, 1994), MUSTAFA NEVZAD İLAÇ SANAYİİ has to pay DM. 34.58x1.05=DM.36.309 in the second year and so on.
Table 9 presents the proposed amounts to be paid by each establishment when the cost is allocated 75% to the establishments and 25% to the inhabitants. Also, a comparison of the two scenarios is available in Table 9.
TABLE 9. COST ALLOCATION FOR SCENARIO 2 AND A COMPARISON WITH SCENARIO 1
NAME OF ESTABLISHMENT
COST ALLOCATED IN THE FIRST YEAR (DM.)
SCENARIO 2
COST ALLOCATED IN THE FIRST YEAR (DM.) SCENARIO 1 1. FURSAN 432837 445000 2. PAK GIDA 423108 435000 3. ÇELİK0RD A.Ş. 123924 127408 4. LİFLİ RULO 75452 77573 5. HABAŞ 60099 61788 5. İZMİT MEZBAHA 56097 57674 7. BEKSA 43643 44870 8 . BRISA 27335 28021 9. KORDSA 24530 25220 10. GOOD YEAR 22080 22700 11. DUŞA İPLİK 20355 20297 12. BASTAŞ 10661 10960 13. TÜRK PİRELLİ 5451 5604 14. RABAK 3657 3760 15. DEVLET SU İŞLERİ 2105 2164 16. ÇELİK HALAT 1760 1809 17. TÜRK PHİLİPS 1346 1384
18. DETAŞ AMBALAJ KİMYA 794 816
19. ZİRAAT DONATIM 173 177
20. MUSTAFA NEVZAD 34.5 35.47
When two scenarios are compared it can be concluded that there is not a significant difference with respect to the cost allocations. Both methods could be applied, but the first scenario is more
realistic, since the major pollutants are the industrial
establishments.
4.5.C. CONTRIBUTION COSTS PER PARAMETER FOR EACH ESTABLISHMENT
In the second method it is possible to be more specific in determining the contributions to cleaning up costs. Table 10 shows the total discharge of each parameter in kg/day and the percentages of each parameter. Cleaning cost of each parameter is obtained by multiplying total cleaning cost (DM. 34, 318, 787) by the percentages. Annual cost per parameter is the division of the value obtained above, by 25.
Proceeding with the calculations, there is need for the percentages of each parameter for every establishment. Table 11 gives the list of the percentages of each parameter for every firm. By multiplying the percentages of each parameter obtained in Table 11
with the annual cleaning up cost per parameter in Table 1 0 cleaning up
cost per parameter for each establishment is obtained as listed in Table 12.
TA BLE IQ LOADING AND CLEANING COSTS FOR EACH PARAMETER 2 (A) TOTALBOO TOTALCOO TO TA L TMS TO TAL CHLORINE TO TA L SULPHATE TO TA L OTHERS TO TA L DAILY (B) Loading per parameter 338.81 Kg/day 4384.5 Kg/day 637,671 Kg/day 4514.65- Kg/dav 1536.46 Kg/dav ______ 72.1 Kg/day 11983.991 Kg/dav (C) of parameters 0.0700 0.3653 0.0532 0.3767 0.1282 0.0060 ( D ) Cleaning cost o f each parameter 2402116.434 12555404.78 1826110.786 12928590.59 4399990.243 206474.1656
1. Row 1, Column (C) => Rowl / Row7
2. Row 1. Column (D) => 34318787* Rowl / Row7 J . Column (E) = Column(D) / 25
4·. Others => Fat-crease. Nitrogen o f Nitrates, Nitrogen of Ammonia, Aluminum, Iron, Copper, Nickel, Zinc, Fluorine. Cadmium, Phosphorus, Chromium
5. Th e useful life o f waste w a te r purification plant and the collector is assumed to be 25 years
(E)
Cleaning cost of each parameter annually 96,084.6574 502,216.1911 73,044.4314 517,147.6238 175,999.6097 8,258.9668
FABLE ] I·PERCENTAGES OF PARAMETERS FOR EACH ESTABLISHMENT
4^» CJl
TABLEI 2 CLEANING UP COSTS PER PARAMETER FOR EACH ESTABLISHMENT (DM)
BOD(DM) COD (DM) TMS (DM) CHLORINE (DM) SULPHATE (DM) OTHERS(DM) TOTAL (DM)
BASTAS 2,176.4267 5,498.3387 1,443.3146 1.649.5023 183.2780 4.5814 10,955.4418 BEKSA 69.8748 337.9187 1.010.3202 42.657.9635 916.3902 552.6365 45,545.1039 BRISA 3.198.2018 6,368.9089 4,123.7559 11.890.1628 57.2744 138.8177 25,777.1215 CELIK HALAT 0.0000 687.2923 687.2926 0.0000 0.0000 438.6731 1,813.2581 CELIKORD A.S. 0.0000 831.6237 800.6959 0.0000 125.087.2615 826.9504 127,546.5316 DETAS 329.3277 257.7346 20.0460 108.8213 68.7293 36.1934 820.8524 DSI 343.6463 1,030.9385 801.8414 0.0000 0.0000 0.0000 2,176.4262 DUSA İPLİK 1,020.6296 1,753.7409 126.0037 16.701.2113 1.242.8542 103.0825 20,947.5221 FURSAN 42,806.8769 197.401.8127 47,755.3840 153,747.3648 3,195.9108 620.7855 445,528.1347 GOOD YEAR 340.2099 1,032.3131 195.4202 18.992.1868 1,898.0732 272.2522 22,730.4553 HABAS 22.9098 57.2744 34.3646 60,710.8504 1,030.9390 0.0000 61.856.3381 İZMİT MEZBAHA 20.962.4257 33,906.4217 2,520.0730 0.0000 0.0000 343.6082 57,732.5286 KORDSA 951.9003 2.806.4437 245.1344 20,000.2160 1,230.2538 1.4890 25.235.4372 LİFLİ RULO 4,822.5034 11,981.7963 1.942.7472 25,132.0011 33,585.7006 209.6010 77,674.3496 MUSTAFA NEVZAO 0.0000 33.2191 0.0000 0.0000 0.0000 2.2907 35.5099 PAK GIDA 17,915.4283 231,732.0647 8,419.3349 165,557.3435 7,502.9447 4,354.0885 435,481.2046 RABAK 249.1436 1,910.6727 1,328.7658 0.0000 0.0000 278.3226 3.766 9047 TURK PHILIPS 343.6463 824.7508 206.1878 0.0000 0.0000 0.0000 1,374.5849 TURK PIRELLI . 474.2319 3,682.7414 1,360.8394 0.0000 0.0000 75.5938 5 593 4066 ZİRAAT DONATIM 57.2744 80.1841 22.9098 0.0000 0.0000 0.0000 160.3682
Cleaning up cost - Percentage in TABLE VIII * Cleaning up cost in TABLE VII.
In the first model, contribution costs for each establishment
were allocated. In the second model, contribution costs were
allocated with respect to the parameters. Both models yield
approximately the same proposed annual payments. The second model is more accurate, since it is possible to assign costs for each parameter.
5. CONCLUSION
The purpose of the study is to design an allocation scheme to determine the contribution of each establishment to the cleaning up
cost of the bay. Two models were developed to determine the
contributions. In the first model, contribution costs were allocated for each establishment. Two scenarios were developed in the first model. According to the first scenario, the complete amount of the proposed payment should be paid by the establishment, where as in the
second scenario annual costs allocated should be paid 75% by
establishments and 25% by inhabitants. In the second model annual costs are allocated per parameter for each establishment.
The firms should be forced to pay their proposed contributions by the end of each year. The value of 1 DM. is estimated to be TL 28 000 {1994, Dec. Central Bank of Republic of Turkey). Accordingly, Mustafa Nevzad İlaç San. will have to pay TL. 966.000 where as FURSAN has to pay TL. 1 2 .0 0 0 .0 0 0 .0 0 0 . Each proceeding year, these payments
could be increased according to the inflation rate if necessary.
When the total of cleaning up costs per parameter for each establishment from Table 12 are compared with the costs obtained from
Table 8 on page 40. It can be concluded that results turns out to be
approximately the same as presented in Table 13.