Relationships among retropalatal airway, pharyngeal length, and craniofacial
structures determined by magnetic resonance imaging in patients with
obstructive sleep apnea
Article in Sleep and Breathing · March 2019DOI: 10.1007/s11325-018-1667-x CITATIONS 3 READS 123 5 authors, including:
Some of the authors of this publication are also working on these related projects:
Studies on internal and external parasites of wild horses in Konya provinceView project
Left Censoring DataView project Suat Avci Baskent University 26PUBLICATIONS 166CITATIONS SEE PROFILE Erdinc Aydin Baskent University 99PUBLICATIONS 584CITATIONS SEE PROFILE
Mustafa Agah Tekindal Izmir Katip Celebi Universitesi 157PUBLICATIONS 545CITATIONS
SEE PROFILE
All content following this page was uploaded by Mustafa Agah Tekindal on 29 May 2018. The user has requested enhancement of the downloaded file.
SLEEP BREATHING PHYSIOLOGY AND DISORDERS• ORIGINAL ARTICLE
Relationships among retropalatal airway, pharyngeal length,
and craniofacial structures determined by magnetic resonance imaging
in patients with obstructive sleep apnea
Suat Avci1 &Hatice Lakadamyali2&Huseyin Lakadamyali3&Erdinc Aydin1&Mustafa Agah Tekindal4
Received: 31 May 2017 / Revised: 18 April 2018 / Accepted: 20 April 2018 # Springer International Publishing AG, part of Springer Nature 2018 Abstract
Background The integration of anatomical and nonanatomical parameters will improve our ability to predict the outcomes of OSA treatment. Currently, no standardized, quantitative classification of upper airway anatomical traits is available. The retropalatal (RP) airway is the most important area to consider when planning anatomical treatment. However, current evaluation methods feature qualitative conventional endoscopy. Here, we describe a quantitative magnetic resonance imaging (MRI) method used to classify RP airway patterns.
Methods We recruited 117 males; 20 simple snorers and 97 patients with OSA. Lateral/anteroposterior ratios were calculated in three parallel planes and RP patterns were classified accordingly. Lateral wall soft tissue structures, skeletal dimensions representing those planes, pharyngeal lengths, and skeletal and vertical axis ratios were also measured.
Results Both the cross-sectional area at the hard palate level and the RP lateral dimension were associated with OSA. OSA patients had longer pharynges than controls. The oblique pattern was associated with narrow lateral dimensions. The vertical pattern was associated with a narrow nasopharynx but a longer pharynx. The airway ratio at the hard palate level and the skeletal ratios of all three planes were negatively correlated with the vertical axis ratio and together explained 40.8% of the variance in the vertical axis ratio.
Conclusions The data suggest that anatomical imbalances between the craniofacial skeletal and soft tissue structures affect pharyngeal airway morphology in all three dimensions. The dimensions of the nasopharynx, the cross-sectional area at the hard palate level, and pharyngeal length were associated not only with the RP patterns but also with OSA severity. This study affords insights into upper airway anatomy and RP patterns and may help diagnose OSA patients and aid in the selection of an appropriate therapy.
Keywords Sleep apnea . Airway . Quantitative retropalatal classification . Three-dimensional magnetic resonance imaging . Craniofacial structures
Introduction
Obstructive sleep apnea (OSA) is characterized by the recur-rent partial or complete collapse of the upper airway during sleep. This causes intermittent hypoxemia, hypercapnia, and
frequent cortical arousals [1]. Multiple features orBphenotypic
traits^ contribute to the pathogenesis of OSA. These include anatomical traits (a narrow/crowded/collapsible upper airway) and nonanatomical traits (waking up too easily during airway narrowing [a low respiratory arousal threshold], ineffective or reduced pharyngeal dilator muscle activity during sleep, and
unstable ventilatory control [high loop gain]) [2,3].
Presented at the 38th Turkish National Congress of Otorhinolaryngology and Head & Neck Surgery, Antalya, Turkey, October 27, 2016. * Suat Avci
Department of Otolaryngology-Head and Neck Surgery, Baskent University, Ankara, Turkey
2
Department of Radiology, Baskent University, Ankara, Turkey 3
Department of Chest Disease, Baskent University, Ankara, Turkey 4
Department of Biostatistics, Faculty of Veterinary Medicine, Selcuk University, Konya, Turkey
Although OSA is thus a heterogeneous disorder, a prereq-uisite for OSA development is a certain level of anatomical
compromise/increased upper airway collapsibility [4].
Compared to those who do not have OSA, those with OSA generally have a smaller-diameter, longer, oval upper airway
[5]. OSA treatment has traditionally targeted anatomical traits,
and includes continuous positive airway pressure (CPAP), the placement of oral appliances, upper airway surgery, weight loss, and positional therapy. Such therapies are either often poorly tolerated (e.g., CPAP), difficult to perform (e.g., weight loss), or of variable and unpredictable efficacy (e.g., oral
ap-pliances) [4]. Both the diagnostic and treatment steps can be
time-consuming, costly, and frustrating, especially for the
many patients who fail CPAP [6].
Although most patients with moderate-to-severe OSA ex-hibit multilevel collapse, the soft palate is the most collapsible
region of the upper airway [7]. In general, a change in the
retropalatal (RP) shape from circular to elliptical, specifically
laterally elliptical, is believed to be how CPAP [8] and oral
appliances function [9]. Patients vary in their RP area
re-sponses to oral appliances and RP stimulation. Responders and nonresponders exhibit similar extents of retrolingual opening after stimulation, but responders develop greater
in-creases in their RP areas [9]. One explanation is that the
con-nections between the RP and retrolingual regions may vary
among individuals [10].
From a surgical point of view, the baseline anatomical char-acteristics of patients have direct effects on how surgery changes
the airway [11–14]. Patients with proximal RP airway narrowing
(at 10 mm from the hard palate) do worse with classic uvulopalatopharyngoplasty (UPPP) than those with isolated
dis-tal narrowing (20 mm from the hard palate) [15]. Following
surgery, responders demonstrate an increase in RP airway size,
whereas nonresponders do not [12–14]. Selecting an appropriate
surgical procedure is critical, but few guidelines are available
[12]. Often the chosen technique reflects the surgeon’s preference
based on empirical experience, training, and ability. Thus, it is important to identify metrics other than those of
polysomnography to guide upper airway surgery choices [12].
A recent review found that isolated cephalometric param-eters could not be used to reliably predict treatment outcomes when mandibular advancement devices were placed, or
sur-gery performed, to treat OSA [16]. Also, a recent systematic
review of three-dimensional UAW anatomy suggested that no consensus had been attained on which anatomical variables of the upper airway were most relevant in terms of OSA
patho-genesis, apart from a small minimum cross-sectional area [5].
Retropalatal patterns have been subdivided into oblique, vertical, and intermediate subtypes in an effort to better un-derstand upper airway phenotypes and aid in surgical planning
by Woodson [17]. Four landmarks are used: the hard palate,
the genu, the velum, and the lateral pharyngeal walls [12,18].
This classification suggests that upper pharyngeal narrowing
occurs at the following locations: the velum (oblique pattern); the velum and genu (intermediate pattern); and the velum, genu, and hard palate (vertical pattern). The patterns are de-termined qualitatively during supine drug-induced sedation
endoscopy (DISE) [17].
Traditional UPPP techniques focus on the velar segment of the soft palate and fail to address significant abnormalities in
muscular and aponeurotic segments [12]. Palatal advancement
addresses abnormalities of the aponeurotic and muscular seg-ments and should be preferred in patients with proximal RP segment narrowing (from the hard palate level to 10 mm in-ferior to the hard palate). However, for an expansion sphincter pharyngoplasty procedure, patients should have an oblique pattern, and the narrowing should be close to the level of the
velopharynx (~ 10–15 mm) [15,19]. These data suggest that
the upper part of the RP airway (from the hard palate to 20 mm inferior to the hard palate) is the most important segment informing the decision-making process for surgery for OSA [11–15,17–19].
Thus, we focused on this region in this study. Previously, it was hypothesized that airway dimensions and pharyngeal length are functions of correlations between craniofacial soft
and hard tissue structures [14]. However, to the best of our
knowledge, no reported study has described quantitative mea-sures for classifying RP patterns.
We aimed to develop a magnetic resonance (MR) imaging (MRI) method of classifying RP patterns quantitatively to determine whether significant differences in terms of param-eter distributions are evident among OSA categories and RP pattern groups. We also sought to analyze correlations be-tween RP patterns, pharyngeal length, and craniofacial soft and hard tissue structures and to confirm the utility of Woodson’s model featuring three RP airway patterns.
Methods
Subjects
All 117 MR images were obtained between November 2015 and January 2018. Twenty simple snorers (apnea-hypopnea index [AHI] < 5 events/h) and 97 patients with OSA were evaluated. All patients were male, and all gave written in-formed consent. The study was approved by the Baskent University Institutional Review Board.
All patients had a clinical history taken and underwent physical and otolaryngology assessments, including (1) deter-mination of body mass index (BMI), (2) conventional supine fiber-optic endoscopy via video recording when awake during routine clinical examination, (3) polysomnography, and (4) upper airway MRI. Exclusionary criteria included (1) age less than 18 years or more than 69 years; (2) taking of chronic m e d i c a t i o n s t h a t a ff e c t u p p e r a i r w a y t o n e ( e . g . ,
benzodiazepines, sedatives); (3) tonsils of grades 3 or 4 or predominant central sleep apnea on polysomnography; (4) exclusions related to the use of MRI: (a) body weight > 125 kg (the table limit of the magnetic resonance scanner), (b) the presence of metallic implants (such as a pacemaker or ferromagnetic clips), or (c) severe claustrophobia; (5) se-vere chronic kidney, heart, or liver failure or abnormal lung function; and (6) other sleep disorders.
Subjects were divided into the following five categories based on the AHI: (1) normal/simple snoring: AHI < 5, (2) AHI 5 to < 15, (3) AHI 15 to < 30, (4) AHI 30 to < 50, and (5)
AHI≥ 50. In addition, all participants were subdivided into
those with oblique, vertical, or intermediate patterns on MRI.
Polysomnography
All participants underwent polysomnography at the Baskent University Alanya Hospital Chest Disease Sleep Laboratory using a computerized polysomnography device (E series, 44 channels; Compumedics, Victoria, Australia). Sleep staging was performed according to American Academy of Sleep
Medicine criteria [20,21].
Magnetic resonance imaging
Magnetic resonance imaging (MRI) was performed on pa-tients with OSA and simple snorers using a Brivo MRI 355 1.5 T (GE, Fairfield, CT, USA) with a quadrature head coil. Axial plane sections were obtained by T1-weighed MRI using fast spoiled gradient-echo (SPGR) 3D (TR/TE/FA, 6.2/1.8/ 12 ms; FOV, 254 × 254 mm; matrix, 186 × 186; NEX, 2). Slices (1.2 mm thick) were obtained from the nasion to the epiglottic vallecula (i.e., the base of the epiglottis). During axial MRI, all subjects were in the supine position with their heads placed in a neutral position to ensure consistent posi-tioning. Each subject was examined during waking and tidal breathing for 7 min and 26 s. Fast SPGR 3D was chosen as the photography condition for MRI because this method can pro-duce thin imaging sections and has high spatial resolution, a high signal-to-noise ratio, and the capability to reconstruct a desired plane.
Anatomical definitions, measurements, and analysis
A radiology specialist (HL) and an ENT specialist (SA) both measured the dimensions of the airways and craniofacial structures after selection of the images. SA performed all mea-surements at least three times on separate occasions to ensure reproducibility. If discrepancies were evident, or if the images were unclear, SA consulted the radiology specialist (HL).A workstation with image-processing software (AW Volume Share 5; GE) was used to measure the MRI data; all linear measurements were expressed in millimeters.
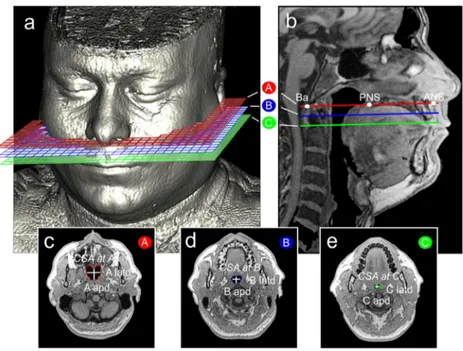
Before performing measurements, we designated three planes. The A plane corresponded to the hard palate, and the B and C planes were parallel planes 10 and 20 mm inferior to
the A plane, respectively (Fig.1). Measurements were made
on cross-sections of each plane to allow for quantitative
clas-sification of RP patterns (Fig.1c–e). Our video archive of
supine, awake, routine fiber-optic endoscopy procedures was used to determine RP airway ratio thresholds. Ten patients with apparently vertical RP airways were identified by refer-ence to their cross-sectional airway MRI measurements. The
lowest airway ratios were 1.45 for the A plane (R1) and 1.50
for both the B and C planes (R2 and R3 respectively).
Accordingly, airway ratio thresholds of 1.45 for the A plane and 1.50 for the B and C planes were used for quantitative
classification of the remaining patients (Table1).
The analyzed anatomical measures were separated into
four independent domains (Table2) :
(1) Cross-sectional airway parameters (Fig.1c–e)
The airway dimensions of the A, B, and C planes were evaluated using multiple parameters, including three lat-eral and three anteroposterior dimensions, three latd/apd ratios describing the cross-sectional shapes of the airway, and the three cross-sectional areas (CSAs).
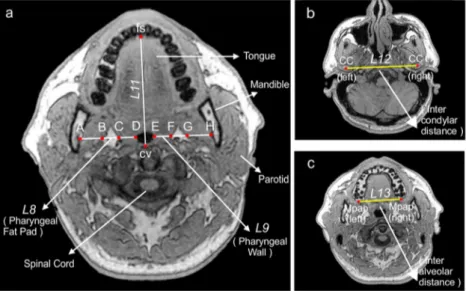
(2) Midsagittal parameters (Fig.2)
Twelve landmarks were labeled in the midsagittal illus-tration, as were two lines and the mandibular plane. The sagittal anatomy was evaluated using seven linear param-eters, three angular paramparam-eters, and one ratio.
(3) Cross-sectional soft tissue parameters (Fig.3a)
Soft tissue structures surrounding the airway were evalu-ated using two linear parameters: pharyngeal fat pad thickness and pharyngeal wall thickness (the arithmetic means of bilateral measurements at the B and C planes).
(4) Cross-sectional skeletal parameters (Fig.3a–c)
Skeletal structures surrounding the airway were evaluated using four linear and three ratio parameters.
Statistical analysis
For both discrete and continuous variables, descriptive statis-tics (means, standard deviations, frequencies, and percentiles) are given. The homogeneity of variance was checked using
Shapiro-Wilk test. To compare differences between the two groups, Student’s t test was used when the parametric test
prerequisites were fulfilled and the Mann-WhitneyU test
oth-erwise. To compare differences among three or more groups, one-way analysis of variance was used when the parametric test prerequisites were fulfilled and the Kruskal–Wallis test otherwise. The Bonferroni correction, a test of multiple com-parisons test, was employed to evaluate the significance of comparisons among three or more groups using the chi-square test. The chi-chi-square test was also used to explore the relationships between pairs of discrete variables. When the expected sources were < 20%, Monte Carlo simulation was performed to include such sources in analysis. Age and BMI served as covariates (to exclude their effects) in group com-parisons. Relationships between pairs of continuous variables were assessed by calculating Pearson correlation coefficients when parametric test prerequisites were fulfilled and Spearman correlation coefficients otherwise. Partial correla-tions were calculated to adjust for the effects of BMI, age, and AHI. Multiple linear regression analyses were performed to show the effects of independent variables on continuous dependent variables. All statistical analyses were performed using SPPS ver. 20 (released in 2011; IBM, Armonk, NY,
USA);p values < 0.05 and < 0.01 were considered significant.
Results
Table3 presents data comparing patient characteristics and
parameters among the five OSA categories. The controls (AHI < 5) were younger and lighter than OSA patients (p < 0.01). Airway lateral dimensions and the CSA at the A plane were significantly higher in controls than in OSA
patients (both ps < 0.01). Pharyngeal length was longer in
the AHI≥ 50 category than in the others (p < 0.01). The
man-dibular plane hyoid distance (L7) was significantly longer in
the AHI≥ 50 category than in the others (p < 0.001). The R7
ratio was significantly lower in the AHI 30 to < 50 and AHI≥
50 categories than in the others (p = 0.02).
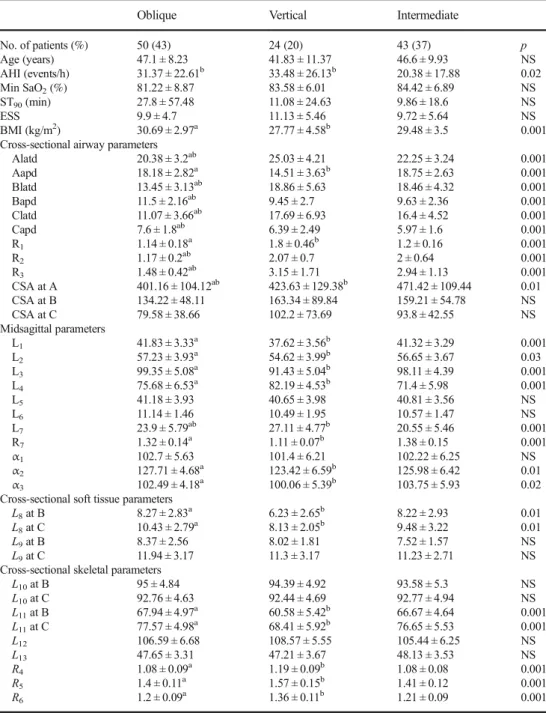
Table4 compares patient characteristics and parameters
among those with the three RP patterns. The airway lateral dimensions were shorter in those with the oblique pattern than those in the others (p < 0.001). The mean CSA in the A plane was less in those with the oblique pattern than those in the
others (p < 0.01). The midsagittal L1was significantly shorter,
and theL4significantly longer, in those with the vertical
pat-tern than those in the others (p < 0.001).
Table 5 shows the distribution of RP patterns by OSA
category.
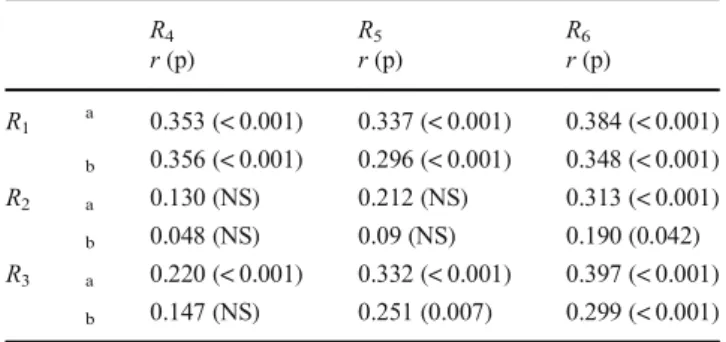
Table6presents simple and partial correlations between the
airway ratios (R1,R2,R3) and skeletal ratios (R4,R5,R6). Table7 lists simple and partial correlations between the cross-sectional
and vertical axis ratios (R7). Table8 lists the changes in the
correctedR7values per unit ofR1,R4,R5, andR6.
Discussion
Three of our findings may contribute to an understanding of the relationships between RP airway patterns, craniofacial structures, and OSA. First, narrow lateral nasopharyngeal di-mensions, a small CSA at A, a relatively long pharynx, and a high tendency to develop OSA were characteristic of the oblique pattern. Second, narrow nasopharyngeal AP dimen-sions, a markedly increased pharyngeal length, and a moder-ate tendency to develop OSA were characteristic of the Fig. 1 a A representative
three-dimensional MR image demon-strating the A, B, and C planes. b The A, B, and C planes on mid-sagittal MRI. Ba, basion; PNS, posterior nasal spine; ANS, ante-rior nasal spine. Cross-sections: c A plane, d B plane (a plane 10 mm inferior to the A plane and parallel to the A plane), e C plane (a plane 20 mm inferior to the A plane and parallel to the A plane). Airway dimensions: apd, anteroposterior dimension; latd, lateral dimension. Airway area: CSA, cross-sectional area
vertical pattern. Third, large nasopharyngeal dimensions, a large CSA at A, increased velar angulation, and a short phar-ynx (the intermediate pattern) were associated with a low ten-dency to develop OSA.
Potential bias and limitations of the study
Several potential limitations of the study should be discussed. Woodson reported that approximately half of patients (52%) were oblique, whereas 25% were vertical and 23% were
intermediate [6,17]. According to our MRI method, 43% of
our patients were oblique, whereas 20% were vertical and 37%
were intermediate (Table4). The notable difference in the
per-centage of patients with the intermediate pattern may be attrib-utable to the following differences in classification methods.
First, Woodson’s classification was dynamic in nature,
based on DISE and fiber-optic examinations performed with the head positioned in the Frankfort horizontal plane perpendicular to the floor. Our classification method was based on static MRI evaluation during which the head was in a neutral position to ensure consistent positioning during wakefulness; respiratory gating was not considered. The position of the velum would be expected to be affected by sedation, and the airway dimensions would be expected to be affected (to some extent) by the craniocervical
incli-nation and respiration [22].
Second, measurements were made in three predetermined parallel planes; no visible genu was used to identify Table 2 Definitions of
parameters Symbol Type Unit Definition
Cross-sectional airway parameters
latd 1D mm Lateral dimension of the airway at the A, B, and C planes
apd 1D mm Antero-posterior dimensions of the airway at the A, B, and C planes
R1 Alatd/Aapd Ratio Ratio of airway lateral and AP dimensions at the A plane
R2 Blatd/Bapd Ratio Ratio of airway lateral and AP dimensions at the B plane
R3 Clatd/Capd Ratio Ratio of airway lateral and AP dimensions at the C plane
CSA 2D mm2 Cross-sectional areas of the airway at the A, B, and C planes
Midsagittal parameters
L1 1D mm Length from Ba to PNS (nasopharyngeal depth)
L2 1D mm Length from ANS to PNS (hard palate length)
L3 1D mm Length from Ba to ANS
L4 1D mm Length from PNS to Val (pharyngeal length)
L5 1D mm Length from PNS to UT (soft palate length)
L6 1D mm Maximum soft palate thickness
L7 1D mm Length from Mp to H
R7 L3/L4 Ratio Ratio of Ba-ANS to PNS-Val (vertical axis ratio)
α1 Angular ° OPT/NSL angle (craniocervical inclination)
α2 Angular ° N-S-Ba angle (cranial base angle)
α3 Angular ° ANS-PNS-Val angle
Cross-sectional soft tissue parameters
L8 1D mm Pharyngeal fat pad thickness at the B and C planes (bilaterally
symmetrical)
L9 1D mm Pharyngeal wall thickness at the B and C planes (bilaterally symmetrical)
Cross-sectional skeletal parameters
L10 1D mm Length between the mandibular medial borders of the B and C planes
L11 1D mm Length from cv to fs at the B and C planes
L12 1D mm Length between the CCs
L13 1D mm Length between the Mpaps (maxilla width)
R4 L12/L3 Ratio Ratio of the lengths between the CCs and Ba-ANS (for the A plane)
R5 L10/L11 Ratio Ratio of craniofacial skeletal structural parameters at the B plane
R6 L10/L11 Ratio Ratio of craniofacial skeletal structural parameters at the C plane
Table 1 Ratio thresholds for the classification of retropalatal patterns
Oblique Vertical Intermediate
R1 < 1.45 > 1.45 < 1.45
R2 < 1.50 > 1.50 > 1.50
R3 < 1.50 > 1.50 > 1.50
intermediate patterns. We suggest that measurements on three predetermined proximal RP planes may provide reliable data regarding the baseline anatomical characteristics of a patient.
In addition, our method used a standard MRI protocol to an-alyze patients more objectively (thus without the bias of sub-jectively determining the genu).
Third, we lacked DISE data on our patients; we thus could not compare the MRI and DISE classification methods. DISE is indicated when surgery or placement of a mandibular
repo-sitioning device is being considered [23]. However, although
DISE features direct dynamic imaging of upper airway struc-tures, it does not yield quantitative data on the airway or the surrounding soft or hard tissues; metric evaluations or com-parisons are not possible. MRI features indirect static evalua-tion of various structures, yielding quantitative data on both the airway and surrounding structures. It is true that MRI is expensive, but it should nonetheless be viewed as a powerful cost-effective tool.
Finally, our sample size was small, and the validity of our thresholds requires confirmation. Typical examples of the
three types of RP patterns are shown in Fig.4.
Cranial base, maxilla, and UAW soft tissue structures
Consistent with previous reports, a shorter nasopharyngealdepth (L1) was evident in patients with the vertical pattern than
the other patterns (p < 0.001) [12,19,24,25]. In addition, a
shorter hard palate length (L2) and a smaller cranial base angle
(α2) were evident in those with the vertical pattern compared to
others (p = 0.03, p < 0.01, respectively; Table 4). These data
imply that the size and shape of the nasopharynx are deter-mined in part by the cranial base and the osseous anatomy of
the maxilla. Therefore, anteroposterior (L3) narrowing at the
palatal level reflects not only an anteroposteriorly restricted
Fig. 3 a A representative T1-weighted axial MR image of the C plane. Important anatomical structures are labeled. The mandibular rami can be
visualized by virtue of fat within the bone marrow of the mandible.L8,
pharyngeal fat pad thickness. B and C and F and G:L9, pharyngeal wall
thickness, C and D and E and F:L10, intermandibular distance. A–H: L11,
the distance betweenfs (the facial skeletal border) and cv (the cervical
vertebral border); b L12, the intercondylar distance (the distance between
the condyle centersCC); c L13, the interalveolar distance (the distance
between the midpoints of the ends of the tips of the alveolar process Mpap)
Fig. 2 Craniofacial landmarks: ANS, anterior nasal spine; PNS, posterior nasal spine; N, nasion; S, sella; H, most anterior point of the hyoid bone; Val; vallecula; Me, menton; Go, gonion; Ba, basion; UT, tip of the uvula.
Measurements:L1, BaPNS;L2, ANS-PNS;L3, Ba-ANS;L4, PNS-Val;L5,
PNS-UT;L6, maximum soft palate thickness;L7, Mp-H: shortest distance
between the mandibular plane (Go-Me) and H. Angles: α1, OPT/NSL,
angle between the tangent to the odontoid process that passes through Cv2sp (the superior posterior point of the second cervical vertebra) and Cv2ip (the inferior posterior point of the second cervical vertebra) and
NSL (the nasion sella line);α2, N-S-Ba, angle between NSL and the sella
basion line;α3, ANS-PNS-Val, angle between the ANS-PNS line and the
maxilla but also a narrow cranial base angle. A longer pharynx
(L4) was also evident in patients with the vertical pattern.
Finkelstein et al. reported that posterior insertion of the velar muscles into the cranial base results in a flatter, laterally larger
velopharyngeal axial configuration [25]. However, Enlow
stat-ed that a regional imbalance often tends to compensate,
provid-ing functional equilibrium [26]. Together, these findings
sug-gest that to fit into the anteroposteriorly restricted cranial base
Table 3 Comparison of parameters by OSA category
AHI < 5 AHI 5 to < 15 AHI 15 to < 30 AHI 30 to < 50 AHI≥ 50 p
No. of patients 20 18 38 18 23
Age (years) 40.05 ± 8.98abcd 44.33 ± 9.08bc 48.82 ± 10.33d 48.33 ± 8.55d 45.17 ± 8.6 0.01 AHI (events/h) 2.83 ± 1.56abcd 10.29 ± 3.2bcd 21.59 ± 4.78cd 38.85 ± 6.53d 64.63 ± 12.27 0.001 Min SaO2(%) 88.9 ± 2.4 cd 85 ± 5.84cd 85.03 ± 3.75cd 81 ± 5.08d 73.91 ± 10.43 0.001 ST90(min) 0.35 ± 0.46abcd 1.99 ± 3.04bcd 4.96 ± 7.74cd 20.55 ± 23.47d 64.29 ± 74.07 0.001 ESS 8.2 ± 4.41 9.61 ± 5.65 10.97 ± 5.24 11.33 ± 4.77 9.65 ± 5.59 NS BMI (kg/m2) 27.19 ± 3.65abcd 30.32 ± 3.59 29.6 ± 3.39 29.96 ± 2.98 31.08 ± 3.95 0.01 Cross-sectional airway parameters
Alatd 24.39 ± 4.06abcd 20.68 ± 3.75 22.16 ± 3.68 20.93 ± 3.15 21.63 ± 3.76 0.02 Aapd 18.8 ± 3.09 18.37 ± 3.31 17.39 ± 3.74 17.12 ± 2.05 16.85 ± 3.51 NS Blatd 20.05 ± 5.6abcd 15.66 ± 4.54 15.93 ± 4.15 15.1 ± 4.97 15.59 ± 4.4 0.01 Bapd 9.78 ± 2.59 10.49 ± 2.75 10.7 ± 2.5 9.93 ± 2.2 10.7 ± 2.63 NS Clatd 17.82 ± 5.45abcd 14.44 ± 5.86 13.94 ± 5.08 13.71 ± 5.85 12.64 ± 5.24 0.032 Capd 6.35 ± 2.07d 6.88 ± 2.62d 6.9 ± 1.81d 6.11 ± 1.5d 7.27 ± 2.1 0.035 R1 1.32 ± 0.26 1.15 ± 0.24 1.34 ± 0.4 1.23 ± 0.17 1.36 ± 0.52 NS R2 2.22 ± 0.97abcd 1.53 ± 0.42 1.53 ± 0.45 1.55 ± 0.43 1.57 ± 0.74 0.001 R3 3.16 ± 1.52abcd 2.39 ± 1.46d 2.18 ± 1.12 2.3 ± 0.89 1.99 ± 1.36 0.035 CSA at A 502.96 ± 124.69abcd 405.09 ± 119.52bd 441.68 ± 111.51cd 406.08 ± 104.38d 393.56 ± 92.56 0.01 CSA at B 168.28 ± 56.56 144.68 ± 72.43 151.7 ± 64.07 138.53 ± 70.97 141.28 ± 46 NS CSA at C 103.15 ± 47.22 95.83 ± 72.41 89.63 ± 43.3 77.56 ± 51.97 81.55 ± 36 NS Midsagittal parameters L1 41.87 ± 4.47 41.1 ± 3.35 40.5 ± 3.59 40.82 ± 3.16 40 ± 3.91 NS L2 57.02 ± 2.89 56.47 ± 5.73 56.93 ± 3.54 56.48 ± 4.62 55.27 ± 3.08 NS L3 98.45 ± 5.78 97.18 ± 6.08 97.24 ± 5.44 97.54 ± 5.22 96.17 ± 6.2 NS L4 73.28 ± 7.96d 71.6 ± 6.54d 75.77 ± 7.34d 76.64 ± 5.7d 78.86 ± 5.73 0.01 L5 39.24 ± 3.57abcd 39.23 ± 3.98bcd 41.75 ± 3.59 41.14 ± 2.89 42.24 ± 4.01 0.013 L6 10.38 ± 1.02cd 10 ± 1.57cd 10.68 ± 1.53 11.51 ± 1.53 11.42 ± 1.8 0.01 L7 20.47 ± 6.62 cd 20.32 ± 4.67cd 22.93 ± 5.64d 24.18 ± 5.19d 28.17 ± 4.18 0.001 R7 1.36 ± 0.19 cd 1.37 ± 0.17cd 1.3 ± 0.17cd 1.28 ± 0.1 1.23 ± 0.13 0.02 α1 101.83 ± 6.7 100.56 ± 5.39 101.5 ± 6.2 102.91 ± 6.18 104.68 ± 4.61 NS α2 127.06 ± 5.41 126.59 ± 4.48 125.56 ± 6.13 126.02 ± 8.15 126.3 ± 5.44 NS α3 102.94 ± 5.66 102.59 ± 6.22 101.08 ± 4.93 103.85 ± 5.46 103.1 ± 4.36 NS
Cross-sectional soft tissue parameters
L8at B 7.16 ± 2.15 7.94 ± 2.95 7.88 ± 3.22 8.01 ± 3.57 8.12 ± 2.57 NS
L8at C 9.3 ± 3.71 9.02 ± 2.36 9.92 ± 2.92 9.91 ± 2.91 9.6 ± 2.8 NS
L9at B 7.59 ± 1.62 7.86 ± 1.9 7.87 ± 1.95 8.76 ± 2.75 8.02 ± 2.35 NS
L9at C 11.61 ± 2.69 11.36 ± 1.97 11.38 ± 2.81 11.09 ± 3.29 12.29 ± 3.99 NS
Cross-sectional skeletal parameters
L10at B 93.41 ± 4.6 94.79 ± 6.45 94.78 ± 5.46 94.48 ± 4.36 94.03 ± 4.07 NS L10at C 93.41 ± 4.08 92.59 ± 5.4 92.26 ± 5.29 93.18 ± 4.02 92.5 ± 4.46 NS L11at B 65 ± 5.42 66.97 ± 5.88 65.21 ± 5.62 66.57 ± 5.2 66.8 ± 6.19 NS L11at C 75.5 ± 7.14 75.62 ± 6.65 74.62 ± 5.97 76.12 ± 7.17 75.64 ± 6.17 NS L12 105.25 ± 6.18 105.24 ± 7.61 107.11 ± 6.68 107.56 ± 6.39 107.11 ± 4.91 NS L13 48.52 ± 3.99 47.81 ± 3.19 47.78 ± 3.08 46.76 ± 3.96 47.69 ± 3.44 NS R4 1.07 ± 0.1 1.09 ± 0.1 1.1 ± 0.09 1.11 ± 0.11 1.12 ± 0.1 NS R5 1.45 ± 0.15 1.42 ± 0.15 1.46 ± 0.13 1.43 ± 0.12 1.42 ± 0.14 NS R6 1.25 ± 0.13 1.23 ± 0.13 1.24 ± 0.11 1.23 ± 0.1 1.23 ± 0.1 NS
Data are means ± standard deviations, numbers of subjects (%)
Other abbreviations as in Table2
AHI, apnea-hypopnea index; min SaO2, lowest oxygen saturation;ST90, total sleep time with oxygen saturation < 90%;ESS, Epworth sleepiness scale;
BMI, body mass index; NS, not significant a
Different between AHI 5 and < 15
bDifferent between AHI 15 and < 30
cDifferent between AHI 30 and < 50
d
area in individuals with a narrowα2angle, the velar muscles insert more posteriorly into the cranial base and are oriented more vertically; thus, the longitudinal curvature increases and the pharyngeal airway flattens anteroposteriorly and may be elongated inferiorly as a compensatory mechanism. The
ANS-PNS-Val angle (α3) was measured as an indicator of
lon-gitudinal curvature; the mean value was lower in those with the
vertical pattern (p = 0.02). In addition, a moderate correlation
was evident between the craniocervical inclination (α1) and the
longitudinal curvature (α3;r = 0.504, p < 0.001). In contrast to
those with the vertical pattern, our findings suggest that in those with the oblique pattern, the cranial base area narrows laterally and the velar muscles are inserted more laterally into the cra-nial base and are also oriented more anteroposteriorly. Table 4 Comparison of
parameters by retropalatal pattern group
Oblique Vertical Intermediate
No. of patients (%) 50 (43) 24 (20) 43 (37) p Age (years) 47.1 ± 8.23 41.83 ± 11.37 46.6 ± 9.93 NS AHI (events/h) 31.37 ± 22.61b 33.48 ± 26.13b 20.38 ± 17.88 0.02 Min SaO2(%) 81.22 ± 8.87 83.58 ± 6.01 84.42 ± 6.89 NS ST90(min) 27.8 ± 57.48 11.08 ± 24.63 9.86 ± 18.6 NS ESS 9.9 ± 4.7 11.13 ± 5.46 9.72 ± 5.64 NS BMI (kg/m2) 30.69 ± 2.97a 27.77 ± 4.58b 29.48 ± 3.5 0.001
Cross-sectional airway parameters
Alatd 20.38 ± 3.2ab 25.03 ± 4.21 22.25 ± 3.24 0.001 Aapd 18.18 ± 2.82a 14.51 ± 3.63b 18.75 ± 2.63 0.001 Blatd 13.45 ± 3.13ab 18.86 ± 5.63 18.46 ± 4.32 0.001 Bapd 11.5 ± 2.16ab 9.45 ± 2.7 9.63 ± 2.36 0.001 Clatd 11.07 ± 3.66ab 17.69 ± 6.93 16.4 ± 4.52 0.001 Capd 7.6 ± 1.8ab 6.39 ± 2.49 5.97 ± 1.6 0.001 R1 1.14 ± 0.18 a 1.8 ± 0.46b 1.2 ± 0.16 0.001 R2 1.17 ± 0.2ab 2.07 ± 0.7 2 ± 0.64 0.001 R3 1.48 ± 0.42ab 3.15 ± 1.71 2.94 ± 1.13 0.001 CSA at A 401.16 ± 104.12ab 423.63 ± 129.38b 471.42 ± 109.44 0.01 CSA at B 134.22 ± 48.11 163.34 ± 89.84 159.21 ± 54.78 NS CSA at C 79.58 ± 38.66 102.2 ± 73.69 93.8 ± 42.55 NS Midsagittal parameters L1 41.83 ± 3.33a 37.62 ± 3.56b 41.32 ± 3.29 0.001 L2 57.23 ± 3.93a 54.62 ± 3.99b 56.65 ± 3.67 0.03 L3 99.35 ± 5.08 a 91.43 ± 5.04b 98.11 ± 4.39 0.001 L4 75.68 ± 6.53 a 82.19 ± 4.53b 71.4 ± 5.98 0.001 L5 41.18 ± 3.93 40.65 ± 3.98 40.81 ± 3.56 NS L6 11.14 ± 1.46 10.49 ± 1.95 10.57 ± 1.47 NS L7 23.9 ± 5.79ab 27.11 ± 4.77b 20.55 ± 5.46 0.001 R7 1.32 ± 0.14a 1.11 ± 0.07b 1.38 ± 0.15 0.001 α1 102.7 ± 5.63 101.4 ± 6.21 102.22 ± 6.25 NS α2 127.71 ± 4.68a 123.42 ± 6.59b 125.98 ± 6.42 0.01 α3 102.49 ± 4.18a 100.06 ± 5.39b 103.75 ± 5.93 0.02
Cross-sectional soft tissue parameters L8at B 8.27 ± 2.83 a 6.23 ± 2.65b 8.22 ± 2.93 0.01 L8at C 10.43 ± 2.79 a 8.13 ± 2.05b 9.48 ± 3.22 0.01 L9at B 8.37 ± 2.56 8.02 ± 1.81 7.52 ± 1.57 NS L9at C 11.94 ± 3.17 11.3 ± 3.17 11.23 ± 2.71 NS
Cross-sectional skeletal parameters
L10at B 95 ± 4.84 94.39 ± 4.92 93.58 ± 5.3 NS L10at C 92.76 ± 4.63 92.44 ± 4.69 92.77 ± 4.94 NS L11at B 67.94 ± 4.97a 60.58 ± 5.42b 66.67 ± 4.64 0.001 L11at C 77.57 ± 4.98a 68.41 ± 5.92b 76.65 ± 5.53 0.001 L12 106.59 ± 6.68 108.57 ± 5.55 105.44 ± 6.25 NS L13 47.65 ± 3.31 47.21 ± 3.67 48.13 ± 3.53 NS R4 1.08 ± 0.09 a 1.19 ± 0.09b 1.08 ± 0.08 0.001 R5 1.4 ± 0.11a 1.57 ± 0.15b 1.41 ± 0.12 0.001 R6 1.2 ± 0.09a 1.36 ± 0.11b 1.21 ± 0.09 0.001
Data are means ± standard deviations, numbers of subjects (%)
Other abbreviations as in Table2
AHI, apnea-hypopnea index; min SaO2, lowest oxygen saturation;ST90, total sleep time with oxygen saturation <
90%;ESS, Epworth sleepiness scale; BMI, body mass index; NS, not significant
a
Different from the vertical group b
However, our findings suggest that in those with the interme-diate pattern the cranial base area is large in the lateral and AP dimensions and, as a result, pharyngeal length is shortened vertically. OSA is an adverse consequence of human upper respiratory tract evolution, because during the development of a newborn, not only is an adequate distance between the epi-glottis and soft palate required for speech, but closure for deglutition without aspiration should also be maintained. A good balance between maxillary development and laryngeal
descent is important in this complex process [27, 28].
Therefore, increased velar angulation (genu formation) in pa-tients with an intermediate pattern may be a compensatory mechanism associated with a short pharynx.
The etiology of hyoid displacement
Significant differences in the Mp-H (L7) distance were evident
among the three groups (p < 0.001; Table4). A longer Mp-H
distance indicates a longer (and therefore more collapsible) soft tissue pharyngeal airway, which is associated with poorer
UPPP outcomes [29–31]. Consistent with this, a moderate
correlation was apparent between pharyngeal length and
Mp-H distance (r = 0.680, p < 0.001). Excessive soft tissue may shift the hyoid bone caudally; similarly, a relative excess of soft tissue in patients with a small mandibular enclosure may cause a downward shift of the hyoid bone in nonobese
individuals [24,32]. This means that the Mp-H distance may
be increased in patients with all of the RP patterns studied. Our findings suggest that the Mp-H distance is determined in part by the type of RP pattern, obesity, and the extent of contiguous soft tissue structures.
Correlations between the cross-sectional shape
and the vertical axis
One airway ratio (R1) and all three skeletal ratios (R4,R5,R6)
were significantly (negatively) correlated with the vertical axis
ratio (R7; Table7). These findings suggest that the RP airway
pattern is associated not only with bony enclosures in the cross-sectional plane but also with pharyngeal length in the vertical plane in all three dimensions. Linear regression anal-yses revealed that 40.8% of the variance in the vertical axis
ratio was predicted by theR1ratio and the A, B, and C skeletal
ratios (p < 0.001; Table8).
Table 6 Simple and partial correlations between airway and skeletal
ratios R4 r (p) R5r (p) R6r (p) R1 a 0.353 (< 0.001) 0.337 (< 0.001) 0.384 (< 0.001) b 0.356 (< 0.001) 0.296 (< 0.001) 0.348 (< 0.001) R2 a 0.130 (NS) 0.212 (NS) 0.313 (< 0.001) b 0.048 (NS) 0.09 (NS) 0.190 (0.042) R3 a 0.220 (< 0.001) 0.332 (< 0.001) 0.397 (< 0.001) b 0.147 (NS) 0.251 (0.007) 0.299 (< 0.001) Abbreviations as in Table2 NS, not significant a Unadjusted correlations b
Correlations adjusted for BMI and age
Table 7 Simple and partial correlations between cross-sectional and
vertical axis ratios R7
r (p) R7and OPT/NSL)(adjusted for BMI, age,
r (p) R1 − 0.404 (< 0.001) − 0.427 (0.001) R2 − 0.271 (0.003) − 0.144 (NS) R3 − 0.264 (0.004) − 0.177 (NS) R4 − 0.731 (< 0.001) − 0.569 (0.001) R5 − 0.503 (0.001) − 0.433 (0.001) R6 − 0.518 (< 0.001) − 0.502 (< 0.001) Abbreviations as in Table2 NS, not significant Table 5 Distribution of
retropalatal patterns by OSA category
AHI < 5 AHI 5 to < 15 AHI 15 to < 30 AHI 30 to < 50 AHI≥ 50 p
Oblique 3abd(6) 10 (20) 17 (34) 7 (14) 13 (26) 0.049
Vertical 4bd(17) 2bd(8) 9 (38) 3 (13) 6 (25)
Intermediate 13abd(30) 6b(14) 12d(28) 8 (19) 4 (9)
Data are numbers of subjects (%) a
Different between AHI 5 and < 15
bDifferent between AHI 15 and < 30
cDifferent between AHI 30 and < 50
d
The effect of age and RP pattern on pharyngeal
caliber
A previous study reported that compared to younger males older males had a greater pharyngeal caliber as measured by acoustic reflection, a longer and larger soft palate and
parapharyngeal fat pad (measured using MRI); this study con-cluded that the larger pharyngeal caliber observed in older males may compensate for the age-related enlargement of
the pharyngeal soft tissue that predisposes one to OSA [33].
A correlation was evident between the airway and skeletal
ratios at the A plane (Table6). This reflects a relationship
between the airway anterior-posterior length and the nasopha-ryngeal depth (BaPNS). The positive correlations between the airway and skeletal ratios at the A plane fell at lower planes
(Table 6), possibly because of the extent of soft tissue
in-creases from the hard palate to the lower levels. Indeed, the mean pharyngeal fat pad thicknesses at the B and C planes were significantly lower in patients with the vertical pattern
than others (Table4). These data suggest that compensatory
mechanisms affording functional equilibrium are dynamic, in play not only in childhood but also in adulthood, mediated by changes in the sizes and configurations of adjacent soft tissues [25,26,33].
Fig. 4 Magnetic resonance images of patients with oblique (first row), vertical (second row), and intermediate (third row) retropalatal patterns. ANS, anterior nasal spine; PNS, posterior nasal spine; Ba, basion; Val,
vallecula. Images show the midsagittal section, 3D airway (lateral view), cross-section of A, B, C planes of each patient, respectively. ANS, ante-rior nasal spine; PNS, posteante-rior nasal spine; Ba, basion; Val, vallecula
Table 8 Change in the corrected vertical axis ratio (R7) per unit ofR1,
R4,R5, and R6
Change inR7per unit increase in…
R1 R4 R5 R6 R2 F ANOVA test p value R7 − 0.098 (0.007) − 0.660 (0.001) 0.092 (NS) − 0.364 (0.049) 0.408 < 0.001 Abbreviations as in Table2 NS, not significant
Factors limiting the effect of oral appliances
and upper airway stimulation
The resolution of a multilevel collapse of the palate and tongue base is probably critical if treatment is to succeed
[10]. Increases after stimulation in the anteroposterior RP
mension, and the anteroposterior and lateral retrolingual di-mensions, may indicate that an additive mechanism differing
from that of oral appliances is in play [9,34]. Anatomically,
the soft palate is linked to the tongue base via the anterior palatal pillar, which contains the palatoglossus muscle that courses through the soft palate and uvula and inserts into the
sides of the tongue [35]. This structure can passively and
actively pull the soft palate inferiorly and anteriorly.
The connection between hypoglossal activation and upper airway structural movement, and the passive effect of tongue-base manipulation during mandibular advancement, followed
by RP opening, deserve further investigation [10]. We suggest
that the effects of mandibular advancement and stimulation on the upper airway are associated with the RP pattern. These patterns differ not only in terms of airway size and shape but also in the insertion sites and orientations of the pharyngeal muscles, influencing the muscle responses to all treatment modalities.
Factors potentially limiting surgical success
Our findings may be relevant from a surgical point of view. Surgical success or failure is dependent on accurate airway
diagnosis and selection of the correct procedure [12].
According to our results, the baseline anatomy not only per-tains to surgically removable or alterable soft tissue structures but also involves a narrow cranial base angle, a narrow naso-pharynx, an anteroposteriorly restricted maxilla, abnormally inserted and oriented velar muscles, and abnormal pharyngeal length, which cannot be addressed adequately by surgery; these factors may limit surgical success. UPPP, palatal ad-vancement, and/or lateral pharyngoplasty would not be ex-pected to adequately address abnormalities associated with the cranial base, muscle insertion or orientation, or pharyngeal length. Furthermore, the overall space available to
accommo-date upper airway soft tissue is genetically determined [36].
Our results suggest that the vertical pattern is associated with a narrow cranial base angle, a short nasopharynx, and a long pharynx; the oblique pattern is associated with narrow naso-pharyngeal lateral dimensions; and the intermediate pattern is associated with large nasopharyngeal dimensions and a short pharynx. All patterns may be heritable. These findings support the hypothesis that anatomical imbalances may be best treated by orthodontic treatments following early diagnosis during the
developmental period [37].
After maxillomandibular and genial tubercle advancement, the upper airway became shorter in length but larger in size (in
terms of both volume and the CSA), and more uniform, more
closely resembling a normal airway [38]. In the present study,
a large CSA at A and a short airway length were characteristic of patients with the intermediate pattern. Also, of OSA pa-tients, the percentages of those with the oblique, vertical, and intermediate RP patterns were 94, 83, and 70%, respec-tively (p = 0.049), implying that a tendency toward OSA is relatively high in those with the oblique pattern, moderate in those with the vertical pattern, and low in those with the
in-termediate pattern (Table5). We speculate that the vertical
pattern transforms into an intermediate pattern to some extent after maxillomandibular and genial tubercle advancement. However, even this highly invasive surgical procedure does not adequately address an abnormally sized/shaped cranial base, or muscle insertion and orientation. OSA recurrences have been noted 10–15 years after maxillomandibular ad-vancement. One of the limitations of such surgery (observed clinically in many recurrences) is the limited gain in the lateral dimension of the pharyngeal airway, despite good long-term
gain in the anteroposterior direction [39].
Future research perspectives
Pharmacotherapy for nonanatomical traits must move from proof-of-principle to the clinic. Similarly, the roles of novel de-vices must be better defined. For example, how do the dede-vices manipulate the airway? What is the magnitude of their effect?
Further, which patients best respond to such therapies [40]?
It is unknown whether loop gain and the arousal threshold
influence upper airway size [5], or vice versa. No standardized
quantitative classification of UAW anatomical traits is yet avail-able. An important objective of future research should be clar-ification of the relative contributions of, and interactions among, the abovementioned factors (anatomical and
non-anatomical) in terms of OSA development [41,42]. The
surgi-cal reduction of upper airway collapsibility may be related to the baseline anatomical features of the patient (i.e., the obstruc-tion sites and structural components involved in a collapse). Nonanatomical traits such as a high loop gain and arousal threshold are associated with residual AHI after upper airway surgery. However, an understanding of OSA physiology, rather than a reliance on unguided statistical methods, is necessary in order to use anatomical and nonanatomical surrogates of
phys-iological traits to predict surgical outcomes [43].
We suggest that the responses to various OSA therapies may be associated with RP patterns. If so, accurate anatomical information obtained before and after surgery is crucial to aid our understanding of OSA pathophysiology and evaluation of the responses to different modalities. It should be emphasized that an endoscopically visible genu is not a reliable landmark when used to differentiate patients with intermediate RP pat-terns. Patients with vertical RP patterns may be distinguished more readily, but oblique and intermediate patterns can be
confused on endoscopy. The oblique and intermediate RP patterns reflect the two ends of the spectrum regarding the CSA at A; and the vertical axis ratio of the vertical pattern differ significantly from those in other patterns. The obstruc-tion sites and structural components of collapse may be more important than isolated, pharyngeal critical pressures. Future work on RP patterns will aid our understanding of OSA path-ogenesis and may result in the development of new, effective treatment strategies.
In conclusion, our study, which used MRI to examine cra-niofacial structures in patients with simple snoring and OSA, measured the RP airways of male patients three-dimensionally and quantitatively. Anatomical imbalances related to nasopha-ryngeal dimensions and phanasopha-ryngeal length, and compensatory processes providing functional equilibrium, may contribute to baseline anatomical characteristics of the RP airway. An awareness of these associations will improve the ability of physicians to understand and interpret multiple airway pat-terns and could guide decisions on appropriate treatment modalities.
Funding This study was supported by the Baskent University Research Fund (project no. KA17/36).
Compliance with ethical standards
Conflict of interest The authors declare that they have no conflict of
interest.
Ethical approval All procedures involving human participants were
per-formed in accordance with the ethical standards of our institutional and/or national research committee and with those of the 1964 Helsinki decla-ration and later amendments, or comparable ethical standards.
Informed consent Informed consent was obtained from all participants.
References
1. White DP, Younes MK (2012) Obstructive sleep apnea. Compr
Physiol 2:2541–2594.https://doi.org/10.1002/cphy.c110064
2. Eckert DJ, White DP, Jordan AS, Malhotra A, Wellman A (2013)
Defining phenotypic causes of obstructive sleep apnea. Identification of novel therapeutic targets. Am J Respir Crit Care
Med 188:996–1004.https://doi.org/10.1164/rccm.201303-0448OC
3. Eckert DJ (2018) Phenotypic approaches to obstructive sleep
ap-noea—new pathways for targeted therapy. Sleep Med Rev 37:45–
59.https://doi.org/10.1016/j.smrv.2016.12.003
4. Carberry JC, Amatoury J, Eckert DJ (2018) Personalized
manage-ment approach for OSA. Chest 153:744–755.https://doi.org/10.
1016/j.chest.2017.06.011
5. Chen H, Aarab G, de Ruiter MH, de Lange J, Lobbezoo F, van der
Stelt PF (2016) Three-dimensional imaging of the upper airway anatomy in obstructive sleep apnea: a systematic review. Sleep
Med 21:19–27.https://doi.org/10.1016/j.sleep.2016.01.022
6. Chai-Coetzer CL, Antic NA, Rowland LS, Reed RL, Esterman A,
Catcheside PG, Eckermann S, Vowles N, Williams H, Dunn S, McEvoy RD (2013) Primary care vs specialist sleep center
management of obstructive sleep apnea and daytime sleepiness
and quality of life: a randomized trial. JAMA 309:997–1004.
https://doi.org/10.1001/jama.2013.1823
7. Trudo FJ, Gefter WB, Welch KC, Gupta KB, Maislin G, Schwab
RJ (1998) State-related changes in upper airway caliber and sur-rounding soft-tissue structures in normal subjects. Am J Respir Crit
Care Med 158:1259–1270
8. Leiter JC (1996) Upper airway shape: is it important in the
patho-genesis of obstructive sleep apnea? Am J Respir Crit Care Med 153:
894–898
9. Chan AS, Lee RW, Srinivasan VK, Darendeliler MA, Grunstein
RR, Cistulli PA (2010) Nasopharyngoscopic evaluation of oral
ap-pliance therapy for obstructive sleep apnoea. Eur Respir J 35:836–
842.https://doi.org/10.1183/09031936.00077409
10. Safiruddin F, Vanderveken OM, de Vries N, Maurer JT, Lee K, Ni
Q, Strohl KP (2015) Effect of upper-airway stimulation for
obstruc-tive sleep apnoea on airway dimensions. Eur Respir J 45:129–138.
https://doi.org/10.1183/09031936.00059414
11. Pang KP, Woodson BT (2013) Current concepts in evaluation and
surgical planning: the Pang–Woodson protocol. In: Pang KP,
Woodson BT, Rotenberg B (eds) Advanced surgical technique in snoring and obstructive sleep apnea, 1st edn. Plural Publishing,
USA, pp 37–42
12. Woodson BT (2008) Structural effectiveness of pharyngeal sleep
apnea surgery. Sleep Med Rev 12:463–479.https://doi.org/10.
1016/j.smrv.2008.07.010
13. Li HY, Chen NH, Wang CR, Shu YH, Wang PC (2003) Use of
3-dimensional computed tomography scan to evaluate upper airway patency for patients undergoing sleep-disordered breathing surgery.
Otolaryngol Head Neck Surg 129:336–342.https://doi.org/10.
1016/S0194-59980300629-6
14. Ryan CF, Lowe AA, Li D, Fleetham JA (1991) Three-dimensional
upper airway computed tomography in obstructive sleep apnea. A prospective study in patients treated by uvulopalatopharyngoplasty.
Am Rev Respir Dis 144:428–432.https://doi.org/10.1164/ajrccm/
144.2.428
15. Cahali MB, Formigoni GG, Gebrim EM, Miziara ID (2004) Lateral
pharyngoplasty versus uvulopalatopharyngoplasty: a clinical, poly-somnographic and computed tomography measurement
compari-son. Sleep 27:942–950
16. Denolf PL, Vanderveken OM, Marklund ME, Braem MJ (2016)
The status of cephalometry in the prediction of non-CPAP treatment
outcome in obstructive sleep apnea patients. Sleep Med Rev 27:56–
73.https://doi.org/10.1016/j.smrv.2015.05.009
17. Woodson BT (2015) A method to describe the pharyngeal airway.
Laryngoscope 125:1233–1238.https://doi.org/10.1002/lary.24972
18. Woodson BT, Sitton M, Jacobowitz O (2012) Expansion sphincter
pharyngoplasty and palatal advancement pharyngoplasty: airway evaluation and surgical techniques. Oper Tech Otolaryngol Head
Neck Surg 23:3–10.https://doi.org/10.1016/j.otot.2012.01.002
19. Woodson BT (2013) Palatal advancement pharyngoplasty. In: Pang
KP, Woodson BT, Rotenberg B (eds) Advanced surgical technique in snoring and obstructive sleep apnea, 1st edn. Plural Publishing,
USA, pp 167–177
20. Iber C, Ancoli-Israel S, Chesson A, Quan S (2007) The AASM
manual for the scoring of sleep and associated events: rules, termi-nology and technical specifications. American Academy of Sleep Medicine, Westchester
21. Berry RB, Budhiraja R, Gottlieb DJ, Gozal D, Iber C, Kapur VK,
Marcus CL, Mehra R, Parthasarathy S, Quan SF, Redline S, Strohl KP, Ward SLD, Tangredi MM (2012) Rules for scoring respiratory events in sleep: update of the 2007 AASM manual for the scoring of
sleep and associated events. J Clin Sleep Med 8:597–619.https://
doi.org/10.5664/jcsm.2172
22. Muto T, Takeda S, Kanazawa M, Yamazaki A, Fujiwara Y,
airway space (PAS). Int J Oral Maxillofac Surg 31:579–583.https:// doi.org/10.1016/j.ijom.2007.12.012
23. Abdullah VJ, Koutsourelakis I, Ravesloot MJL, Lip Yen Lee D,
Ching Nam Ha S, van Hasselt CA et al (2013) Drug-induced sleep endoscopy. In: Pang KP, Woodson BT, Rotenberg B (eds) Advanced surgical technique in snoring and obstructive sleep
ap-nea, 1st edn. Plural Publishing, USA, pp 43–65
24. Watanabe T, Isono S, Tanaka A, Tanzawa H, Nishino T (2002)
Contribution of body habitus and craniofacial characteristics to seg-mental closing pressures of the passive pharynx in patients with
sleep-disordered breathing. Am J Respir Crit Care Med 165:260–
265.https://doi.org/10.1164/ajrccm.165.2.2009032
25. Finkelstein Y, Shapiro-Feinberg M, Talmi YP, Nachmani A,
DeRowe A, Ophir D (1995) Axial configuration of the velopharyngeal valve and its valving mechanism. Cleft Palate
Craniofac J 32:299–305.https://doi.org/10.1597/1545-1569(1995)
032<0299:ACOTVV>2.3.CO;2
26. Enlow DH (1982) Handbook of facial growth, 2nd edn. WB
Saunders Company, Philadelphia
27. Davidson TM (2003) The great leap forward: the anatomic basis for
the acquisition of speech and obstructive sleep apnea. Sleep Med 4: 185–194
28. Yamashiro Y, Kryger M (2012) Is laryngeal descent associated with
increased risk for obstructive sleep apnea? Chest 141:1407–1413. https://doi.org/10.1378/chest.10-3238
2 9 . Wo o d s o n B T, C o n l e y S F ( 1 9 9 7 ) P r e d i c t i o n o f
uvulopalatopharyngoplasty response using cephalometric ra-diographs. Am J Otolaryngol 18:179–184
30. Doghramji K, Jabourian ZH, Pilla M, Farole A, Lindholm RN
(1995) Predictors of outcome for uvulopalatopharyngoplasty.
Laryngoscope 105:311–314.
https://doi.org/10.1288/00005537-199503000-00016
31. Millman RP, Carlisle CC, Rosenberg C, Kahn D, McRae R, Kramer
NR (2000) Simple predictors of uvulopalatopharyngoplasty outcome in
the treatment of obstructive sleep apnea. Chest 118:1025–1309
32. Genta PR, Schorr F, Eckert DJ, Gebrim E, Kayamori F, Moriya HT,
Malhotra A, Lorenzi-Filho G (2014) Upper airway collapsibility is
associated with obesity and hyoid position. Sleep 37:1673–1678.
https://doi.org/10.5665/sleep.4078
33. Carlisle T, Carthy ER, Glasser M, Drivas P, McMillan A, Cowie
MR, Simonds AK, Morrell MJ (2014) Upper airway factors that protect against obstructive sleep apnoea in healthy older males. Eur
Respir J 44:685–693.https://doi.org/10.1183/09031936.00177213
34. Chan AS, Sutherland K, Schwab RJ, Zeng B, Petocz P, Lee RW,
Darendeliler MA, Cistulli PA (2010) The effect of mandibular ad-vancement on upper airway structure in obstructive sleep apnoea.
Thorax 65:726–732.https://doi.org/10.1136/thx.2009.131094
35. Van de Graaff WB, Gottfried SB, Mitra J, van Lunteren E,
Cherniack NS, Strohl KP (1984) Respiratory function of hyoid muscles and hyoid arch. J Appl Physiol Respir Environ Exerc
Physiol 57:197–204
36. Chi L, Comyn FL, Keenan BT, Cater J, Maislin G, Pack AI,
Schwab RJ (2014) Heritability of craniofacial structures in normal subjects and patients with sleep apnea. Sleep 37:1689–1698
37. Huynh NT, Desplats E, Almeida FR (2016) Orthodontics
treat-ments for managing obstructive sleep apnea syndrome in children:
a systematic review and meta-analysis. Sleep Med Rev 25:84–94
38. Abramson Z, Susarla SM, Lawler M, Bouchard C, Troulis M,
Kaban LB (2011) Three-dimensional computed tomographic air-way analysis of patients with obstructive sleep apnea treated by maxillomandibular advancement. J Oral Maxillofac Surg 69:677– 686.https://doi.org/10.1016/j.joms.2010.11.037
39. Zaghi S, Holty JE, Certal V, Abdullatif J, Guilleminault C, Powell
NB et al (2016) Maxillomandibular advancement for treatment of obstructive sleep apnea: a meta-analysis. JAMA Otolaryngol Head
Neck Surg 142:58–66.https://doi.org/10.1001/jamaoto.2015.2678
40. Malhotra A, Orr JE, Owens RL (2015) On the cutting edge of
obstructive sleep apnoea: where next? Lancet Respir Med 3:397– 403.https://doi.org/10.1016/S2213-2600(15)00051-X
41. Chi L, Comyn FL, Mitra N, Reilly MP, Wan F, Maislin G,
Chmiewski L, Thorne-FitzGerald MD, Victor UN, Pack AI, Schwab RJ (2011) Identification of craniofacial risk factors for obstructive sleep apnoea using three-dimensional MRI. Eur
Respir J 38:348–358.https://doi.org/10.1183/09031936.00119210
42. Owens RL, Edwards BA, Eckert DJ, Jordan AS, Sands SA,
Malhotra A, White DP, Loring SH, Butler JP, Wellman A (2015) An integrative model of physiological traits can be used to predict obstructive sleep apnea and response to non positive airway pres-sure therapy. Sleep 38:961–970
43. Li Y, Ye J, Han D, Cao X, Ding X, Zhang Y, Xu W, Orr J, Jen R,
Sands S, Malhotra A, Owens R (2017) Physiology-based modeling may predict surgical treatment outcome for obstructive sleep apnea.
J Clin Sleep Med 13:1029–1037. https://doi.org/10.5664/jcsm.
6716
View publication stats View publication stats