Sosyal ve Ekonomik Araştırmalar Dergisi (The Journal of Social and Economic Research) ISSN: 1303 – 8370 / Ekim 2013 / Yıl: 13 / Sayı: 26
DEMAND OF COMMODITY GROUPS IN
TURKEY
Mehmet Arif ŞAHİNLİ*
ÖZET
Bu çalışmada, Türkiye İstatistik Kurumu tarafından 2002 ve 2011 yılları arasında hesaplanan Hanehalkı Bütçe Anketleri kullanılmıştır. On iki mal grubuna ilişkin fiyat ve harcama esneklikleri, yaklaşık ideal talep sistemi çerçevesinde tahmin edilmiştir. Bu mal grupları gıda ve alkolsüz içecekler; alkollü içecekler ve tütün; giyim ve ayakkabı; konut, su, elektrik, gaz ve diğer yakıtlar; mobilya; ev aletleri ve ev bakım hizmetleri; sağlık; ulaştırma; iletişim; eğlence ve kültür; eğitim hizmetleri, restorant, ev yemekleri ve otel; çeşitli mal ve hizmetler şeklinde sınıflandırılmıştır.
Anahtar Kelimeler: Yaklaşık ideal talep sistemi, Harcama ve fiyat esneklikleri. JEL Kodu: D10, D11, D12.
ABSTRACT
In this study, data of the Household Budget Surveys conducted by the Turkish Statistical Institute between 2002 and 2011 years were used. Price and expenditure elasticities with related to twelve commodity groups were estimated within the framework of the an almost ideal demand system approach. Expenditures and price elasticities by commodity groups were obtained. These commodity groups were Food and non-alcoholic beverages; Alcoholic beverages and tobacco; Clothing and footwear; Housing, water, electric, gas and other fuels; Furniture, houses appliances and home care services; Health; Transportation; Communication; Entertainment and culture; Educational services; Restaurant, home meals and hotels; Various good and services.
Keywords: An almost ideal demand system, Expenditure and Price elasticities. JEL Code: D10, D11, D12.
INTRODUCTION
Due to expenditure and consumption diversities between the households in Turkey, examination of the expenditure items structure represents an issue of great importance. Moreover, price elasticity of expenditure items is significant instruments in the formation of an effective economy policy and the formation of budget policies.
The problem in this study stems from the fact that what household demand parameters by commodity groups would be in Turkey. In this study, calculation of price and expenditure elasticities drawn from the Almost Ideal Demand System was aimed by using expenditure data relevant to the commodity groups included in the Household Budget Surveys (HBS) between 2002 and 2011. The main goal of this study is to analyze the consumption behavior of the households living in Turkey. As it is known, despite the fact that household consumption expenditures are composed of various commodity groups, budget shares for expenditures represent an important part of them. With in this study, it is possible to monitor, via the price and expenditure elasticities, the commodity groups for which the most and the least expenses were made by the consumers. There are numerous studies analyzing the demands for expenditure groups in world countries and in Turkey. There are a few studies analyzing the demands for food or other commodity groups items that are as follows: (Koç, 1995), (Ekinci, 1996), Şahinli and Fidan (2012), Şahinli (2010), (Nişancı, 2002), Deaton and Muellbauer (1980), Blanciforti and Green (1983), Blanciforti, Green and King (1986), Hutasuhut et al. (2001), Pollak and Wales (1987), Deaton-Muellbauer (1980a and 1980b). MATERIAL and METHODS
HBS sample households structure have been changing steadily since 2002. The estimation level of the HBS of 2002 is the distinction between whole Turkey, urban and rural areas. COICOP/HBS has been used to classify the consumption expenditures (Turkstat, 2013).
The HBS data between 2002 and 2011, the method of which is given above by the Turkish Statistical Institute (Turkstat) were used in this study. This survey data were organized and changed with relevant to the researcher’s objective.
In the data relevant between 2002 and 2011, general sum of total monthly consumption expenditures and expenditure values groups regarding Food and non-alcoholic beverages; Alcoholic beverages and tobacco; Clothing and footwear; Housing, water, electric, gas and other fuels; Furniture, houses appliances and home care services; Health; Transportation; Communication; Entertainment and culture; Educational services; Restaurant, home meals and hotels and Various good and services were taken. In this study, twelve commodity groups were emphasized above and focused.
12 month-consumer prices index figures were used from the Turkstat’s Price Statistics database. Price indexes belong to commodity groups were used separately for every commodities groups. After that price data were converted into real price values.
The data set created for study use was distributed by each item group. Moreover, the data which were regions in the cross section and 10 year-observations of 2002 and 2011 in the time section were combined and the panel data set was obtained. Thus, the data set used in the analysis consists of 120 observations.
In this section, how to make an estimation parameter of an almost ideal demand systems are shown as follows:
If the basic model is written for each commodity, the following equations might be obtained: w1 = 1 +1.1lnp1 + 1.2lnp2 + + 1.12lnp12 + 1ln (x/P*) + u1 w2 = 2 +2.1lnp1 + 2.2lnp2 + + 2.12lnp12 +2ln (x/P*) + u2 (1) ……… ……. w12 = 12 + 12.1lnp1 +12.2lnp2 + +12.12lnp12 +12ln(x/P*) + u12
In this equation, wi represents the budget share of ith good, pj is price of the jth good, x is total expenditure on all goods and P* is price index. It is possible to generalize and demonstrate the system in the equation 1 with matrices for n number of products and k number of variables: y = X + u
y = the column vector of the observations (n x1) relevant to yi dependent variable;
X = (nxk) matrix indicates n observation value of explanatory variables
from X1 to Xk and is known as data matrix. The first column composed of
one (1) values indicates the constant term.
β = the column vector of k number of unknown parameters (k x 1)
u = the column vector of n number of ui error terms (nx1).
Since additivity and negativity constraints are automatically met by the model in the AIDS, no test is done for these constraints.
The Almost Ideal Demand System (AIDS) was selected for the study use for its following advantages. The AIDS model provides arbitrarily the first order approximation for any demand system. It provides definite estimations of axioms of choice. It aggregates consumers perfectly. It has a functional form which is consistent with household budget data. It is easier to make estimations in the form of linear approach. It can be easily used to test homogeneity and symmetry constraints (Blanciforti and Green, 1983).
Price elasticity belongs to AIDS model are calculated as follows: (Ekinci, 1996). i i ij ii w
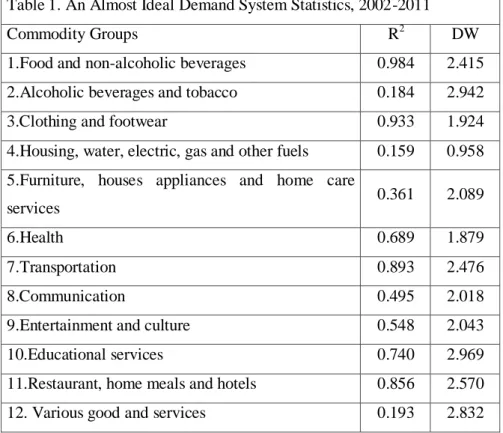
1 Price elasticity (2) 𝜀𝑖 = 1 +𝑤𝛽𝑖 𝑖 Expenditure elasticity RESULTSThe estimation of model parameters was calculated by The Least Squares method. Estimation of the model was made by using Eviews 7 econometrics package program. The data relevant to the commodity groups which take place in the Household Budget Survey of between 2002 and 2011 were applied to the An Almost Ideal Demand System (Table 1).
Table 1. An Almost Ideal Demand System Statistics, 2002-2011
Commodity Groups R2 DW
1.Food and non-alcoholic beverages 0.984 2.415
2.Alcoholic beverages and tobacco 0.184 2.942
3.Clothing and footwear 0.933 1.924
4.Housing, water, electric, gas and other fuels 0.159 0.958
5.Furniture, houses appliances and home care
services 0.361 2.089
6.Health 0.689 1.879
7.Transportation 0.893 2.476
8.Communication 0.495 2.018
9.Entertainment and culture 0.548 2.043
10.Educational services 0.740 2.969
11.Restaurant, home meals and hotels 0.856 2.570
12. Various good and services 0.193 2.832
In Table 1, R2 and DW values relevant to the almost ideal demand system
were given. According to these values, the lowest R2 value was in the Housing, water, electric, gas and other fuels with 0.159, while the highest value was found in the Food and non-alcoholic beverages with 0.984. DW values relevant to the almost ideal demand system were given in Table 1. For 120 observations at 5% level and twelve explanatory variables taken out of Durbin-Watson table, dL = 1.564 and du = 1.908. When the DW values were considered, there was negative autocorrelation in the groups of Alcoholic beverages and tobacco; Transportation; Educational services; Restaurant, home meals and hotels; Various good and services. Food and non-alcoholic beverages; Clothing and footwear; Furniture, houses appliances and home care services; Health; Communication; Entertainment and culture weren’t located positive or negative regions that were located in undecided region. We couldn’t reject hypothesis belong to positive or negative autocorrelations.
DW-value of Housing, water, electric, gas and other fuels was positive autocorrelation (Table 1).
Price and expenditure elasticities values belong to every commodity for AIDS model was calculated for estimated parameter values that were as follows in Table 2. Demands with an elasticity equal to one in absolute value are unit elastic; the demand is smoothly responsive to price changes. According to the AIDS model, price elasticities belong to are suitable for economic theory that is values of price elasticities are negative. While price elasticities of Clothing and footwear; Furniture, houses appliances and home care services; Health; Transportation; Entertainment and culture; Restaurant, home meals and hotels; and Various good and services are elastic, Food and non-alcoholic beverages; Alcoholic beverages and tobacco; Housing, water, electric, gas and other fuels; Communication and Educational services are inelastic.
When the price elasticities of the commodity groups are considered respectively, in case of 1% increase in Food and non-alcoholic beverages, this might be interpreted as demand for Food and non-alcoholic beverages will grow by 0.740%; demand for Alcoholic beverages and tobacco will grow by 0.513%; demand for Clothing and footwear will grow by 1.364%; demand for Housing, water, electric, gas and other fuels will grow by 0.781%; demand for Furniture, houses appliances and home care services will grow by 1.876%; demand for Health will grow by 1.757%, demand for Transportation will grow by 1.236%, demand for Communication will grow by 0.996%, demand for Entertainment and culture will grow by 1.949%, demand for Educational services will grow by 0.227%, demand for Restaurant, home meals and hotels will grow by 1.391% and demand for Various good and services will grow by 1.096%. The lowest and the highest price demand elasticities were observed in respectively Educational services and Furniture, houses appliances and home care services. In line with this, it is possible to say that consumers are more responsive to price changes in Furniture, houses appliances and home care services, and less responsive to price changes in Educational services. Negotiation of the products' price elasticities are calculated to be negative as expected in accordance with the economic theory.
Expenditure elasticity reveals how the demanded amounts of the products would differ in the face of income changes. In line with expenditure elasticities, properties of the products are defined. Those with an
expenditure elasticity higher than 0 are normal goods, whereas those with one less than 0 are inferior goods. Expenditure elasticity was calculated for each variable according to the estimated parameter values by using elasticity formulas with relevant to the Almost Ideal Demand System. Expenditure elasticities belong to the commodity groups are given in Table 2.
Table 2. Price And Expenditure Elasticities For Commodity Groups, 2002-2011
Commodity Groups Price Elasticity
Expenditure Elasticity
1.Food and non-alcoholic beverages -0.740 0.893
2.Alcoholic beverages and tobacco -0.513 0.897
3.Clothing and footwear -1.364 1.176
4.Housing, water, electric, gas and other
fuels -0.781 0.933
5.Furniture, houses appliances and home
care services -1.876 1.000
6.Health -1.757 1.246
7.Transportation -1.236 1.029
8.Communication -0.996 1.005
9.Entertainment and culture -1.949 0.813
10.Educational services -0.227 1.474
11.Restaurant, home meals and hotels -1.391 0.922
12.Various good and services -1.096 0.831
When Table 2 is examined, the expenditure elasticity was found to be 0.893 for Food and non-alcoholic beverages; 0.897 for Alcoholic beverages and tobacco; 1.176 for Clothing and footwear; 0.933 for Housing, water, electric, gas and other fuels; 1.000 for Furniture, houses appliances and home care services; 1.246 for Health; 1.029 for Transportation; 1.005 for Communication; 0.813 for Entertainment and
culture; 1.474 Educational services; 0.922 for Restaurant, home meals and hotels; 0.831 for Various good and services. It is understood that all of the goods examined are normal goods.
According to the calculated expenditure elasticity belong to the twelve commodities, assuming all the other variable constant, in case of an average increase of 1% in the household’s income, it is possible to say that Food and non-alcoholic beverages expenditures will increase by 0.893%; Alcoholic beverages and tobacco expenditures will increase by 0.897%; Clothing and footwear expenditures will increase by 1.176%; Housing, water, electric, gas and other fuels expenditures will increase by 0.933%; Furniture, houses appliances and home care services expenditures will increase by 1.000%; Health expenditures will increase by 1.246%; Transportation expenditures will increase by 1.029%; Communication expenditures will increase by 1.005%; Entertainment and culture expenditures will increase by 0.813%; Educational services expenditures will increase by 1.474%; Restaurant, home meals and hotels expenditures will increase by 0.922%; Various good and services expenditures will increase by 0.831%.
DISCUSSION
Price elasticities were found in line with the parameters estimated from the AIDS. Findings for the price elasticities for AIDS model are consistent with economic theory. At that time, price elasticities are negative. The lowest and the highest price demand elasticities were observed in respectively Educational services and Furniture, houses appliances and home care services. In line with this, it is possible to say that consumers are more responsive to price changes in Furniture, houses appliances and home care services, and less responsive to price changes in Educational services.
The lowest and the highest expenditure elasticities were observed in respectively Entertainment and culture and Educational services. It is understood that all of the goods examined are normal goods.
With the help of the studies relevant to the analysis of consumption expenditures, producers will gain knowledge about the structure of consumer demand, while consumers will gain knowledge about learning and determining consumption patterns. In line with this, in the analysis of
production units, production decisions, and sector, decision-makers, that are managers, will benefit from these analysis results while they elaborate effective macro-economic policies.
REFERENCES
BLANCIFORTI, L.A. ve R.D. Green (1983). “An Almost Ideal Demand System Incorporating Habits: An Analysis of Expenditures on Food and Aggregate Commodity Groups”, Review of Economics and Statistics, 65, 511-15.
BLANCIFORTI, L.A., Green R.D. ve G.A. King (1986). “U.S. Consumer Behaviour Over the Postwar Period: An Almost Ideal Demand System Analysis”, Giannini Monograph, 40.
DEATON A. ve J. Muellbauer (1980). “An Almost Ideal Demand System”, The American Economic Review, 70, 312-326.
EKİNCİ, S. (1996). “Türkiye’de Bazı Gıda Maddelerinin Talep Analizi”, Ankara: Çukurova Üniversitesi.
HUTASUHUT, M,, Chang, H.S., Griffith, G,, O’Donnell, C ve H. Doran (2001). “The Demand for Beef in Indonesia: Implications for Australian Agribusiness”, Agricultural and Resource Economics, 4, 2-12.
KOÇ, A. (1995). “Türkiye’de Kırmızı Et Arz ve Talebinin Ekonometrik Analizi ve Kırmızı Et Sanayi Yapısı ile İşleyişinin İncelenmesi”, Çukurova Üniversitesi.
NİŞANCI, M. (2002). “Kırsal ve Kentsel Kesimlerde Tüketim ve Tasarruf Kalıpları Genişletilmiş Doğrusal Harcama Sistemi Uygulaması”, İktisadi ve İdari Bilimler Dergisi, 16, 60-73.
POLLAK, R.A. ve T,J. Wales (1987). “Pooling International Consumption Data”, The Review of Economics and Statistics, 69, 90-99. ŞAHİNLİ, M.A. (2010). “Estimation of Expenditure and Price Elasticities with an Almost Ideal Demand System”, Eskişehir Osmangazi Üniversitesi İibf Dergisi, 5(2), 147-159.
ŞAHİNLİ, M.A. ve H. Fidan (2012). “Estimation of food demand in
Turkey: method of an almost ideal demand system”, Quality&Quantity, 46, 653–663.