online ISSN: 2247 - 806X; p-ISSN: 2247 – 8051; ISSN - L = 2247 - 8051 © JPES
Original Article
Evaluation of the Relationship between Financial Performance and Sport Success
in European Football
ILKER SAKINC1, SULEYMAN ACIKALIN2, AYDOGAN SOYGUDEN3
1
Hitit University, Faculty of Business and Administration, TURKEY
2
Hitit University, Faculty of Business and Administration, TURKEY
3
Erciyes University, School of Physical Education and Sport, TURKEY Published online: February 15, 2017
(Accepted for publication December 20, 2016) DOI:10.7752/jpes.2017.s1003
Abstract:
It is believed that sports and financial performances are linked to each other. Football clubs with weak financial performance are generally in bad positions in terms of sports success. On the other hand, there are only a limited number of football clubs which are in good financial standing without achieving serious sports success. After the increasing number of financial distress reports coming from various European football clubs and the concern about the role of external funds providers, the UEFA decided to increase its controlling power over the football industry and introduced a new set of rules known as the “financial fair play” in 2009. The purpose of this study is to analyze the financial performance of 22 football clubs listed on various European stock markets with the TOPSIS method, and to compare the results with the UEFA club rankings with the Spearman’s rank correlation method. Ten financial ratios are used to obtain the ranking of these football clubs with the TOPSIS method. The Spearman’s correlation coefficient is calculated as 0.17 and the test result do not indicate a statistically significant relation between sports success and financial performance.
Key Words: Football Clubs, Financial Performance, Topsis Method Introduction
Football is not only a sports game anymore. It is a key part of the global sports industry. Football clubs have turned the game into a billion dollar business by the commercialization of the game itself, their players and all products related to game such as names, stadiums, jerseys, and etc. Moreover, football clubs started to integrate their trademarks into various services, such as telephone services, credit cards with club advantages, using sponsorship agreements while naming their sports team or their stadiums.
There is a very intense competition among football clubs in the European football arena. The meaning of success in sports and in finance is two different concepts. When the top performers of the European football clubs were reviewed, it is relatively easy to determine that success in the European football arena requires big budgets. The analysis of football clubs’ financial performance could provide some insights to this matter.
Generally football clubs have been established as associations due to tax benefits and other legal advantages of the status. Associations are a form of non-profit organizational structure and financial success is not generally an important goal for them. However, after the game had turned into a billion dollar business the understanding of football club management has changed. Finding funds to establish a strong football team with a top coach who is goal oriented, winning championship cups on a national and international level became a critical issue.
The UEFA Executive Committee accepted the need for a new set of rules and regulations to provide “financial fair play” for the European football industry in 2009. The main aim is the long term viability of the European club football. The new rules imposed more discipline on club football finances. Football clubs are encouraged to invest in the infrastructure and the youth sector on one hand, and to compete with their revenues without external funds coming in and to settle their liabilities in a timely manner on the other hand (UEFA, 2015). The Club Financial Control Body (CFCB) was created as a new unit consisting of independent legal and financial experts who will be monitoring the implementation of new rules (Franck, 2014). These regulations imply the existence of an implicit relationship between the financial health and sporting success at least for the whole European football industry in the long run. Generally the financial performance of companies is related to success in their line of business. Therefore, it is quite normal to expect such a positive relation between the two criteria in the European football industry. There are however, other factors which could create a negative impact on the financial performance side. Sports club presidents and managers are generally ready to take financial risks to reach sports success, such as national or international championships. Football club presidents are generally chosen among wealthy businessmen as a result of increasing financing pressure on football clubs.. However, this situation might cause the exploitation of football clubs and personal interests could surpass the interest of the clubs. This point and its possible effects could be analyzed with the help of the principal-agent model
--- framework. Therefore, one might argue that there could be a negative relationship between sports success and financial results in the short run.
Corporate governance is the most suitable model answering the financial needs of football clubs. Football clubs whose shares are publicly traded in Italy, Canada and England must obey the corporate governance rules. In other words, corporate governance is a prerequisite for going public (Sonmez and Toksoy, 2011). In conclusion, clubs using corporate governance successfully have a better chance in finding funds from the capital markets, reducing the cost of capital, and reaching a better liquidity position (Ozturk and Demirgunes, 2008). Another advantage of corporate governance is to solve financial difficulties relatively easily.
The purpose of this study is first to rank the sports clubs listed in various European stock markets according to the selected financial criteria with the TOPSIS (Technique for Order Preference by Similarity to Ideal Solution) method which is one of the MCDM methods. Second, the ranking obtained by the TOPSIS method is going to be compared with the sports success ranking provided by the UEFA using the Spearman’s rank coefficient method. There are five sections in this study. The second section is a review of the literature on the topic of financial performance and sports success relations. The data and methodology is given in section 3. The main findings are discussed in section 4. Next, concluding remarks are presented in the final section of the paper.
Literature Review
Finance and sports sciences are quite different disciplines. The number of interdisciplinary studies related to these fields is on the rise. A significant part of these studies focused on the effects of sporting success on financial results. There are various studies analyzing the effects of match scores on the stock prices (Berument et al. 2006, Aygoren 2008) and the revenues (Barajas et al. 2005; Syzmanski and Kuypers 1999; Solberg and Gratton 2004) of publicly traded sports companies. These studies concluded that sports success increased the stock prices and the revenues of the teams.
There are other studies questioning the effects of sporting success on the financial results at a national team level (Ashton et al. 2003; Boyle and Walter 2003; Edmans et al. 2007; Smith 2010). The purpose of these studies was to measure the effects of national teams’ results on the relevant country’s stock market performance. The effects of national teams’ match results on the psychology of investors were analyzed using the behavioral finance theories. Ashton et al. (2003) concluded that the match results of the England football team affected the FTSE 100 index. The study offered two explanations for this result. The first one is called by the authors as the “good feel factor”, which implies that national team’s success increases the confidence of investors’ about the future. The second one is the belief that an efficient stock market will provide a better return for a successful team moving towards the international tournament finals. Success in international tournaments would increase the shares of the team from tournament revenues. Edmans et al. (2007) found a significant market decline following losses by national teams in international tournaments. According to their explanations match results affect the mood of investors and this change in mood would result in a change in the stock market index. On the other hand, Boyle and Walter (2003) argued that no significant effect was found in the stock market in New Zealand following the losses experienced by the national Rugby team. Olympic Games were used to study the reaction of stock markets to the host city announcement by the Olympic Committee (Veravos et al 2004; Dick and Wang 2010; Mirman and Sharma 2010; Berman et al. 2000). These articles used the event study methodology in questioning the reaction of stock markets to the announcements of Olympic Games host cities. Recently some studies used multi criteria decision making (MCDM) models in evaluating the financial performances of sports clubs (Atmaca 2012; Ecer and Boyukaslan 2014; Sakinc 2014). These studies ranked the Turkish football clubs listed in Borsa Istanbul according to the selected financial criteria.
Data and Methodology
Time period and Sports Clubs included in the analysis
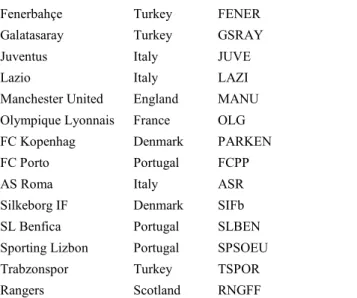
Data for 22 European football clubs listed on the stock exchange in Europe is gathered from Thomson Reuters Eikon. The average value of each financial ratio is used for a ten year period of 2005-2014. The sports clubs with their country and the stock market codes are listed in Table 1 below.
The index accurately represents the breadth and depth of the European football industry Table 1. The List of the sports clubs used in the analysis
CLUBS COUNTRY CODES
Aalborg Boldspilklub Denmark AAB AIK Fotboll AB Sweden AIKb. Aarhus Elite Denmark ELITEb
Beşiktaş Turkey BJKAS
Borussia Dortmund Germany BVB Brondby IF Denmark BIF
Celtic Scotland CCP
---
Fenerbahçe Turkey FENER
Galatasaray Turkey GSRAY
Juventus Italy JUVE
Lazio Italy LAZI
Manchester United England MANU Olympique Lyonnais France OLG FC Kopenhag Denmark PARKEN
FC Porto Portugal FCPP
AS Roma Italy ASR
Silkeborg IF Denmark SIFb SL Benfica Portugal SLBEN Sporting Lizbon Portugal SPSOEU Trabzonspor Turkey TSPOR
Rangers Scotland RNGFF
Selected financial ratios used in the analysis
Ten selected financial ratios are used in this study: two of these ratios are called activity ratios (A1 and A2); two of them are liquidity ratios (L1 and L2); three of them are profitability ratios (P1, P2, and P3); and three of them are solvency ratios (S1, S2, and S3).
Table 2. Financial Ratios and Formulations
Ratios Formula Goal
A1.Receivables Turnover Credit Sales/Average Receivables Maximum
A2. Average Cash Conversion Cycle (Days Sales in Inventory + Average Collection Period) - (Days Payable Outstanding)
Minimum
L1. Current Ratio Current Assets/Short Term Liabilities Maximum
L2. Quick Ratio Cash and Cash Equivalents/Short Term Liabilities Maximum
P1. ROA Net Income / Total Assets Maximum
P2. ROE Net Income / Equity Maximum
P3. EBITDA Margin Earnings Before Interest, Taxes, Depreciation and Amortization/Total Sales Revenue
Maximum S1. Long Term Debt to Total Assets
Ratio
Long term Liabilities/Total Assets Minimum
S2. Debt to Equity Ratio Total Liabilities/Equity Minimum
S3. Interest Coverage Ratio Earnings Before Interest and Taxes/ Interest Expense Maximum The TOPSIS Method
TOPSIS method is one of the MCDM methods. This method is improved by Chen and Hwang (1992) based on the initial model developed by Hwang and Yoon (1981). The basis of the method is based on the alternative selection to the shortest distance to Positive-Ideal Solution and the longest distance to the Negative-Ideal Solution. The method consists of six steps.
1st Step: Setting up the Decision Matrix
The lines in the decision matrix represents the alternatives (i=1, 2, …, m) and the columns represents the attributes to be used in the evaluation (j=1, 2, …, n). There are 22 football clubs as alternatives and 10 financial ratios as criterion
2nd Step: Construction of the normalized decision matrix Rij
rij normalization values are calculated according to the following formula
--- The following matrix with normalized values was obtained based on the normalization formula presented above:
3rd Step: Constructing the weighted normalized matrix
The weighted normalized matrix is calculated by multiplying the normalized matrix with the determined weights for each criterion. The weight for each of the 10 financial ratios is used as 0.1 in the study.
Vij= wij x rij
4th Step: Determining positive and negative ideal points (A+ and A-) A+ = {V1 + , V2 +………. Vn+} A- = {V1-, V2-……….... Vn-}
5th Step: Calculating the separation measure
The separation of each football club’s from the ideal one (S+) and the worst one (S-) are calculated according to the following formulas
i = 1, 2, … , m
i = 1, 2, … , m
6th Step: Calculating the relative closeness to the ideal solution and ranking the alternatives in a descending order
The calculation is done according to the following formula
i = 1, 2, … , m
The UEFA Football Clubs Ranking
510 football clubs are listed by the UEFA as the “UEFA Club Ranking”. This ranking is based on the results of each club in the five previous UEFA Champions League and UEFA Europa League seasons (footballseeding.com, 2015).
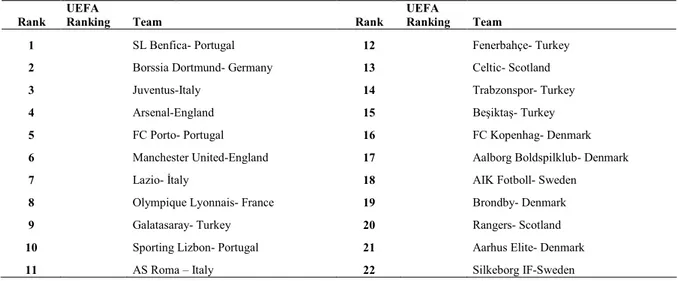
The 22 football clubs whose financial performances analyzed are reordered according to their respective places on the UEFA list and the list is provided below as Table 3.
Table 3. Sports Club Rankings Based on the UEFA Club Rankings
Rank
UEFA
Ranking Team Rank
UEFA
Ranking Team
1 SL Benfica- Portugal 12 Fenerbahçe- Turkey
2 Borssia Dortmund- Germany 13 Celtic- Scotland
3 Juventus-Italy 14 Trabzonspor- Turkey
4 Arsenal-England 15 Beşiktaş- Turkey
5 FC Porto- Portugal 16 FC Kopenhag- Denmark
6 Manchester United-England 17 Aalborg Boldspilklub- Denmark
7 Lazio- Đtaly 18 AIK Fotboll- Sweden
8 Olympique Lyonnais- France 19 Brondby- Denmark
9 Galatasaray- Turkey 20 Rangers- Scotland
10 Sporting Lizbon- Portugal 21 Aarhus Elite- Denmark
11 AS Roma – Italy 22 Silkeborg IF-Sweden
Spearman’s Correlation Coefficient
Spearman's rank correlation coefficient measures the degree of relationship between two ranked variables. When two samples are normally distributed a correlation analysis could be performed with the Pearson correlation method. In our case, two samples are not normally distributed and therefore the Spearman’s rank
--- correlation method is employed. A monotonic relationship between two samples is another assumption used by the Spearman’s rank correlation method. The values are converted to ranks before computing the correlation coefficient in case of Spearman’s correlation method.
The non-parametric Spearman’s rank correlation coefficient is used to determine whether there is a relationship exists between sports performance and financial performance of the selected 22 European football clubs.
Main Findings
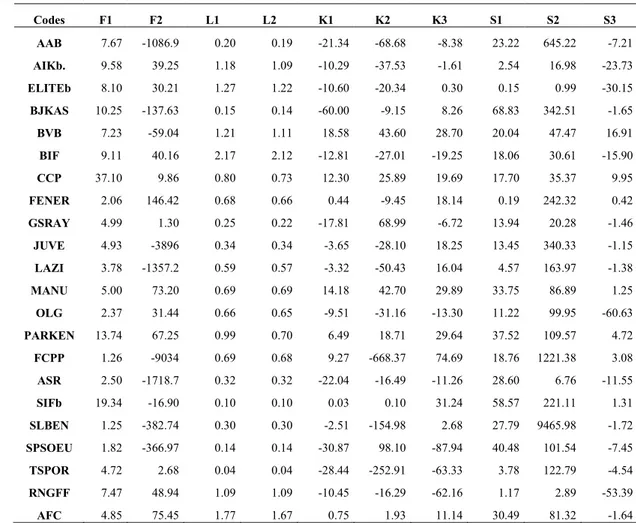
Ten selected financial ratios of 22 football clubs publicly traded in the European stock markets are used to obtain a ranking of these clubs with the TOPSIS method. Table 4 below shows the data required for the first step of the TOPSIS method which is called the decision matrix. Following this, Table 5 on the other hand, provides the final ranking obtained with the TOPSIS method with the sports success ranking obtained from the UEFA club ranking.
Table 4. Decision Matrix
Codes F1 F2 L1 L2 K1 K2 K3 S1 S2 S3 AAB 7.67 -1086.9 0.20 0.19 -21.34 -68.68 -8.38 23.22 645.22 -7.21 AIKb. 9.58 39.25 1.18 1.09 -10.29 -37.53 -1.61 2.54 16.98 -23.73 ELITEb 8.10 30.21 1.27 1.22 -10.60 -20.34 0.30 0.15 0.99 -30.15 BJKAS 10.25 -137.63 0.15 0.14 -60.00 -9.15 8.26 68.83 342.51 -1.65 BVB 7.23 -59.04 1.21 1.11 18.58 43.60 28.70 20.04 47.47 16.91 BIF 9.11 40.16 2.17 2.12 -12.81 -27.01 -19.25 18.06 30.61 -15.90 CCP 37.10 9.86 0.80 0.73 12.30 25.89 19.69 17.70 35.37 9.95 FENER 2.06 146.42 0.68 0.66 0.44 -9.45 18.14 0.19 242.32 0.42 GSRAY 4.99 1.30 0.25 0.22 -17.81 68.99 -6.72 13.94 20.28 -1.46 JUVE 4.93 -3896 0.34 0.34 -3.65 -28.10 18.25 13.45 340.33 -1.15 LAZI 3.78 -1357.2 0.59 0.57 -3.32 -50.43 16.04 4.57 163.97 -1.38 MANU 5.00 73.20 0.69 0.69 14.18 42.70 29.89 33.75 86.89 1.25 OLG 2.37 31.44 0.66 0.65 -9.51 -31.16 -13.30 11.22 99.95 -60.63 PARKEN 13.74 67.25 0.99 0.70 6.49 18.71 29.64 37.52 109.57 4.72 FCPP 1.26 -9034 0.69 0.68 9.27 -668.37 74.69 18.76 1221.38 3.08 ASR 2.50 -1718.7 0.32 0.32 -22.04 -16.49 -11.26 28.60 6.76 -11.55 SIFb 19.34 -16.90 0.10 0.10 0.03 0.10 31.24 58.57 221.11 1.31 SLBEN 1.25 -382.74 0.30 0.30 -2.51 -154.98 2.68 27.79 9465.98 -1.72 SPSOEU 1.82 -366.97 0.14 0.14 -30.87 98.10 -87.94 40.48 101.54 -7.45 TSPOR 4.72 2.68 0.04 0.04 -28.44 -252.91 -63.33 3.78 122.79 -4.54 RNGFF 7.47 48.94 1.09 1.09 -10.45 -16.29 -62.16 1.17 2.89 -53.39 AFC 4.85 75.45 1.77 1.67 0.75 1.93 11.14 30.49 81.32 -1.64
The final result of the TOPSIS method ranking football clubs in a descending order is presented as Table 5 below.
Table 5. TOPSIS Ranking
Rank Team Rank Team
1 Celtic-Scotland 12 Aarhus Elite- Denmark
2 Juventus-Italy 13 FC Porto- Portugal
3 Borussia Dortmund- Germany 14 Aalborg Boldspilklub- Denmark
4 FC Kopenhag- Denmark 15 AS Roma – Italy
5 Arsenal-England 16 Galatasaray- Turkey
6 Lazio- Italy 17 Olympique Lyonnais- France
7 Manchester United-England 18 Rangers- Scotland
8 Brondby- Denmark 19 Beşiktaş- Turkey
9 AIK Fotboll- Swiss 20 Trabzonspor- Turkey
10 Fenerbahçe- Turkey 21 SL Benfica- Portugal
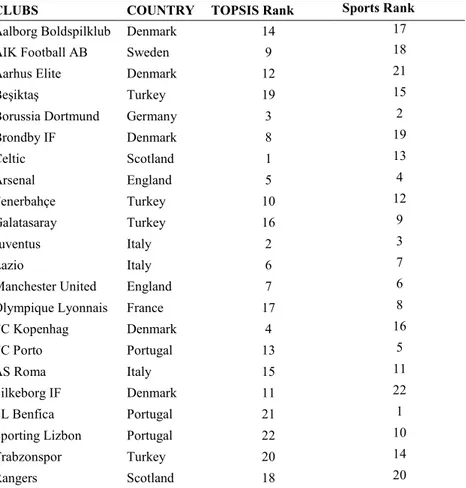
--- Celtic the Scottish football team is ranked first in our list. The Italian giant Juventus is ranked second and followed by the long-established German team, Borissia Dortmund. FC Kopenhag is ranked 4th even though this team does not have a big sportive success in the European football arena. Arsenal, Lazio, and Manchester United, which are highly recognized and relatively a highly success teams of Italy and England, are ranked as the 5th, the 6th, and the 7th according to their financial performances. SL Benfica and Sporting CP Lisbon, two of the Portugal's oldest and the most successful sports clubs are positioned at the bottom of the lists as 21st and 22nd. The best financial performer among the Turkish football clubs is Fenerbahçe listed at the 10th position while Galatasaray and Beşiktaş are ranked 16th and 19th, respectively. The financial ranking of the 22 clubs was obtained from the TOPSĐS method. On the other hand, the sports performance of these 22 clubs are obtained using the UEFA’s rankings consisted of 510 clubs after reordering the 22 clubs according to their respective positions in the UEFA list.
Table 6. TOPSIS and Sports Rankings
CLUBS COUNTRY TOPSIS Rank Sports Rank
Aalborg Boldspilklub Denmark 14 17
AIK Football AB Sweden 9 18
Aarhus Elite Denmark 12 21
Beşiktaş Turkey 19 15
Borussia Dortmund Germany 3 2
Brondby IF Denmark 8 19 Celtic Scotland 1 13 Arsenal England 5 4 Fenerbahçe Turkey 10 12 Galatasaray Turkey 16 9 Juventus Italy 2 3 Lazio Italy 6 7
Manchester United England 7 6
Olympique Lyonnais France 17 8
FC Kopenhag Denmark 4 16
FC Porto Portugal 13 5
AS Roma Italy 15 11
Silkeborg IF Denmark 11 22
SL Benfica Portugal 21 1
Sporting Lizbon Portugal 22 10
Trabzonspor Turkey 20 14
Rangers Scotland 18 20
The Spearman’s rank correlation coefficient is calculated as 0.1417. It indicates a positive but quite low correlation that exists between sports success and the financial performance of the 22 European football clubs for the period of 2005-2014 periods. However, since the p-value of the test is 0.5293 (Prob > |t| = 0.5293) we do not reject the null hypothesis stating that the two rankings are independent.
Conclusion
The financial performance and sports success relationship is analyzed with the example of 22 European football clubs listed on various European Stock Exchanges. The financial performance of these clubs was evaluated with the help of the TOPSIS method and a ranking of the teams was obtained. The UEFA rankings were obtained from the official UEFA web site and the ranking of 22 teams in the study were rearranged according to their respective places on the original UEFA list. The 5 year average values of these teams’ rankings determined the final sports success ranking.
The relation between sports successes and financial performance was tested with the Spearman’s rank coefficient. The value of this coefficient is 0.1417. It shows a weak but positive correlation between sports success and the financial performance based on the data for 22 European football clubs for the period of 2005-2014. This, however, is not sufficient to conclude that there is a positive and statistically significant correlation exists between the two. The p-value of the test is 0.5293 and therefore we have to conclude that the null hypothesis stating that “the UEFA ranking and sports success rankings are independent” cannot be rejected. In short, this study does not provide statistical evidence to state that financial performance and sports success are positively linked to each other. There are studies showing that sports success positively affects the share prices and total revenues of the teams. Therefore, it is possible to argue that there should be a significant positive correlation between sports success and financial performance. However, the effect on the stock price is measured
--- on a daily basis and the effect on revenues measured for each season separately, and therefore it is probably easy to capture this effect in a short-term analysis. In order to capture a similar effect in the long run more time is probably needed for all European football clubs to be monitored by strict common regulations such as the “fair play rules” of the UEFA. Only 22 football clubs listed on various stock markets are used in this study. In order to obtain more reliable results, data for other clubs which are not listed on stock markets should be included while questioning the sports success and financial performance correlation.
References
Ashton, J. K., Gerrard, B., & Hudson, R. (2003). Economic impact of national sporting success: evidence from the London stock exchange. Applied Economics Letters, 10(12), 783-785.
Atmaca, M. (2012). ĐMKB’de işlem gören spor şirketlerinin TOPSIS yönetimi ile finansal performans değerlendirmesi. Iktisat Isletme ve Finans, 27(320), 91-108.
Aygören, H., Uyar, S., & Sarıtaş, H. (2008). Yatırımcılar Futbol Maçlarının Sonuçlarından Etkilenir Mi? Đstanbul Menkul Kıymetler Borsası’nda Bir Uygulama. HÜ Đktisadi ve Đdari Bilimler Dergisi, 26(1), 121-137.
Barajas, A., Fernández-Jardón, C. M., & Crolley, L. (2005). Does sports performance influence revenues and economic results in Spanish football? Available at SSRN 986365.
Berman, G., Brooks, R., & Davidson, S. (2000). The Sydney Olympic Games announcement and Australian stock market reaction. Applied Economics Letters, 7(12), 781-784.
Berument, H., Ceylan, N. B., & Gozpinar, E. (2006). Performance of soccer on the stock market: Evidence from Turkey. The Social Science Journal, 43(4), 695-699.
Boyle, G., & Walter, B. (2003). Reflected glory and failure: International sporting success and the stock market. Applied Financial Economics, 13(3), 225-235.
Chen, S. J., & Hwang, C. L. (1992). Fuzzy multiple attribute decision making methods (pp. 289-486). Springer Berlin Heidelberg.
Dick, C. D., & Wang, Q. (2010). The economic impact of the Olympic Games: evidence from stock markets. Applied Economics Letters, 17(9), 861-864.
Ecer, F., & Boyukaslan, A. (2014). Measuring Performances of Football Clubs Using Financial Ratios: The Gray Relational Analysis Approach. American Journal of Economics, 4(1), 62-71.
Edmans, A., Garcia, D., & Norli, Ø. (2007). Sports sentiment and stock returns. The Journal of Finance, 62(4), 1967-1998.
Footballseeding.com, (2015), Club Ranking 2015-16, (http://www.footballseeding.com/club-ranking/a2015-2016/)
Franck, E. P. (2014). Financial Fair Play in European Club Football-What is it All About?. University of Zurich, Department of Business Administration, UZH Business Working Paper, (328).
Hwang, C. L., & Yoon, K. (1981). Multiple criteria decision making. Lecture Notes in Economics and Mathematical Systems.
Karpavicius, T., & Jucevicius, G. (2009). The application of the business system concept to the analysis of football business. Engineering Economics, 63(4). 86-95.
Mahmoodzadeh, S., Shahrabi, J., Pariazar, M., & Zaeri, M. S. (2007). Project selection by using fuzzy AHP and TOPSIS technique. International Journal of Human and social sciences, 1(3), 135-140.
Michie, J., & Oughton, C. (2005). The corporate governance of professional football clubs in England. Corporate Governance: An International Review, 13(4), 517-531.
Mirman, M., & Sharma, R. (2010). Stock market reaction to Olympic Games announcement 1. Applied Economics Letters, 17(5), 463-466.
Öztürk, M. B. ve K. Demirgüneş, “Kurumsal Yönetim Bakış Açısıyla Entelektüel Sermaye”, Selçuk Sosyal Bilimler Enstitüsü Dergisi, Cilt 19, 2008, 395- 411.
Sakınç, Đ. (2014). Using Grey Relational Analysis to Determine the Financial Performance of Turkish Football Clubs. Journal of Economics Library, 1(1), 22-33.
Smith, B., & Krige, N. (2010). National sporting success and investor optimism. South African Journal of Business Management, 18-21.
Solberg, H. A., & Gratton, C. (2004). Would European soccer clubs benefit from playing in a Super League? Soccer & Society, 5(1), 61-81.
Sönmez, A., & Toksoy, A. (2011). “Kurumsal Yönetim Đlkelerinin Türkiye’deki Aile Đşletmelerine Uygulanabilirliği.” Maliye Finans Yazıları, 92, 51-90.
Szymanski, S. & Kuypers, T., (1999). Winners and Losers, the Business Strategy of Football. London: Viking. UEFA, (2015). Financial Fair Play,
(http://www.uefa.org/protecting-the-game/club-licensing-and-financial-fair-play/).
Veraros, N., Kasimati, E., & Dawson, P. (2004). The 2004 Olympic Games announcement and its effect on the Athens and Milan stock exchanges. Applied Economics Letters, 11(12), 749-753.