NUMERICAL INVESTIGATION OF SPRAY DEHUMIDIFICATION PROCESS OF MOIST AIR
ALI FARNOUD
A THESIS SUBMITTED IN PARTIAL FULFILLMENT OF THE REQUIREMENTS FOR THE DEGREE OF
MASTER OF SCIENCE
THE DEPARTMENT OF MECHANICAL ENGINEERING
TOBB UNIVERSITY OF ECONOMICS AND TECHNOLOGY THE GRADUATE SCHOOL OF NATURAL AND APPLIED SCIENCES
DECEMBER 2014 ANKARA
i
Approval of the Graduate School of Natural and Applied Sciences.
_______________________________ Prof. Dr. Osman EROĞUL
Director
I certify that this thesis satisfies all the requirements as a thesis for the degree of Master of Science.
_______________________________ Assoc. Dr. Murat Kadri AKTAŞ Head of Department This is to certify that we have read this thesis and that in our opinion it is fully adequate, in scope and quality, as a thesis for the degree of Master of Science.
_____________________________
Assoc. Dr. Murat Kadri AKTAŞ Supervisor
Examining Committee Members
Chair : Prof. Dr. Haşmet TÜRKOĞLU ____________________________ Member : Assoc. Dr. Murat Kadri AKTAŞ ____________________________ Member : Asst. Dr. Özgür BAYER ____________________________
ii
TEZ BİLDİRİMİ
Tez içindeki bütün bilgilerin etik davranış ve akademik kurallar çerçevesinde elde edilerek sunulduğunu, ayrıca tez yazım kurallarına uygun olarak hazırlanan bu çalışmada orijinal olmayan her türlü kaynağa eksiksiz atıf yapıldığını bildiririm.
I hereby declare that all the information provided in this thesis was obtained with rules of ethical and academic conduct. I also declare that I have cited all sources used in this document, which is written according to the thesis format of the Institute.
iii
University : TOBB University of Economics and Technology Institute : Graduate School of Natural and Applied Sciences Science Programme : Mechanical Engineering
Supervisor : Associate Professor Murat Kadri AKTAŞ Degree Awarded and Date : M.Sc. – December 2014
ALI FARNOUD
NUMERICAL INVESTIGATION OF SPRAY DEHUMIDIFICATION PROCESS OF MOIST AIR
ABSTRACT
This investigation focuses on the heat and mass transfer in dehumidification process of the moist air. The interaction of water droplets with the hot, moist air which is flowing in contrary to the water spray is studied in a chamber. Two dimensional and three dimensional simulations are performed in order to study the effect of various parameters on heat and mass transfer.The parameters such as droplet diameter, spray mass flow rate, droplet temperature, number of injections, spray cone angle, and spray location are considered. The results show that smaller droplets lead to higher humidity reduction at the outlet. However droplet size effect on temperature and relative humidity depends on the optimum radius. If droplets are smaller than optimum radius, increasing their size results in enhancement of heat transfer. On the other hand, if droplets are larger than the optimum radius, by increasing the droplet diameter heat transfer decreases. It is found that heat and mass transfer are proportional to mass flow rate of the spray. Furthermore results indicate that decreasing the coolant temperature causes humidity and temperature reduction at the outlet. In addition, spray cone angle effect is found to be negligible. Results demonstrate that using more sprays in the chamber helps to diffuse the droplets to regions close to the wall. It is concluded that location of the spray does not have significant effect on bulk temperature at the outlet.
Key words: droplet, spray dehumidification, direct contact condensation, multiphase flow.
iv
Üniversitesi : TOBB Ekonomi ve Teknoloji Üniversitesi
Enstitüsü : Fen Bilimleri
Anabilim Dalı : Makine Mühendisliği
Tez Danışmanı : Doç. Dr. Murat Kadri AKTAŞ
Tez Türü ve Tarihi : Yüksek Lisans – Aralık 2014 ALİ FARNOUD
SPREYLE NEM ALMA İŞLEMİNİN SAYISAL ANALİZİ ÖZET
Bu çalışmada nemli havanın neminin alınması işlemindeki ısı ve kütle transferi araştırılmıştır. Yapılan araştırmada su spreyinin tersi yönünde akan sıcak nemli hava ile su damlacıklarının etkileşimi bir kanal içerisinde incelenmiştir. Çeşitli parametrelerin ısı ve kütle transferine etkisini incelemek için iki boyutlu ve üç boyutlu simülasyonlar geliştirilmiştir. Bir parametrenin etkisinin incelenmesi üzerine çalışılırken, diğer tüm parametreler sabit tutulmuştur. Damlacık çapı, sprey kütle akış hızı, damlacık sıcaklığı, enjeksiyon sayısı ve sprey açısı gibi parametreler çalışmada analiz edilmiştir. Ancak, damlacık boyutunun sıcaklık ve bağıl nem üzerine etkisi optimum yarıçapa bağlıdır. Eğer damlacıkların boyutu optimum yarı çaptan küçük olursa, damlacık boyutlarındaki büyüme ısı transferini iyileştirmeye yönelik etki gösterir. Öte yandan, damlacıkların boyutu optimum yarı çaptan büyük olursa, damlacık boyutları büyüdükçe ısı transferi azalır. Isı ve kütle transferi miktarının, spreyin kütlesel debisi ile orantılı olduğu görülmüştür. Ayrıca elde edilen sonuçlar soğutucu sıcaklığındaki azalmanın, çıkışta nem ve sıcaklık değerlerinin azalmasına sebep olduğunu göstermektedir. Ek olarak, sprey açısı etkisinin ihmal edilebilir olduğu görülmüştür. Elde edilen sonuçlar doğrultusunda, kanalda fazla sayıda sprey kullanımının nem alma etkisini duvara yakın bölgelere yaydığı gözlemlenmiştir. Ayrıca spreyin konumunun çıkıştaki yığın sıcaklığına önemli bir etkisi olmadığı belirlenmiştir.
Anahtar Kelimeler: damlacık, sprey nem alma, doğrudan temas yoğuşması, iki fazlı akış
v
ACKNOWLEDGEMENT
Many people have made significant contributions to this work. I am using this opportunity to express my gratitude to everyone who supported me throughout my studies.
Firstly I would like to thank my lovely parents who always supported me and taught me the ethics of life. I am sincerely grateful to them for sharing their truthful and illuminating views on a number of issues related to humanity and philosophy of life.
I would like to express my sincere gratitude to my research advisor, Associate Professor Murat Kadri AKTAŞ for his support, guidance and encouragement throughout this work.
I would like to thank the Turkish Ministry of Science, Industry and Technology and ARÇELIK Company for their support of research funding. This work was supported under grant number of 1488.STZ.2012-2.
I would like to thank all members of the Heat Transfer Laboratory that always helped me when I had any problem or difficulty in Turkey.
vi CONTENT TEZ BİLDİRİMİ ... ii ABSTRACT ... iii ÖZET... iv ACKNOWLEDGEMENT ... v CONTENT ... vi LIST OF TABLES ... x LIST OF FIGURES ... xi ABBREVIATIONS ... xvi
LIST OF SYMBOLS ... xvii
1. INTRODUCTION AND MOTIVATION ... 1
2. LITERATURE REVIEW... 4 2.1. Experimental Investigations ... 4 2.2. Analytical Investigations ... 9 2.3. Numerical Investigations ... 10 3. PROBLEM DESCRIPTION ... 15 3.1. Mathematical Model ... 15
3.1.1. Mass Conservation Equation... 16
3.1.2. Momentum Transfer Equation ... 16
3.1.3. Energy Equation ... 16
vii
3.1.5. Equation of Motion for Droplets ... 17
3.1.6. Species Transport Equations ... 18
3.1.7. Heat and Mass Transfer Mechanism ... 18
3.1.7.1. Evaporation Model ... 20
3.1.7.2. Condensation Model ... 20
3.1.8. Integration of Particle Motion Equation ... 22
3.1.9. Turbulent Dispersion of Particles ... 22
3.2. Boundary Conditions ... 23
3.2.1. Continuous Phase Boundary Conditions ... 23
3.2.2. Spray Initial Conditions ... 23
3.2.3. Wall Boundary Conditions ... 24
3.2.4. Outlet Boundary Conditions ... 24
3.3. Numerical Model ... 24
3.3.1. Air-Vapor Mixture Model ... 24
3.3.2. Solution Method ... 25
3.4. Material Properties ... 25
3.5. Grid Independency Analysis ... 26
4. TWO DIMENSIONAL ANALYSIS ... 27
4.1. A Base Case Study ... 27
4.1.1. Evaporation and Condensation Mechanism ... 34
viii
4.2.1. Effect of Droplet Diameter... 36 4.2.1.1. Effect of Droplet Size on Penetration ... 40 4.2.1.2. Effect of the droplet diameter on flow pattern on the horizontal centerline ... 41 4.2.1.3. Effect of droplet diameter on flow pattern at the outlet cross section ... 44 4.2.1.4. Effect of droplet diameter on mass-weighted average values of the parameters ... 47 4.2.2. Effect of Spray Mass Flow Rate ... 49
4.2.2.1. Effect of mass flow rate on flow pattern on the horizontal centerline ... 51 4.2.2.2. Effect of mass flow rate on flow pattern at the outlet cross section . 53 4.2.2.3. Effect of mass flow rate on mass-weighted average values of the parameters ... 56 4.2.3. Effect of Water Droplet Temperature ... 58 4.2.3.1. Effect of water droplet temperature on flow pattern on the horizontal centerline ... 59 4.2.3.2. Effect of water droplet temperature on flow pattern at the outlet cross section ... 61 4.2.3.3. Effect of water droplet temperature on mass-weighted average values of the parameters ... 64 4.2.4. Effect of Spray Cone Angle ... 66 4.2.5. Effect of Number of the Sprays ... 68
4.2.5.1. Effect of number of injections on flow pattern on the horizontal centerline ... 71 4.2.5.2. Effect of number of injections on flow pattern at the outlet cross section ... 73 4.2.5.3. Effect of number of injections on mass-weighted average values of the parameters ... 76 4.2.6. Effect of the Location of the Spray ... 79
ix
4.2.6.1. Effect of the location of the spray on flow pattern on the centerline 81 4.2.6.2. Effect of the location of the spray on flow pattern at the outlet cross
section ... 83
4.2.6.3. Effect of the location of the spray on mass-weighted average values of the parameters ... 85
5. THREE DIMENSIONAL SIMULATIONS ... 88
6. CONCLUSIONS ... 97
REFERENCES ... 99
x
LIST OF TABLES
Table 3-1. Inlet boundary conditions of the continuous phase. ... 23
Table 3-2. Thermo-physical properties of the water (dispersed phase). ... 25
Table 3-3. Thermo-physical properties of air. ... 25
Table 4-1. Spray initial conditions. ... 28
Table 4-2. Initial conditions of the injection. ... 36
Table 4-3. Effect of heating the air-vapor mixture on RH. ... 47
Table 4-4. Effect of heating the air-vapor mixture on RH. ... 55
Table 4-5. Effect of heating the air-vapor mixture on RH. ... 64
Table 4-6. Initial conditions of each spray. ... 68
xi
LIST OF FIGURES
Figure 1-1. Schematic for the drying cycle. ... 2
Figure 2-2. Droplet distributions in the cross-sections for different injection angles with Re = 25700. Zhang et al. [25]. ... 9
Figure 2-3. Comparisons between experimental and calculated results for differential liquid film temperature in injection regions [32]. ... 11
Figure 2-4. Distribution of drop bulk temperature with time [33]. ... 12
Figure 2-5. The drop growth rate [33]. ... 12
Figure 3-1. Schematic for the spray dryer. ... 15
Figure 3-2. "Reflect'' Boundary Condition for the Discrete Phase. ... 24
Figure 3-3. Grid on the channel. ... 26
Figure 3-4. Grid independence test. ... 26
Figure 3-5. Location of the mesh study cases. ... 26
Figure 4-1. Non-dimensional droplet temperature vs time. ... 27
Figure 4-2. Droplet non-dimensional temperature [10]. ... 28
Figure 4-3. Droplet non-dimensional temperature [7]. ... 29
Figure 4-4. Velocity magnitude distribution at different horizontal distances from nozzle. ... 30
Figure 4-5. Pressure distribution on the horizontal centerline. ... 31
Figure 4-6. Effect of gravity on droplet velocity distribution. ... 32
Figure 4-7. Humidity distribution at different horizontal distances from the nozzle. 32 Figure 4-8. Temperature distribution at different horizontal distances from the nozzle. ... 33
Figure 4-9. Relative humidity distribution at different distances from the nozzle. ... 34
Figure 4-10. Dehumidification and cooling process. ... 35
Figure 4-11. Effect of droplet diameter on gas-phase bulk temperature at the outlet. ... 37
Figure 4-12. Nu variation with droplet radius [58]. ... 38
Figure 4-13. Temperature contours for different droplet diameters, (a) dp = 10 µm, (b) dp = 15 µm, (c) dp = 30 µm, (d) dp = 40 µm, (e) dp = 60 µm, (f) dp = 80 µm. ... 38
xii
Figure 4-14. Humidity contours for different droplet diameters, (a) dp = 10 µm, (b) dp
= 15 µm, (c) dp = 30 µm, (d) dp = 40 µm, (e) dp = 60 µm, (f) dp = 80 µm. ... 39
Figure 4-15. Particle trajectories for dp = 10 µm and mass flow rate = 3 gr/s. ... 40
Figure 4-16. Particle trajectories for dp = 40 µm and mass flow rate = 3 gr/s. ... 41
Figure 4-17. Particle trajectories for dp = 80 µm and mass flow rate = 3 gr/s. ... 41
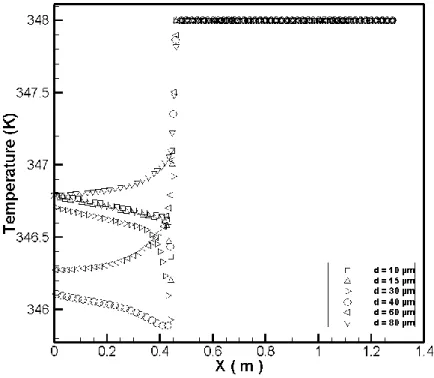
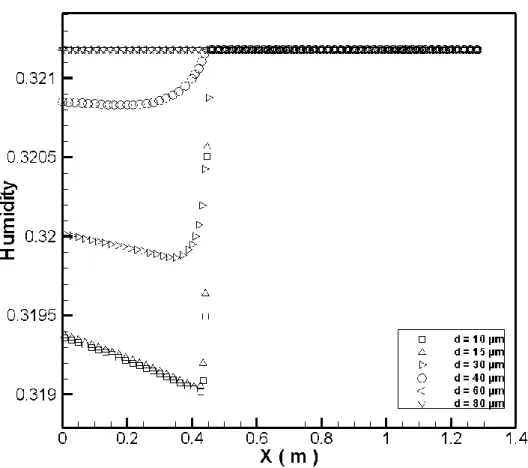
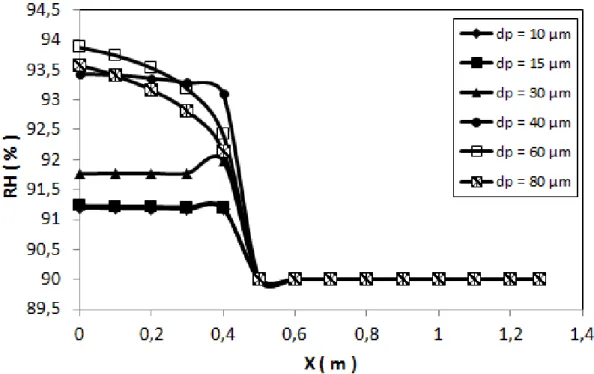
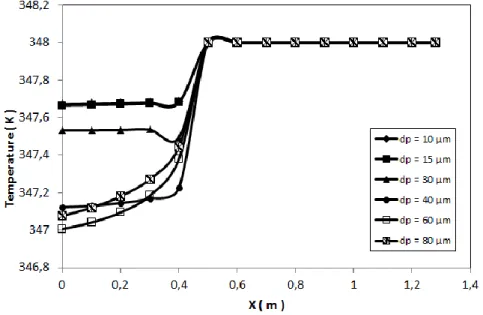
Figure 4-18. Effect of droplet diameter on relative humidity distribution on the horizontal centerline. ... 42
Figure 4-19. Effect of droplet diameter on temperature distribution on the horizontal centerline. ... 42
Figure 4-20. Effect of droplet diameter on humidity distribution on the horizontal centerline. ... 43
Figure 4-21. Effect of droplet diameter on relative humidity at the outlet. ... 44
Figure 4-22. Effect of droplet diameter on temperature at the outlet. ... 45
Figure 4-23. Effect of droplet diameter on humidity at the outlet. ... 45
Figure 4-24. Effect of droplet diameter on mass-weighted average relative humidity. ... 47
Figure 4-25. Effect of droplet diameter on mass-weighted average humidity. ... 48
Figure 4-26. Effect of droplet diameter on mass-weighted average humidity. ... 48
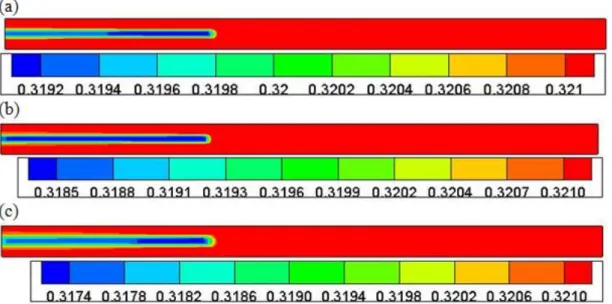
Figure 4-27. Temperature contours for different mass flow rates , (a) Mass flow rate = 3 gr/s, (b) Mass flow rate = 4gr/s, (c) Mass flow rate = 6 gr/s. ... 49
Figure 4-28. Humidity contours for different mass flow rates, (a) Mass flow rate = 3 gr/s, (b) Mass flow rate = 4 gr/s, (c) Mass flow rate = 6 gr/s. ... 50
Figure 4-29. Effect of spray mass flow rate on relative humidity distribution on the horizontal centerline. ... 51
Figure 4-30. Effect of spray mass flow rate on temperature distribution on the horizontal centerline. ... 52
Figure 4-31. Effect of spray mass flow rate on humidity distribution on the horizontal centerline. ... 52
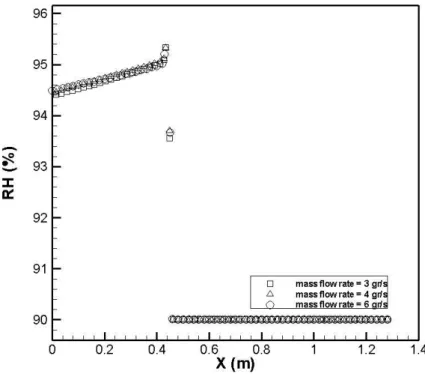
Figure 4-32. Effect of mass flow rate on relative humidity at the outlet. ... 53
Figure 4-33. Effect of mass flow rate on temperature distribution at the outlet. ... 54
Figure 4-34. Effect of mass flow rate on humidity distribution at the outlet. ... 54
Figure 4-35.Effect of mass flow rate on mass-weighted average relative humidity. . 56
xiii
Figure 4-37. Effect of mass flow rate on mass-weighted average humidity. ... 57 Figure 4-38. Temperature contours for different water droplet temperature, ... 58 Figure 4-39. Humidity contours for different water droplet temperature, (a) Tw = 288 K, (b) Tw = 313 K, (c) Tw = 323 K, (d) Tw = 330 K... 59 Figure 4-40. Effect of droplet temperature on relative humidity distribution on the horizontal centerline. ... 60 Figure 4-41. Effect of droplet temperature on temperature distribution on the
horizontal centerline. ... 60 Figure 4-42. Effect of droplet temperature on humidity distribution on the horizontal centerline. ... 61 Figure 4-43. Effect of water temperature on relative humidity distribution at the outlet. ... 61 Figure 4-44. Effect of water temperature on temperature distribution at the outlet. . 62 Figure 4-45. Effect of water temperature on humidity distribution at the outlet. ... 63 Figure 4-46. Effect of water droplet temperature on mass-weighted average relative humidity. ... 64 Figure 4-47. Effect of water droplet temperature on mass-weighted average
temperature. ... 65 Figure 4-48. Effect of water droplet temperature on mass-weighted average
humidity. ... 65 Figure 4-49. Effect of spray cone angle on relative humidity distribution on the centerline after the nozzle. ... 67 Figure 4-50. Effect of spray cone angle on temperature distribution on the centerline after the nozzle. ... 67 Figure 4-51. Effect of spray cone angle on humidity distribution on the centerline after the nozzle. ... 68 Figure 4-52. Temperature contours, (a) one injection, (b) two injections, (c) three injections, (d) four injections. ... 69 Figure 4-53. Humidity contours, (a) one injection, (b) two injections, (c) three
injections, (d) four injections. ... 70 Figure 4-54. Effect of number of injections on relative humidity distribution on the horizontal centerline. ... 71 Figure 4-55. Effect of number of injections on temperature distribution on the
xiv
Figure 4-56. Effect of number of injections on humidity distribution on the horizontal
centerline. ... 72
Figure 4-57. Effect of number of injections on relative humidity distribution at the outlet cross section. ... 73
Figure 4-58. Effect of number of injections on temperature distribution at the outlet cross section. ... 74
Figure 4-59. Effect number of injections on humidity distribution at the outlet cross section. ... 74
Figure 4-60. Effect of number of injections on mass-weighted average relative humidity. ... 76
Figure 4-61. Effect of number of injections on mass-weighted average temperature. ... 76
Figure 4-62. Effect of number of injections on mass-weighted average humidity. ... 77
Figure 4-63. Particle trajectories colored by humidity... 78
Figure 4-64. Particle trajectories colored by temperature. ... 78
Figure 4-65.Temperature contours for sprays at different locations, (a) x = 44.5 cm, (b) x = 80 cm, (c) x = 120 cm. ... 79
Figure 4-66. Humidity contours for sprays at different locations, (a) x = 44.5 cm, (b) x = 80 cm, (c) x = 120 cm. ... 80
Figure 4-67. Effect of the spray location on relative humidity distribution on the horizontal centerline. ... 81
Figure 4-68. Effect of the spray location on temperature distribution on the horizontal centerline. ... 81
Figure 4-69. Effect of the spray location on humidity distribution on the horizontal centerline. ... 82
Figure 4-70. Effect of spray location on the relative humidity at the outlet. ... 83
Figure 4-71. Effect of spray location on the temperature at the outlet. ... 83
Figure 4-72. Effect of spray location on the humidity at the outlet. ... 84
Figure 4-73. Effect of the spray location on mass-weighted average relative humidity. ... 85
Figure 4-74. Effect of the spray location on bulk temperature. ... 86
Figure 4-75. Effect of the spray location on mass-weighted average humidity... 86
xv
Figure 5-2. Particle trajectories for dp = 80 µm. ... 88
Figure 5-3. Particle trajectories for dp = 40 µm. ... 89
Figure 5-4. Particle trajectories for dp = 10 µm. ... 89
Figure 5-5. Particle traces colored by gas-phase temperature (dp = 80 µm). ... 89
Figure 5-6. Particle traces colored by humdity (dp = 80 µm). ... 90
Figure 5-7. Particle traces colored by gas-phase temperature (dp = 40 µm). ... 90
Figure 5-8. Particle traces colored by humidity (dp = 40 µm). ... 91
Figure 5-9. Particle traces colored by gas-phase temperature (dp = 10 µm). ... 91
Figure 5-10. Particle traces colored by humidity (dp = 10 µm). ... 92
Figure 5-11. Particle traces colored by temperature (Tw = 288 K). ... 92
Figure 5-12. Particle traces colored by humidity (Tw = 288 K). ... 93
Figure 5-13. Particle traces colored by temperature (Tw = 323 K). ... 93
Figure 5-14. Particle traces colored by humidity (Tw = 323 K). ... 94
Figure 5-15. Particle traces colored by temperature (mass flow rate = 3 gr/s). ... 94
Figure 5-16. Particle traces colored by humidity (mass flow rate = 3 gr/s). ... 95
Figure 5-17. Particle traces colored by temperature (mass flow rate = 6 gr/s). ... 95
xvi
ABBREVIATIONS Abbreviations Description
CFD Computational Fluid Dynamics
DCC Direct Contact Condensation
DPM Discrete Phase Model
RH Relative Humidity
xvii
LIST OF SYMBOLS Symbol Description
A surface area
Bi Biot number
Bm Spalding mass number CD Drag coefficient
Ce Atomization rate constant
Cp Heat capacity of the droplet dp Diameter of particle
Di,m Diffusion coefficient for species i in the mixture DT,i Thermal diffusion coefficient
E Energy
en Restitution coefficient
F Force
h Convective heat transfer coefficient
hfg Latent heat of droplet Ji Diffusion flux of species i k Thermal conductivity
kc Mass transfer coefficient mp droplet mass
xviii
P Pressure
Pr Prandtl number
Ri Net rate of production of species i
Re Reynolds number
Si Source term for component i Sct Turbulent Schmidt number
t Time
T Temperature
Tw0 Droplet initial temperature u Velocity x-component
v Velocity y-comonent
x Cartesian horizontal axis direction
y Cartesian vertical axis direction
Yi Mass fraction of the species i Yi,s Vapor mass fraction at the surface
ρ Density µ Dynamic viscousity µt Turbulent viscosity τ Stress tensor σ Stefan-Boltzmann constant ε Emissivity
xix ӨR Radiation temperature Subscripts d Droplet i Species p Particle s Saturated steam
x Cartesian horizontal axis direction
y Cartesian vertical axis direction
∞ Continuous phase
1 1. INTRODUCTION AND MOTIVATION
Air conditioning is the process in which the properties of the air are changed to desirable conditions [1]. One of these processes is the dehumidification process of the humid air. During dehumidification, humidity of the air is reduced due to reasons such as health, comfort and industrial need [2]. Dehumidification can be achieved by means of sub-cooled water sprays as long as the temperature of the spray is lower than the dew point of the humid air passing through the unit. This process is known as “spray dehumidification”.
The main physical phenomenon in this process is direct contact condensation (DCC) of steam on water surface. Direct contact heat transfer occurs whenever two substances touch each other physically at different temperatures. Direct and indirect contact processes differ in many perspectives. In indirect transfer, the process is limited by the surface area and the possible heat transfer rate through this surface. In direct contact transfer, the process is controlled by the interplay between the latent heat of condensation and the amount of sensible heat the liquid can absorb [3]. In this process sensible heat and latent heat transfer play a crucial role. Since the air is in contact with water, the sensible heat will be absorbed by droplet. However latent heat of condensation will be removed from the steam to the surrounding.
Nowadays DCC has a great role in many industrial projects like air conditioning, nuclear reactor cooling system, mixing-type heat exchangers, steam jet spray and desalination. For this reason many researchers have investigated the physics of the phenomenon. However due to complexity of the heat and mas transfer process and limitations in numerical methods and measurement devices, number of the available publications are not adequate in order to fully understand physics of the problem.
Recently air or water cooled condensers are used to dehumidify the drum air in washing-drying machines. The most common disadvantages in these machines are the long drying time, high energy and water consumption. Within this project, a dehumidification system is developed for hybrid washer / dryer machines. The following figure describes the drying cycle. The data from experiments show that hot and moist air
2
with relative humidity of 90 % and temperature of 348 K exits from the drum. The drum air enters the channel with the velocity of 10 m/s. It is observed that by using a spray after the drum, the humid drum air is dehumidified. Accordingly, the humidity and the temperature decrease. It should be metioned that by using spray in the system drying time decreaases.
Figure 1-1. Schematic for the drying cycle.
The objective of this thesis study is to study the effect of various parameters on direct contact condensation of steam on the surface of sprayed chilled water droplets in a horizontal channel. The thesis is organized as follows:
Chapter two presents a critical review of analytical, experimental, and numerical investigations in the field of direct contact condensation of steam on liquid droplets.
Chapter three describes the details of the problem and equations which are governing the problem. Furthermore this chapter discusses the computational methods and boundary conditions which are utilized to simulate the problem. All the simulations are performed by utilizing ANSYS Fluent 14.5.
Chapter four explains the results of the numerical simulations. This chapter completely describes the effects of various parameters on pattern of the flow field. Various parameters such as spray mass flow rate, droplet diameter, droplet
3
temperature and cone angle of the spray are altered in order to investigate their effect on flow pattern. Finally, Chapter five presents the conclusions.
The major aim of this thesis is to develop a model and investigate the effect of various parameters on dehumidification process.
4 2. LITERATURE REVIEW
Sprays have many applications such as spray drying, turbine combustor cooling, air conditioning, nuclear reactor cooling and mixing-type heat exchangers. Depending on the droplet characteristics such as size, temperature, cone angle, spray mass flow rate, and velocity of sprays have different utilizations. In the field of air conditioning, sprays are used in cooling towers and evaporative coolers and air washers. Direct contact condensation plays a crucial role in the study of the humidification and dehumidification of the moist air in contact with the sub-cooled water spray. There has been great number of publications in the literature concerning film condensation and also drop-wise condensation; however the investigations on direct contact condensation are limited. Investigations on direct contact condensation are reviewed at three major branches of experimental, numerical, and analytical studies.
2.1. Experimental Investigations
Hasson et al. experimentally studied the heat transfer in steam condensation on laminar water sheets generated by the fan spray nozzle. They showed that heat transfer coefficient could be reduced by as much as 50 % for a concentration of one percent air in steam [4].
Ford et al. experimentally studied the droplet size increase in direct contact condensation of steam on liquid droplets. They estimated a correlation for this phenomenon. They utilized a high-speed photography to calculate the particle size enhancement through the condensation process [5].
Simpson et al. experimentally studied the condensation process and hydrodynamic pressure oscillations when steam was discharged into a sub-cooled water pool. They explained that behavior of the subsonic jet is different from sonic jet. They noticed that pool sub-cooling had the largest influence on dynamic behavior [6].
5
Jeje et al. investigated the growth of vapor-liquid interfaces which are influenced by inertial and thermal effects. In their experiments high speed photography and frequency measurements systems were used. Convective heat transfer coefficients at vapor-liquid interfaces depended on bubbling regime and the stage of interface growth and its value increased up to 2.4 MWm-2K-1 [7].
Garimella et al. measured the effect of non-condensable gas mass fraction on heat transfer coefficient in small enclosures. They found that when the initial non-condensable gas amount is small the heat transfer coefficient depends on it. But when the non-condensable gas amount is great, the heat transfer coefficient is independent of it [8].
Celata et al. investigated the effect of droplet velocity on the heat transfer rate of saturated steam condensation on chilled water sprays. Furthermore they performed the average droplet temperature on the centerline of the spray injection [9].
Aya et al. experimentally studied the heat transfer coefficient evaluated assuming simple interface shapes for complicated surfaces. They predicted the heat transfer coefficient at chugging, condensation oscillation, jet region, and surface of satisfied flow [10].
Liang through experiments studied the regimes associated with the condensation of steam on water. He developed a transient conduction-diffusion model to analyze the effect of non-condensable gas on chugging transition steam condensation. Furthermore he found that the chugging boundary was not affected by water velocity. For this reason chugging process is controlled by localized eddies around the interface [11].
Mayinger et al. experimentally measured the growth of liquid droplet diameter due to condensation of saturated vapor on sub-cooled liquid. In order to measure the drop diameter they used pulsed laser holography. They found out that the geometry of the spray and the vapor pressure has a specific relation. For this reason, designers of nozzles which work at high vapor pressure conditions have to consider the relation of
6
the high pressure and the condensation and how it can have influence on the flow [12].
Akira et al. studied the direct contact condensation of the steam on sub-cooled water in a horizontal channel. In order to model the lowest limit of the heat transfer, the heat conduction model was used. They found that modified k-ε model shows more improved prediction compared with the wall k-ε model and agrees better with experimental results with smooth interfaces [13].
Lock has categorized all the different modes of condensation and evaporation which can happen in direct contact heat transfer. One of these approaches is the evaporation and condensation interactions with droplets and jets in the presence of a non-condensable gas. When an amount of non-non-condensable gas is present with the vapor the condensation rate decreases [14].
Kuhn et al. did many experiments in a vertical tube to figure out the effect of non-condensable gas. Pure steam, air-steam, and air-steam and Helium mixtures investigated. The results depicted that presence of non-condensable gases reduce the heat transfer performance [15].
Karl et al. utilized the linear Raman spectroscopy method to get temperature distribution in the water phase or the concentration pattern in the vapor phase to the heat transfer coefficient in condensation process of mixtures with and without condensable gas [16].
Anderson et al. investigated the steam condensation on the surface of AP600 containment. Heat transfer reduction due to presence of non-condensable gas has been investigated for different mixtures of air and helium. Effect of various parameters such as bulk temperature, cold surface temperature, non-condensable mass fraction on condensation heat transfer has been analyzed. For lowest mass fraction of the non-condensable and the highest surface temperature highest heat transfer coefficient was found [17].
7
Ju et al. measured the heat transfer coefficients around steam bubbles using the holographic interferometer and high speed camera. They investigated the condensation regime map associated with the downward injection of steam into water. They showed that the boundary of chugging and subsonic jetting with the larger diameter pipe is shifted to the larger steam mass flux [18].
Lee et al. experimentally investigated the effect of non-condensable gas on direct contact condensation of moist air. They led to the conclusion that higher mass fractions of non-condensable gas have inverse relation with the average heat transfer coefficient. Increasing the mass fraction of the non-condensable gas, results in reduction of average heat transfer coefficient. In addition, they noted the abatement of the average heat transfer coefficient by increasing the Jacob number [19].
Kim et al. performed experiments on direct contact condensation of steam discharging into cold water tank. They used five nozzles with different sizes and investigated various steam mass flux and pool temperature conditions. They noticed that the average heat transfer coefficient is in the range of 1.24-2.05 MWm-2 °C-1 and increases as the temperature of the pool decreases. The heat transfer coefficient is reduced as the nozzle size reduces [20].
Pikkula et al. analyzed the effect of droplet diameter on heat transfer in spray cooling by measuring the maximum heat removal for different average droplet diameters. They noticed that by increasing the particle diameter heat transfer increases, but after optimum radius, increasing the diameter reduces heat transfer [21].
8
Figure 2-1. Maximal heat removal (Qmax) achieved at spraying distance DQmax immediately upon termination of a 200-ms spurt as a function of average diameter [21].
Cheng et al. studied the effect of spray mass flow rate on heat transfer. They noticed that by increasing the spray mass flow rate heat transfer enhances [22].
Chen et al. experimentally studied the effect of droplet mean diameter on heat transfer coefficient. They altered particle mean diameter from 62.2 to 191.4 µm while other parameters were fixed in a constant value. They did not find a clear heat transfer pattern for different droplet diameters. This can be due to the range of droplet diameters in their research. The droplets that they studied were not small enough to find a pattern for heat transfer by changing droplet diameters [23].
Martinez-Galvan et al. analyzed the effect of spray cone angle on heat transfer by doing experiments with different nozzles. By using a methodology based on utilization of high speed camera, it is found that the thermal performance decreases as spray cone angle decreases [24].
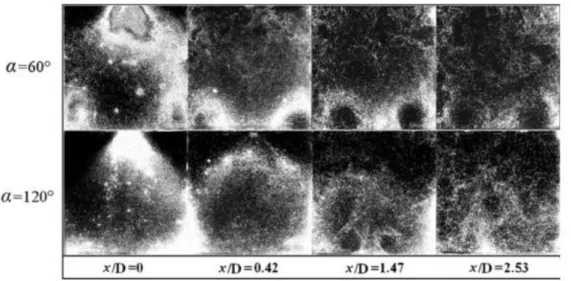
Zhang et al. by using the PIV visualization system studied the spray in cross flow. They divided the flow field into three main parts of upper counter-rotating vortex pair zone, mainstream zone, and bottom counter-rotating vortex pair zone. Figure 2-2 illustrates droplet pattern and distribution at different cross sections. Due to coherent
9
structure at 60, the upper counter-rotating vortex pair is prevented strongly. In addition in this case mixing rate is higher and it is obvious in the results from experiments [25].
Figure 2-1. Droplet distributions in the cross-sections for different injection angles with Re = 25700. Zhang et al. [25].
2.2. Analytical Investigations
Minkowyez et al. studied the forced convection condensation of binary mixture of gases. In order to solve the coupled equations for gas phase and continuous phase similarity method is used. They noticed that the presence of non-condensable gas reduced the heat transfer [26].
Sparrow et al. analyzed the forced convection condensation on a horizontal surface of a binary mixture and non-condensable gas. Equations are solved using similarity method. They found that condensation reduction due to the presence of the non-condensable gas is lower when forced convection is the case. For free convection case presence of non-condensable gas plays a crucial role and decreases the heat transfer rate [27].
Taitel et al. investigated the DCC (direct contact condensation) on the falling liquid water. Based on integral solutions of the boundary layer equations and similarity
10
method condensation of vapor and air is studied. They explained that by increasing the mass fraction of the non-condensable gas the water interface temperature reduces [28].
Sage et al. solved the condensation problem of multicomponent mixture of alcohol vapors by using similarity solution. Their solution did not consider the presence of the non-condensable gas and the diffusivity coefficients were taken as constant values [29].
Frediani et al. mathematically modelled a large scale spray cooling system. For a single spray energy and continuity equations are solved. The equations are solved using a finite-difference solution along a drop trajectory for both water and air parameters. The model is applied towards solution of large systems involving multiple passes of sprays operating in conjunction with power stations. They found that there is agreement between data and the predictions of wind velocity and air-water temperatures [30].
Ghosh et al. mathematically studied the motion of the droplet in a droplet driven vertical jet. They simulated one and two-dimensional models to find the average air velocity in the spray. In order to validate the theoretical result they did some experiments which also gave a good perspective to some important mechanisms in the problem. They found that normal turbulent jets are characterized by large turbulent structures; on the other hand, droplet-driven jets are having small scales of turbulence [31].
2.3. Numerical Investigations
Akimoto et al. studied the direct contact condensation of steam on water droplets during a loss-of-coolant accident. They found that the droplet diameter strongly effect the condensation rate. Moreover they noticed that finer droplets lead to higher condensation rate. Figure 2-3 explains the liquid film temperature distribution with respect to Ce (atomization rate constant). Liquid film temperature increases with atomization rate and it remains below the saturation temperature [32].
11
Figure 2-3 depicts the liquid film temperature for different distances from the nozzle. As the liquid gets far from the nozzle its temperature increases and its value approximately enhances to saturation temperature. It should be emphasized that the liquid temperature is not able reach the saturation temperature.
Figure 2-2. Comparisons between experimental and calculated results for differential liquid film temperature in injection regions [32].
Huang et al. numerically studied the heat and mass transfer on droplet in direct contact with the environment. The environment consists of saturated vapor and non-condensable gas. They provided new correlations for averaged condensation rate and heat flux associated with condensation on a moving droplet. The correlations are extracted from transient numerical calculations. Figure 2-4 illustrates the time variation of the dimensionless bulk temperature. The droplet bulk temperature increases with time [33].
12
Figure 2-3. Distribution of drop bulk temperature with time [33].
In addition, they found that for a given droplet size, change in cone angle of the spray does not have any significant effect on the enhancement of the dimensionless bulk temperature.
Droplet non-dimensional radius is also predicted and plotted (Figure 2-5). Due to condensation of vapor on the surface of the doplet, droplet grows. This increase in size is found to be linear with temperature difference.
13
Turkoglu et al. developed a three dimensional model to study the effect of droplet diameter and mass flow rate on the efficiency of the direct contact metal recovery condenser. They found that condensation rate enhances by increasing the liquid mass flow rate. They noticed that increasing the droplet diameter reduces the condensation efficiency. Their droplet diameters ranges are between 2 and 4 mm [34].
Lin et al. numerically studied the characteristics of spray cooling in a closed loop. A miniature nozzle array with eight nozzles is sprayed to the chamber in which nucleate boiling heat transfer, convection heat transfer, and evaporation phenomenon was observed. At heat fluxes lower than the critical heat flux presence of the non-condensable gas has reverse effect on heat transfer performance [35].
Shah et al. modelled the direct contact condensation of supersonic steam jet in water pool. They simulated the two phase flow problem by using Euler-Euler model in FLUENT 6.3 software. They found that increasing the water temperature leads to reduction of condensation rate. As the temperature difference of the water and the steam increases, the condensation rate enhances. In addition they concluded that the condensation heat transfer coefficients is in the range of 0.75- 0.917 MW.(m2K)-1 for water temperatures in the interval of 293 K and 343 K [36].
Shaver et al. computationally studied the fundamental physical phenomena governing steam-jet/water interaction. They studied two different models for investigating fluid flow and heat transfer in a high speed steam jet. One is a simplified theoretical model in two dimensions which is modeled in Lagrangian and Eulerian approach. The other one is a multidimensional computational multiphase fluid dynamics (CMFD) model. Their two dimensional model is able to explain the hydrodynamic behavior of the droplets where the condensation is neglected. Their model is able to predict the droplet trajectories and the condensation rate [37].
Alnaimat et al. developed a transient one dimensional model to analyze the heat and mass transfer through direct contact condensers and evaporators. In the heat and mass transfer model the inlet air, water temperature and humidity ratio calculated by variation of time. Experiments were conducted and used to validate the models [38].
14
Cui et al. numerically developed a method for heat and mass transfer incorporated with the volume of fluid surface tracking method in a two dimensional channel, including DCC and a distillation effect. They investigated the interfacial temperature and composition. While changing different parameters of boundary conditions interfacial latent heat and mass transfer are studied [39].
Lan et al. developed a mathematical model of droplet to investigate the vapor molecules condensing on the chilled surface in presence of non-condensable gas. By using homogeneous nucleation model their model was able to describe the effect of non-condensable gas presence and also the size of the clusters. They concluded that a small amount of non-condensable gas reduces the heat transfer rate [40].
15 3. PROBLEM DESCRIPTION
A two dimensional channel in which water is injected in a counter flow direction into air-water vapor mixture via a cone spray nozzle with a degree of 60 is considered. The height and the length of the channel are 6.5 cm and 128 cm, respectively. The height corresponds to the dimension of a washing-drying machine in Arçelik’s product range. The hot and moist air is entering from the right side and the sub-cooled water is sprayed into the humid air through a nozzle located at (44.5 cm, 0 cm). The channel and water-spray nozzle configuration used in this study is shown in Figure 3-1. This geometry has been adopted for all simulations.
Figure 3-1. Schematic for the spray dryer.
3.1. Mathematical Model
This chapter discusses the equations which govern the heat and mass transfer between droplets and the air-vapor mixture. In the Lagrangian-Eulerian method the continuous phase (air-vapor mixture) is modelled using mass, momentum, energy, and species transport equations. The secondary phase (droplets) is solved by tracking a large number of particles into the solved continuous phase. These particles will have mass, momentum and energy exchange with the flow field. This method is available when the dispersed phase volume fraction is less than 10% [41]. In this case we can neglect the particle-particle interaction of droplets. During the flow field calculations at specific intervals, the particle trajectories of droplets are calculated. In order to simulate the present study the following assumptions are accepted:
16
Mixture (air and vapor) is considered as incompressible fluid. The gravitational force is neglected.
Radiation heat transfer is neglected. Droplet rotation is neglected.
Temperature inside the water droplet is considered as uniform. This assumption is accepted just for Bi < 0.1 [46].
Pressure gradient and virtual mass forces are neglected. Droplet-Droplet interaction is neglected.
The governing equations for the continuous are as following:
3.1.1. Mass Conservation Equation
m
u
v
S
x
y
(3.1)Sm is the mass source added to the continuous phase due to mass transfer between dispersed phase and gas-phase.
3.1.2. Momentum Transfer Equation
( ) ( ) xx xy x uu uv P F x y x x y
(3.2) ( ) ( ) yx yy y uv vv P F x y y x y
(3.3)Here F represents the momentum source due to the interaction between the dispersed phase and the continuous phase.
3.1.3. Energy Equation
(uE) (vE) k ( T) k ( T) Sh
x y x x y y
(3.4)
17 3.1.4. Turbulence Model
Since the Reynolds number is 68200, the flow in the channel is turbulent. For this reason k-ε turbulence model is used to simulate the turbulence. However it should be
mentioned that the renormalization group (RNG) method of the k-ε model has been
randomly consulted for different cases and results were in good agreement with this model.
3.1.5. Equation of Motion for Droplets
The trajectories are solved by integrating the equation of the motion of the droplets.
(
)
p D pdu
F u u
F
dt
(3.5)The first term in right hand side of the equation (3.5) represents the drag force per unit droplet mass. The second term is the additional force term which is neglected in this investigation. The pressure force, unsteady forces, virtual mass and Basset terms are in the order of the air/droplet density which is approximately 10-3. For this reason they could be neglected [56].
2 18 Re 24 D D p p C F d
(3.6) Where,u = continuous phase velocity
p
u = particle velocity
= molecular viscosity of the continuous phase fluid
= density of the continuous phase fluidp
= density of the particlep
d
= diameter of the particle18
Re
uV d/
(3.7)In order to compute the drag coefficient the following equation is used:
3 2 1 2 Re Re D a a C a (3.8)
Here, a1 , a2 , a3are constants given by Morsi and Alexander [42].
3.1.6. Species Transport Equations
( Yi) .( vYi) .Ji Ri Si t (3.9) , ,
(
t)
i i m i T i tT
J
D
Y
D
Sc
T
(3.10) Where, , i mD = Diffusion coefficient for species i in the mixture ,
T i
D = Thermal diffusion coefficient
t
Sc = Turbulent Schmidt number
i
J = Diffusion flux of species i
i
R = Net rate of production of species i
i
S = Source term for component i
i
Y = Mass fraction of the species i
The continuous phase mixture consists of air and vapor. 3.1.7. Heat and Mass Transfer Mechanism
DPM (Discrete Phase Model) approach of ANSYS Fluent 14.5 can model the particle motion and its heat and mass transfer effect on the mixture. In order to formulate the heat transfer mechanism, the heat balance equation of a droplet is considered.
19 4 4 ( ) ( ) p p p p p p p p R p fg dT dm m c hA T T A T h dt dt (3.11) Where, p
m = mass of the droplet (kg)
p
c = heat capacity of the droplet (J/kg-K)
p
A = surface area of the droplet (m2)
T= local temperature of the continuous phase (K)
h = convective heat transfer coefficient (W/m2-K)
R = radiation temperature, ( )1/ 4 4 G
fgh = Latent heat of water
Second term in the right hand side represents the radiation heat transfer which is neglected in this calculation.
By using Ranz and Marshall [43] correlation for heat transfer coefficient, Nusselt Number is expressed as following:
1/2 1/3 2.0 0.6 Re Pr p d hd Nu k (3.12) Where p d = particle diameter (m)
k = thermal conductivity of the mixture (W/m-K) Red = Reynolds number of the droplet
20 3.1.7.1. Evaporation Model
In order to simulate evaporation, convection-diffusion model is utilized. When the effect of the evaporating water droplet on the gas phase becomes stronger convection term should be considered.
ANSYS Fluent uses the following equations to calculate the mass transfer which are adopted from Miller [44] and Sazhin [45]:
ln(1 ) p c p m dm k A B dt (3.13) Where, p m = droplet mass (kg) c
k = mass transfer coefficient (m/s) p
A = droplet surface area (m2)
= density of the continuous phase (kg/m
3 )
Bm in equation 3.13 is Spalding mass number.
, , , 1 i s i m i s Y Y B Y (3.14)
In this equation Y is the vapor mass fraction at the surface and i s, Yi, is the vapor mass fraction in the air-vapor mixture.
3.1.7.2. Condensation Model
In order to simulate the steam condensation on water droplets a user-defined function is implemented to ANSYS Fluent 14.5 software [64]. When the relative humidity of the mixture exceeds 100 %, steam starts to condense on water surface. For this reason, mass and diameter of the droplets increase. By using this code a mass source is added to the droplet due to condensation of vapor on it. In addition an energy source is adjusted depending on the latent heat of condensation and the amount of
21
mass source. The following equations (3.15 and 3.17) depict the mass and energy sources which are added to the continuity and energy equations. It should be mentioned that the momentum source is added to the continuous phase by Discrete Phase Model itself.
( ) ( 1) 100 p RH m condensation factor A (3.15) 0 p p p m m m (3.16) h p fg S m h (3.17)
Equation 3.15 calculates the mass source to the continuous phase which is recommended by ANSYS Fluent UDF Manual [64]. Here, A is the droplet area and RH is the relative humidity of the air-vapor mixture. It is obvious that for the case in which condensation occurs the mass source will be positive. This means that steam condensation on water surface increases mass of the water droplet. The condensation factor in equation 3.15 is recommended to be 1e-4 [64]. Droplet mass is calculated by equation 3.16. In this equation, m is the initial droplet mass and p0 m is the rate p
of condensation. It should be mentioned that latent heat is calculated depending on the temperature.
When condensation of the steam on water droplet takes place, the droplet diameter is calculated by using the following equation:
1 3 6 p p p m d (3.18)
During condensation the droplet mass increases, accordingly the droplet diameter enhance.
22 3.1.8. Integration of Particle Motion Equation
By using stepwise integration over discrete time steps, particle trajectories and heat and mass transfer to/from droplet is solved. Integrating the equation 3.5 yields to find the particle velocity along each point in the trajectory [41]. In addition, the trajectories can be predicted by equation 3.19. Equation 3.5 could be written as equation 3.20, and discretizing it in trapezoidal method yields to equation 3.21.
p dx u dt (3.19) 1 ( ) p p p du u u dt (3.20) 1 1 1 (1 ) ( . ) 2 2 1 1 2 n n n n p p p p n p p t t u u tu u u t (3.21)
It should be mentioned that equation 3.19 and 3.5 are coupled ordinary differential equations. Locations of the droplets are predicted by discretizing equation 3.19 in implicit and the trapezoidal scheme.
1 1 1 ( ) 2 n n n n p p p p x x t u u (3.22)
3.1.9. Turbulent Dispersion of Particles
In order to implement the effect of the turbulence of the mainstream flow, instantaneous fluid velocity is utilized in trajectory equation. Instantaneous value of the fluid velocity is:
uuu (3.23)
The Discrete Random Walk model is used to model the instantaneous gas velocity. In this model fluctuating part of the velocity is assumed to be constant linear function
23
of time. This model which is also famous as Eddy-Lifetime model simulates the interaction of continuous phase turbulent eddies with particles [41].
3.2. Boundary Conditions
In this section of the thesis boundary conditions are discussed. Boundary conditions are generally divided into continuous phase and dispersed phase conditions.
3.2.1. Continuous Phase Boundary Conditions
The continuous phase consists of air-vapor mixture which enters from the right end and it interacts with the injected water droplets. Boundary conditions of the mainstream flow are strongly affecting the calculations. These conditions include the mixture temperature, relative humidity, and velocity. The mixture temperature, velocity and relative humidity are presented in Table 3-1. These values correspond to a Reynolds number of 68200.
Table 3-1. Inlet boundary conditions of the continuous phase. RH(%) Temperature ( K ) Velocity ( m/s ) Mass Flow
Rate (kg/s)
90 348 10 0.57
3.2.2. Spray Initial Conditions
Spray initial conditions such as location of the spray, droplet diameter, droplet temperature, mass flow rate of the spray, and velocity of the injected droplets are significantly affecting the heat and mass transfer between two phases. In order to study the effect of these parameters on the dehumidification process, each time all parameters are kept constant and just one parameter is varied to check its effect on temperature, humidity, and relative humidity pattern of the mainstream flow.
24 3.2.3. Wall Boundary Conditions
No-slip boundary condition is considered for the wall. The “reflect” boundary condition is used for the discrete phase model.
e
n is the restitution coefficient. In this study the restitution coefficient is taken as default which is the constant value of 1 for normal and tangent reflection factors [41]. This means all the normal and tangential momentum retains when the droplet hits the wall. Here 1 represents the condition before the collision of the droplet to the wall and 2 represents the condition after the collision of the droplet to the wall.2, 1, n n n v e v (3.24)
Figure 3-2. "Reflect'' Boundary Condition for the Discrete Phase.
3.2.4. Outlet Boundary Conditions
Pressure-Outlet boundary condition is implemented for the channel outlet.
3.3. Numerical Model
This chapter discusses the numerical model which is used for this simulation.
3.3.1. Air-Vapor Mixture Model
In order to model the air-vapor mixture Species Transport model is used. ANSYS FLUENT 14.5 provides the species transport model which simulates the transport of the species by solving the diffusion and convection equations. By solving
25
convection-diffusion equations for each species FLUENT predicts the mass fraction of the species.
3.3.2. Solution Method
The pressure–velocity coupling is solved by using coupled scheme. In addition Pseudo transient method is utilized.
Momentum, Energy and species transport equations are discretized by usng second order upwind approach to get more accurate results.
In rder to be able to converge the problem, Discrete Phase Sources relaxation factors should be decreased to values like 0.1.
3.4. Material Properties
This section presents the properties of the continuous and dispersed phase. The properties of the water are listed in Table 3-2.
Table 3-2. Thermo-physical properties of the water (dispersed phase).
Property Value Unit
Density 998.2 Kg/m3
Specific Heat 4182 J/Kg-K
Table 3-3. Thermo-physical properties of air.
Property Value Unit
Density 1.22 Kg/m3
Specific Heat 1006.4 J/Kg-K
Thermal Conductivity 0.026 W/m-K
Table 3-3 describes the thermo-physical properties of the air. Water vapor pressure strongly depends on the temperature, for this reason, a piecewise linear function is used to predict it.
26 3.5. Grid Independency Analysis
In this investigation a computational mesh independency study has been carried out with square grids of 20 mm, 10 mm, 8 mm, and 7 mm. The grid evaluation aims to make sure that the physical result from numerical simulation is independent of the number of grid cells. It is seen that the results from the three sets of grids with sizes of 10 mm, 8mm, and 7mm coincide. Accordingly the structural grid size of 7 mm is chosen for the simulations. The grid used for this study is shown in figure 3-3. Figure 3-4 depicts the independency of the solution from the domain mesh. Velocity magnitudes at different locations of the centerline are checked and analyzed. Figure 3-5 illustrates the locations of the points in the chamber. Point number 1 represents the location of the x = 44 cm and y = 0 cm. Point number 2 demonstrates the location of x = 0 and y = 0 cm.
Figure 3-3. Grid in the channel.
Figure 3-4. Grid independence test.
27 4. TWO DIMENSIONAL ANALYSIS
This section presents the predictions of the present numerical investigations. First a validation study is performed. A parametric study on the effect of different parameters on pattern of humidity, relative humidity, temperature distribution and other flow variables is studied, next.
4.1. A Base Case Study
Validation of the results with available experimental or analytical data is necessary to ensure that results are reliable to optimize the effect of different parameters on spray dehumidification process.
Figure 4-1. Non-dimensional droplet temperature vs time.
Figure 4-1 illustrates the variation of non-dimensional droplet temperature with time. Various droplet diameters are compared in figure 4-1. In each case spray initial conditions are kept fixed and they are summarized in table 4-1.
28
Table 4-1. Spray initial conditions.
Spray Temperature ( K )
Spray Cone Angle Spray Mass Flow Rate ( gr/s )
288 60 3
The droplet temperature is increasing with time. It is found that by reducing the droplet diameter, droplet temperature quickly enhances to values close to the saturation temperature. The temperature of the larger droplets grows slower since they are bigger. In addition, when the droplet diameter is larger, its residence time larger.
These results qualitatively compare well with the results of Celata et al.[10], Mayinger et al.[7], and Takahashi et al.[47] obtained for similar direct contact condensation problem. Figure 4-2 and 4-3 illustrate the non-dimensional droplet temperature found by Celata and Myinger, respectively.
29
Figure 4-3. Droplet non-dimensional temperature [7].
Due to high turbulence and interaction between continuous phase and the dispersed phase violent condensation occurs and the droplet temperature approaches to saturation temperature of the steam. The droplet non-dimensional temperature which is also called as condensation efficiency is defined as following:
0 0 d w s w T T T T (4.1)
In this equation Td is the droplet temperature at time t and Ts is the saturated steam temperature; Tw0 is the droplet initial temperature [10].
30
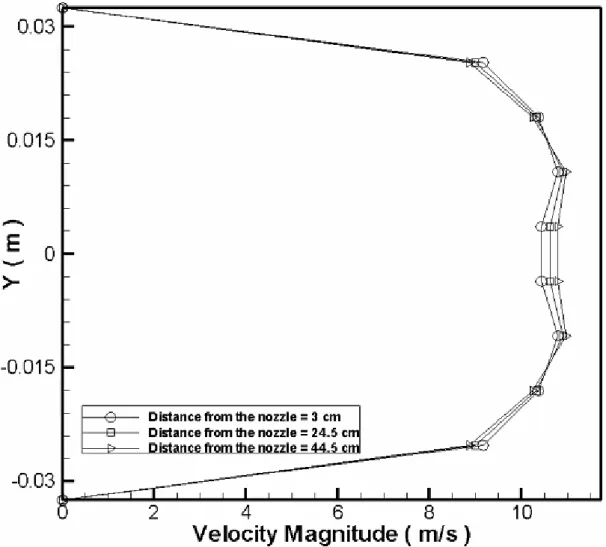
Figure 4-4. Velocity magnitude distribution at different horizontal distances from nozzle.
Figure 4-4 depicts the distribution of the velocity magnitude at different horizontal distances from the nozzle in the downstream direction. Since the spray and air-vapor mixture are in contrary direction to each other, at regions close to the spray velocity of the mixture is slightly less compared to regions far from the nozzle in the downstream direction. The momentum of the air-vapor mixture is very large, for this reason spray droplets could not change the mainstream velocity profile noticeably. There is a slight velocity reduction at the central core of the chamber due to presence of the spray.
31
Figure 4-5. Pressure distribution along the horizontal centerline.
Figure 4-5 depicts the pressure distribution on the horizontal centerline of the channel. Figure 4-6 illustrates the effect of gravity on the droplet velocity. The effect of gravity should be included in the right hand side of the equation (3.5). However Figure 4-6 indicates that gravity does not affect the droplet velocity. Because of the large momentum of the air-vapor mixture, gravity does not affect the trajectories of the droplets. In addition, droplets immediately change their direction and flow to the same direction with the air-vapor mixture. Consequently effect of gravity on the simulations could be neglected.
32
Figure 4-6. Effect of gravity on droplet velocity distribution.
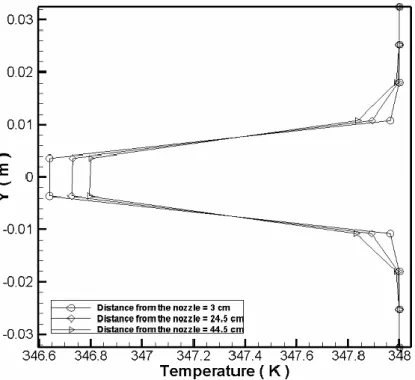
Figure 4-7. Humidity distribution at different horizontal distances from the nozzle. This section shortly discusses the effect of chilled-water spray on relative humidity, temperature, and humidity distribution of the continuous phase. In this part the distributions of various parameters are illustrated for the case with the mass flow rate of 3gr/s, water temperature of 288 K, spray cone angle of 60° and droplet diameter of
33
10 µm. Figure 4-7 depicts the humidity pattern at different distances from the nozzle. It is illustrated that there is a remarkable humidity reduction close to the nozzle. For the locations far from the nozzle humidity reduction is less noticeable. The results show that at distances close to the nozzle, condensation rate is higher than distances far from the nozzle. At 3cm from the nozzle drastic reduction of humidity indicates a large amount of condensation taking place right after the nozzle.
Figure 4-8. Temperature distribution at different horizontal distances from the nozzle.
Figure 4-8 illustrates the temperature distribution at different horizontal distances from the nozzle at downstream direction. Due to presence of the spray in the channel centerline, the highest temperature reduction takes place in this region. Figure 4-8 depicts that close to the nozzle temperature reduction is higher compared to regions far from the nozzle in the downstream direction.
34
Figure 4-9. Relative humidity distribution at different distances from the nozzle. Figure 4-9 depicts the relative humidity distribution at different distances from the nozzle. Due to sensible heat cooling relative humidity of the mixture enhances [48]. It is shown that relative humidity before the injection was 90 % and after the injection it is increased due to decrease in temperature. Decrease in temperature reduces the vapor carrying capacity of the air to contain vapor. It is observed that relative humidity enhancement rate right after the nozzle is higher than regions far from the nozzle in the downstream direction.
4.1.1. Evaporation and Condensation Mechanism
Since water droplets absorb the sensible heat of the mixture, surrounding air temperature decreases. During the sensible cooling process the moisture content is constant and dry-bulb temperature of the air is decreased. At the same time when the vapor pressure at the surface of the water is greater than that of the surrounding mixture, evaporation will take place. Latent heat of evaporation which is the energy required to change the phase of the water droplet (liquid) to water vapor (gas) will reduce the surrounding air temperature [48].