A STUDY FOR DEVELOPMENT OF STATISTICAL LITERACY SCALE FOR UNDERGRADUATE STUDENTS
by Füsun Şahin
B.S., Secondary School Science and Mathematics Education, Boğaziçi University, 2009
Submitted to the Institute for Graduate Studies in Science and Engineering in partial fulfillment of
the requirements for the degree of Master of Science
Graduate Program in Secondary School Science and Mathematics Education Boğaziçi University
A STUDY FOR DEVELOPMENT OF STATISTICAL LITERACY SCALE FOR UNDERGRADUATE STUDENTS
APPROVED BY:
Prof. Füsun Akarsu ………... (Thesis Supervisor)
Prof. Fetih Yıldırım ……….... (Thesis Co-Supervisor)
Assist. Prof. Diler Öner ……….
Fatma Aslan-Tutak, Ph.D. ……….
Filyet Aslı İşçimen, Ph. D. ……….
ACKNOWLEDGEMENTS
First of all, I would like to thank my family, friends and teachers for encouraging and supporting me to make graduate study and choose academic life as a career path.
To begin with, I have to thank my thesis supervisor Prof. Füsun Akarsu for sharing her experiences. It was really a burden for her during her busy schedule filled with non- academic jobs.
I would like to thank to my thesis committee members Assist. Prof. Diler Öner for her careful analysis and feedback for my draft since the beginning of this thesis, Fatma Aslan Tutak, Ph.D. for her valuable feedbacks and guidance, Filyet Aslı İşçimen, Ph.D. for her time to read my study and being always available for my questions and her counter questions. Last but not the least, I would also like to thank to Prof. Fetih Yıldırım for his guidance in statistics, I learnt a different aspect of statistics every time we met.
I am also thankful to Prof. Ali Baykal, for his inspiring courses and guidance as a measurement specialist who inspired me to develop a measurement instrument for this thesis and to continue academic life in the area of measurement. I could not decide such a path without your welcoming attitude, the wisdom you shared with us and generous support every time I needed.
I would also thank to Prof. Dilek Ardaç for joyful and insightful courses. I had the opportunity to work with you in the warmly environment you provided and took courses from you, thank you Assoc. Prof. Ayşenur Yontar Toğrol and Asisst. Prof. Buket Yakmacı Güzel, Assist. Prof. Sevil Akaygün, Fatih Çağlayan Mercan,Ph.D. and Gülseren Karagöz Akar, Ph.D. Special thanks go to department secretary Gülşen.
I cannot forget to thank my assistant friends Aysun, Ruhan, Derya, Oğuz, Zerrin, Gürsu, Zeynep, Mustafa and remember my classmates Sevil, Ayşe, Berra, Sibel, and Tuğba. My sincere thanks to Pınar Şener for her accompaniment throughout this thesis study, for sharing her experiences, joy, and her keeping me together when I felt frustrated.
Finally, I would like to thank to scholars who gave permission to use their questions. I cannot ignore the support of the scholars and who helped me in continuous and huge data collection phases and their students who volunteered to participate to this study: Prof. Dr. Ferhan Çeçen, Assoc. Prof. Asım Karaömerlioğlu and his doctoral students, Assit. Prof. Nalan Babür, Assit. Prof. Ulaş Akküçük, Assist. Prof. Senem Yıldız, Assit. Prof. Müge Kanuni, Dr. Gözde Ünal, and Dr. Serkan Özel.
ABSTRACT
A STUDY FOR DEVELOPMENT OF STATISTICAL LITERACY
SCALE FOR UNDERGRADUATE STUDENTS IN A UNIVERSITY
Statistical literacy was defined as the ability to understand basic concepts, vocabulary and symbol of statistics, and some probability; and critically evaluate statistical information in everyday life situations. The aim of this study was to develop a valid and reliable instrument measuring statistical literacy for university students. Statistics content covered in previous instruments on statistics learning (CAOS- Web ARTIST Project, 2005; Statistical Literacy Skills Survey, Schield, 2008; ARTIST Topic Scales, 2006) and 6-12 grades curricula implemented in Turkey were examined. A Statistical Content Rating Form (SLCRF) was formed in the light of knowledge and skills involved in the related domain. Scholars who were offering statistics and research methods courses were asked which statistics topics undergraduate students are required to know for being statistically literate. Content coverage was determined according to scholars’ answers, and then questions were selected among existing instruments in the literature. For topics that questions in the literature are insufficient then new questions were written by the researcher. Suggested questions were examined by experts and the 42 questions were chosen and tried out with a pilot study with 33 participants. Based on the results, the number of questions was reduced to 20 and it was tried again with a sample consisting of 90 participants. Then, the number of questions was reduced to 17 and Statistical Literacy Scale (SLS) was developed. SLS was administered to 476 undergraduate students. The construct validity of SLS was examined with experts’ item based opinions and results of factor analysis. Content validity was assured with SLCRF results. From the data gathered from 476 participants the Cronbach alpha coefficient was calculated as .532. It is possible to say that SLS has the attributes of construct, content, and curricular validity.
ÖZET
LİSANS ÖĞRENCİLERİ İÇİN İSTATİSTİKSEL OKURYAZARLIK
ÖLÇEĞİ GELİŞTİRİLMESİ ÇALIŞMASI
İstatistiksel okuryazarlık günlük hayat durumlarında verilen istatistiki bir bilgiyi anlayabilmek, yorumlayabilmek ve istatistiki bilgi ve bu bilgi üzerinden yapılan yorumu eleştirebilmek olarak tanımlanmıştır. Bu çalışmanın amacı istatistiksel okuryazarlığı ölçen, bir devlet üniversitesinde okuyan lisans öğrencileri üzerinde geçerli ve güvenilir bir ölçek geliştirmektir. İstatistik öğrenmeleri üzerine geliştirilmiş enstrümanların (CAOS- Web ARTIST Project, 2005; Statistical Literacy Skills Survey, Schield, 2008; ARTIST Topic Scales, 2006) ve Türkiye’deki 6-12 sınıflar müfredatının (MEB, 2005 ve 2009) içerdikleri istatistik konuları incelenmiştir. Bu konular ve becerilerden yola çıkarak İstatistiksel Okuryazarlık İçerik Derecelendirme Formu (İOİDF) oluşurulmuştur. İstatistik ve araştırma yöntemleri dersi veren öğretim elemanlarına üniversite öğrencilerin istatistiksel okuryazar olmaları için hangi konuları bilmeleri gerektiği sorulmuştur. Alınan cevaplara göre konu içeriği belirlenmiş, ilgili konulardaki sorular literatürdeki ölçme araçlarından seçilmiş ve eldeki soruların yetersiz kaldığı konularda yeni sorular araştırmacı tarafından yazılmıştır. Önerilen sorular uzmanlarca incelenmiş ve seçilen 42 soru 33 katılımcının katıldığı bir pilot çalışma ile denenmiştir. Sonuçlar ışığında soru sayısı 20’e düşürülmüş ve 90 kişilik bir örneklemde yeniden denenmiştir. Bu çalışma sonunda soru sayısı 17’e düşürülmüş ve İstatistiksel Okuryazarlık Ölçeği (İOÖ) geliştirilmiştir. İOÖ 476 lisans öğrencisine uygulanmıştır. İOÖ’nin kavram geçerliliği uzmanların soru bazında kanıları ve faktör analizi sonuçlarıyla değerlendirilmiştir. Kapsam geçerliliği İOİDF sonuçları ile belirlenmiştir. Dörtyüz yetmiş altı kişiden alınan veriler üzerinde ölçeğin Cronbach alpha katsayısı .532 çıkmıştır. İOÖ’nin kavram, kapsam ve müfredat geçerliliği özelliklerine sahip olduğu söylenebilir.
TABLE OF CONTENTS
ACKNOWLEDGEMENTS ... iii
ABSTRACT. ... v
ÖZET... vi
LIST OF FIGURES ... xi
LIST OF TABLES ... xii
LIST OF SYMBOLS ... xv
LIST OF ACRONYMS/ABBREVIATIONS ... xvi
1. INTRODUCTION ... 1
2. LITERATURE REVIEW ... 3
2.1. Definitions of Statistical Literacy ... 3
2.2. Related Constructs ... 6
2.2.1. Statistical Reasoning ... 6
2.2.2. Statistical Thinking ... 7
2.3. Models of Statistical Literacy ... 8
2.4. Content of Statistical Literacy ... 11
2.4.1. Statistical Literacy Content in Instruments ... 12
2.4.2. Statistical Literacy Content in Instruction ... 13
2.4.3. Suggested Statistical Literacy Content by Authors ... 14
2.4.4. Statistical Literacy Content in Curricula ... 15
2.5. Context of Statistical Literacy ... 18
2.5.1. Statistical Literacy in the Turkish Context ... 18
2.6. Statistical Literacy and Research Competency ... 21
2.7. Definition of Statistical Literacy Used in This Study ... 23
3. SIGNIFICANCE ... 25
4. STATEMENT OF THE PROBLEM ... 26
4.2. Instruments ... 27
4.2.1. Statistical Literacy Content Rating Form... 27
4.2.2. Item Rating Form ... 27
4.2.3. Demographic Survey ... 28
5. METHODOLOGY ... 29
5.1. Phase 1 - Initial Preparation of the Instrument... 31
5.1.1. Clarifying the Content ... 31
5.1.2. Overall Plan and Test Specifications ... 34
5.1.3. Item Selection and Construction ... 35
5.1.4. Scoring ... 37
5.2. Phase 2 of the Study- First Pilot Study ... 38
5.2.1. Participants ... 38
5.2.2. Administration ... 40
5.2.3. Data Analysis ... 40
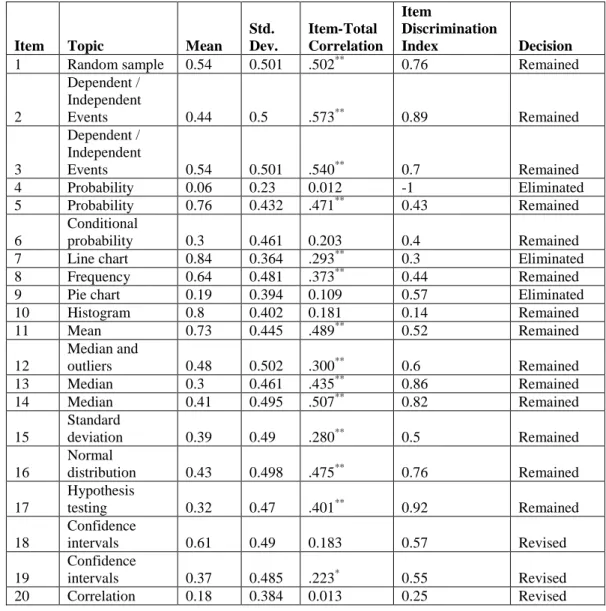
5.2.4. Item Revision ... 44
5.3. Phase 3 of the Study- Second Pilot Study ... 47
5.3.1. Participants ... 47
5.3.2. Administration ... 48
5.3.3. Data Analysis ... 48
5.3.4. Item Reduction ... 52
5.3.5. Item Revision ... 54
5.4. Phase 4 of the Study- Third Pilot Study ... 55
5.4.1. Participants ... 55
5.4.2. Administration ... 61
5.4.3. Data Analysis ... 62
5.5. Phase 5 of the Study- Translation of the Instrument ... 75
5.5.1. Translation Method ... 75
5.5.2. Translation of the Instrument ... 76
5.5.4. Sample and Participants ... 78
5.5.6. Data Analysis ... 79
5.6. Further Analysis ... 82
5.6.1. Differences Related to Year of Study ... 83
5.6.2. Differences Related to Departments ... 86
5.6.3. Correlation between GPA and SLS Scores ... 90
6. RESULTS ... 92
6.1. Evidence on Validity ... 92
6.1.1. Confirming Evidence of Content Validity ... 92
6.1.2. Confirming Evidence of Construct Validity ... 94
6.1.3. Confirming Evidence of Curricular Validity ... 96
6.1.4. Disconfirming Evidence of Validity ... 98
6.2. Evidence about Reliability ... 99
6.2.1. Confirming Evidence of Reliability ... 99
6.2.2. Disconfirming Evidence of Reliability ... 100
7. LIMITATIONS ... 101
7.1. Limitations about Participants... 101
7.2. Limitations about the Content ... 101
8. DISCUSSIONS ... 103 8.1. Participants ... 103 8.2. Content of SLS ... 104 8.3. Questions ... 106 8.4. Validity of SLS ... 107 8.5. Reliability of SLS ... 108 9. FURTHER RESEARCH ... 109
APPENDIX A: STATISTICS TOPICS IN RELATED STUDIES ... 110
APPENDIX B: STATISTICAL LITERACY CONTENT RATING FORM ... 116
APPENDIX C: EXPERTS’ ANSWERS TO CONTENT RATING FORM ... 119
APPENDIX D: FINAL TEST PLAN ... 120
APPENDIX E: DETAILED TEST PLAN FOR SLS ... 121
APPENDIX G: İSTATİSTİK OKURYAZARLIĞI ÖLÇEĞİ- TÜRKÇE ÇEVİRİSİ ... 126 REFERENCES ... 130
LIST OF FIGURES
Figure 2.1. Gal’s definition of statistical literacy. ... 5
Figure 2.2. delMas’ (2002) models of statistical literacy. ... 9
Figure 2.3. Sanchez’s (2007) models of statistical literacy. ... 10
Figure 4.1. Part of Statistical Literacy Content Rating Form. ... 27
LIST OF TABLES
Table 2.1. Watson and Callingham’s (2004) hierarchical levels of statistical literacy. .... 4
Table 2.2. Comparison of Watson’s (1997) framework and statistical literacy themes. ... 6
Table 2.3. delMas’ (2002) three instructional domains. ... 8
Table 2.4. Basic statistics and probability topics covered in grades 6-12. ... 16
Table 2.5. Common topics covered in statistics courses in a public university. ... 17
Table 2.6. Statistical literacy definition used in this study. ... 24
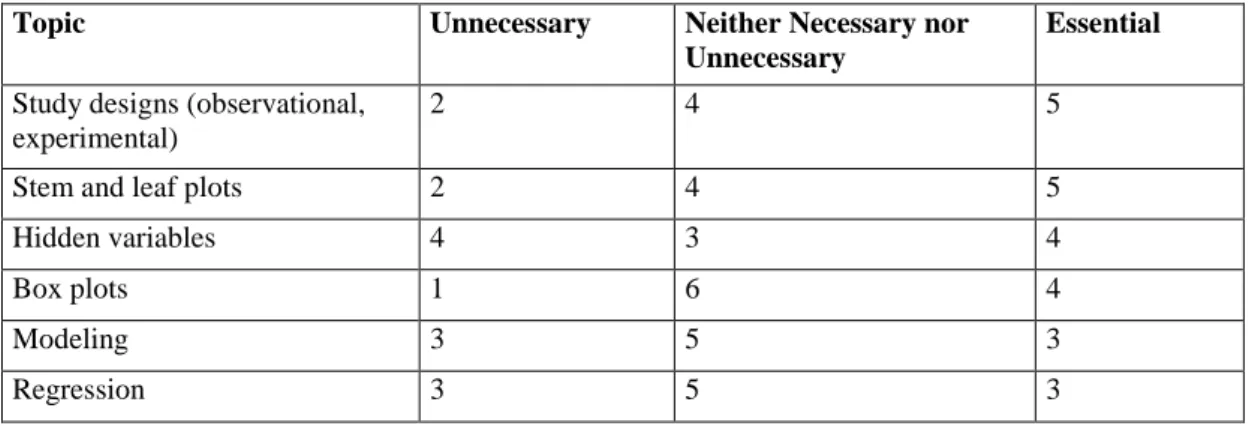
Table 5.1. Frequency of Most rated statistics topics. ... 33
Table 5.2. Least rated statistics topics. ... 34
Table 5.3. Distribution of participants’ for the first pilot study. ... 38
Table 5.4. The population for the first pilot study. ... 39
Table 5.5. Descriptive statistics of the first pilot study. ... 41
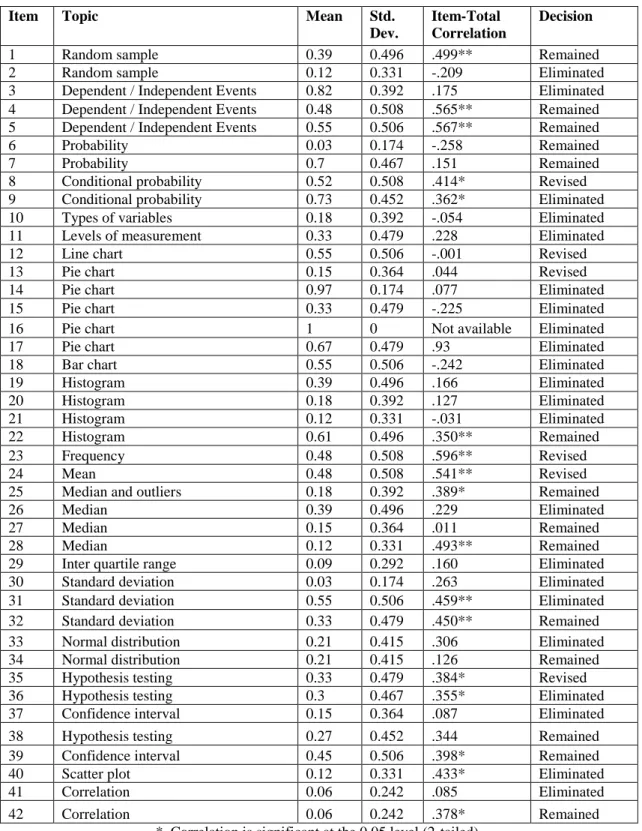
Table 5.6. Item - total correlations for the first pilot study. ... 41
Table 5.7. Questions eliminated and reasons for elimination. ... 43
Table 5.8. Comparison of questions remained and reason for stay. ... 44
Table 5.9. Overall properties and decisions of questions in the first pilot study. ... 46
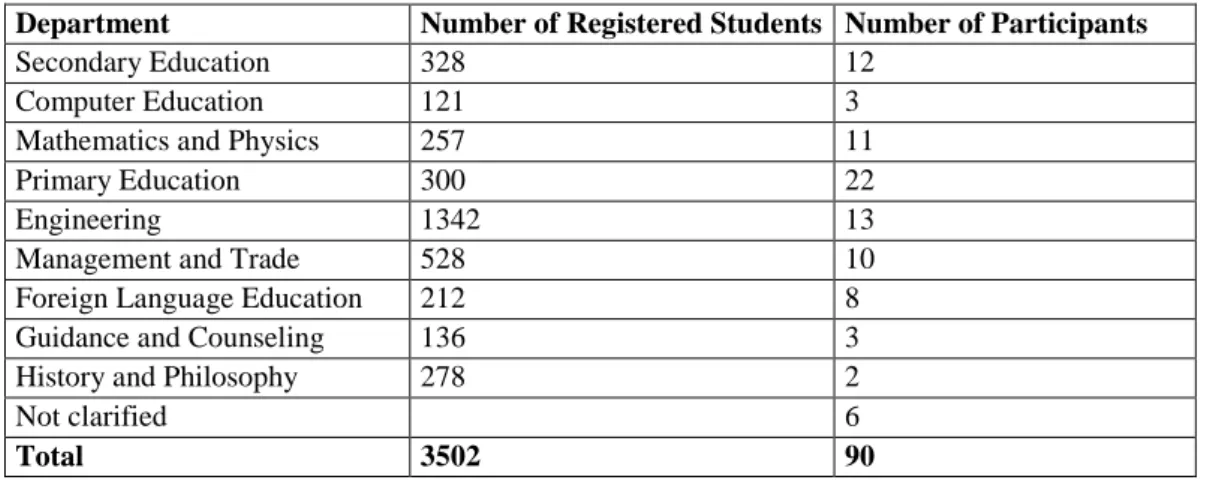
Table 5.10. Profile of the participants in the second pilot study. ... 47
Table 5.11. Descriptive statistics for the second pilot study. ... 49
Table 5.12. Item- total score correlations for second pilot study. ... 50
Table 5.13. Item difficulty scores for second pilot study. ... 50
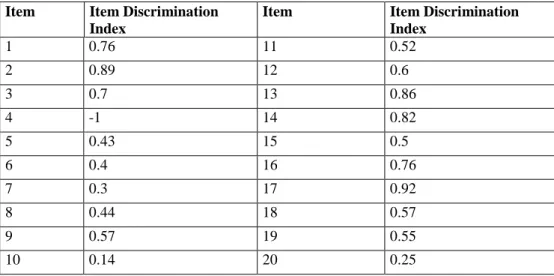
Table 5.14. Item discrimination index for questions in the second pilot study. ... 52
Table 5.15. Overall properties and decisions for the questions in the second pilot study. 55 Table 5.16. Profile of participants in the third administration. ... 57
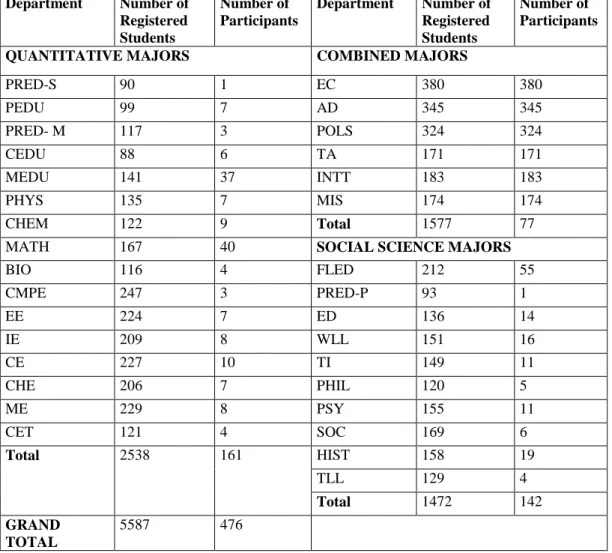
Table 5.17. Number of students registered to the departments. ... 58
Table 5.18. Number of people by the type of their majors. ... 59
Table 5.19. Stratified sample size calculation for third administration. ... 60
Table 5.21. Descriptive statistics for third administration. ... 63
Table 5.22. Item Difficulty index for third administration. ... 64
Table 5.23. Overall properties and decisions of questions in the third administration. .... 64
Table 5.24. Percentage of options... 65
Table 5.25. Most common answers in the third administration. ... 66
Table 5.26. KMO and Bartlett’s test results for third administration. ... 67
Table 5.27. Factor analysis for third administration. ... 68
Table 5.28. Component matrix for third administration. ... 69
Table 5.29. Rotated component analysis. ... 70
Table 5.30. Total variance explained with three factors. ... 71
Table 5.31. Component matrix with three components. ... 71
Table 5.32. Factor analysis for third administration with two factors. ... 72
Table 5.33. Component matrix for third administration with two factors. ... 72
Table 5.34. Content of questions and dimensions for third pilot study. ... 73
Table 5.35. Corrected item- total correlations and Cronbach’s alpha if item deleted. ... 75
Table 5.36. Participants in the fourth administration. ... 78
Table 5.37. Descriptive statistics regarding Turkish and English versions of SLS. ... 80
Table 5.38. Test of normality for Turkish version scores and English version scores. .... 80
Table 5.39. Result of paired samples t- test. ... 80
Table 5.40. Result of McNemar test. ... 81
Table 5.41. Descriptive statistics for participants specified and not specified their years of study. ... 83
Table 5.42. Result of independent samples t- test. ... 84
Table 5.43. Descriptive statistics for year groupings total score. ... 85
Table 5.44. Result of test of homogeneity of variances total score. ... 85
Table 5.45. One way ANOVA results for grade groupings total score. ... 85
Table 5.46. Post Hoc Test results for grade groupings total score. ... 86
Table 5.47. Descriptive statistics for type of majors. ... 87
Table 5.48. Result of test of homogeneity of variances. ... 87
Table 5.50. Result of post hoc test for type of majors total scores. ... 87
Table 5.51. Group statistics for MEDU and FLED. ... 88
Table 5.52. Result of t- test for total score comparison for MEDU and FLED... 88
Table 5.53. Descriptive information for faculties and schools total scores. ... 89
Table 5.54. Result of test of homogeneity of variances. ... 89
Table 5.55. One way ANOVA results for faculties and schools total score. ... 89
Table 5.56. Post Hoc test result for type of majors total scores. ... 90
Table A.1. Compilation of statistics topics in related assessment studies. ... 110
Table A2. Comparison of statistics topics in related assessment studies. ... 111
Table A.3. Statistics topics in related instruction studies. ... 112
Table A.4. Important topics in statistics as proposed by authors. ... 113
Table A.5. Content of statistics courses in a university... 114
Table A.6. Statistics topics in related curricula in Turkey. ... 115
Table C.1. Experts’ answers to content rating form. ... 119
Table D.1. Final test plan. ... 120
LIST OF SYMBOLS
d2 Square of the value of the deviation that is aimed to be achieved
n1 Quantitative majors
n2 Combined majors
n3 Social sciences
N Number of participants
p Probability of selecting a participant q Probability of not selecting a participant
t2 Square of the theoretical value found according to the t table
Standard deviation
2
LIST OF ACRONYMS/ABBREVIATIONS
SLS Statistical Literacy Scale Q1 - Q42 Question 1to Question 42
TQ1- TQ17 Question 1 to Question 17 in the Turkish version of SLS EQ1 – EQ17 Question 1 to Question 17 in the English version of SLS CAOS Comprehensive Assessment of Outcomes for a first course in
Statistics
SRA Statistical Reasoning Assessment
QRQ Quantitative Reasoning Questionnaire UCALL Union College for Lifelong Learning
SOLO Structure of the Observed Learning Outcome SLCRF Statistical Literacy Content Rating Form
GPA General Point of Average
AERA American Educational Research Association
APA American Psychological Association
NCME National Council on Measurement in Education
IRF Item Rating Form
KMO Kaiser Mayer Olkin
DS Descriptive Statistics
P Probability
ISI International Statistical Institute
BIO Biology CHEM Chemistry HIST History MATH Mathematics PHIL Philosophy PHYS Physics
PSY Psychology
SOC Sociology
TI Translation and Interpreting Studies
TLL Turkish Language and Literature
WLL Western Language and Literatures
AD Management
EC Economics
POLS Political Science and International Relations CET Computer Education and Educational Technology
ED Educational Sciences
FLED Foreign Language Education
PRED-M Undergraduate Program in Mathematics Education PRED-P Undergraduate Program in Preschool Education PRED-S Undergraduate Program in Science Education
CEDU Integrated B.S. and M.S. Program in Teaching Chemistry MEDU Integrated B.S. and M.S. Program in Teaching Mathematics PEDU Integrated B.S. and M.S. Program in Teaching Physics
CHE Chemical Engineering
CE Civil Engineering
CMPE Computer Engineering
EE Electrical and Electronically Engineering
IE Industrial Engineering
ME Mechanical Engineering
INTT International Trade
MIS Management and Information Systems
TA Tourism Administration
Sig. Significance
Std. Standard
Std. Dev. Standard Deviation
Min. Minimum
1. INTRODUCTION
In today’s world, the power of information is huge, especially when the information is yielded through scientific research. As findings of research activities are shared with public, statistical results and methods used are also narrated as well as the context and the research problem. Hence, it can be said that statistics is not only part of the researchers’ or experts’ experiences but in the daily experiences of all individuals. For example, an ordinary person encounters with statistical information while reading a newspaper article. Hence, the ability of dealing with statistical information is a necessity for everyone which constitutes the core ability of statistical literacy. For this reason, statistical literacy was chosen as the topic of this study.
There are different definitions (Hayden, 2004; Wallman, 1993, Schield, 2001, Burnham, 2003, Watson and Callingham, 2003 and 2004; Gal, 2004) and models of statistical literacy (delMas, 2002; Sanchez, 2007). Moreover, related concepts like statistical reasoning and statistical thinking were examined in this study. Based on the analysis of different definitions, common themes that emerge in different definitions of statistical literacy were revealed. These common themes can be listed as understanding of statistical results, understanding (the basic) concepts, vocabulary, symbols of statistics, and some probability, critical evaluation of information, and the context of everyday life. Since everyday experiences cannot be thought apart from the culture, the Turkish context was examined. Taking into account common themes in different definitions, different models of statistical literacy, and the Turkish context, an adapted definition of statistical literacy was formed. According to this definition statistical literacy was defined as understanding basic concepts, vocabulary and symbols of statistics, including some probability, and critically evaluating statistical information as encountered in everyday life situations.
Universities have an essential function as institutions for research and education. Besides producing scientific knowledge through research, students who will be active members of the society are cultivated in universities. In many departments statistics courses are given as a required course. Undergraduate students are expected to be able to
disseminate statistical information arise from research as they encounter everyday life. It is important to examine university students’ statistical literacy. Undergraduate students from all departments and years except English Language Preparation School and freshmen year students were considered as the population for this study.
In order to study statistical literacy empirically, there was the need for measuring this construct. Previous instruments measuring statistical literacy (Wilson, 1994; Schield, 2008) and related concepts (Garfield, delMas, and Chance, 2006; Garfield, DelMas, Chance, Poly, Ooms, 2006; Schield , 2008; Allen, 2006; Garfield, 2003) were examined. No similar study about statistical literacy was found in the Turkish context. Since the definition of statistical literacy used in this study was clarified by taking the Turkish context into account, a single instrument among existing instruments developed outside of Turkey was not suitable for this study. Therefore, it was decided to develop a new instrument, Statistical Literacy Scale (SLS), which is tailored to the definition of statistical literacy used in this study. The sample of the study was undergraduate students studying in a public university in Turkey.
Statistical Literacy Scale (SLS) was planned to be a multiple choice test where every question has only one keyed response. Items used in previous instruments were examined according to the cognitive level and content they were measuring. Among them questions that fit the scope of the SLS were selected and new questions were written when necessary. Two pilot studies and a final administration of SLS were carried out.
Moreover, the language was a consideration for the understandability of the scale. The scale was translated into Turkish and administered to a group of participants who had taken the English version of the scale. Qualitative comparisons depending on experts’ ideas of equivalency of the two versions of the scale and quantitative comparisons regarding statistical analyses between participants’ scores gained from the versions of the scale were done. It was seen that although scores gained from the Turkish version of SLS were higher, qualitative comparisons show that the two versions of SLS were equivalent.
2. LITERATURE REVIEW
2.1. Definitions of Statistical Literacy
The definition of statistical literacy has changed in terms of its scope and content. Nevertheless, the main aim of defining this construct remained the same. Some definitions of statistical literacy can be listed in the following pages.
In general terms, Hayden (2004) defined statistical literacy as the skills that a person needs in order to deal with issues of probability and statistics arise in everyday life. Wallman (1993) defined statistical literacy as the ability to understand and critically evaluate statistical results that guide our daily life. She also stressed the ability to appreciate the contributions that can be done to public, private, professional, and personal decisions by employing statistical thinking in her definition.
Furthermore, according to Schield (2001) statistical literacy is “the ability to review, interpret, analyze, and evaluate written materials (and detect errors and flaws therin).” Also again by Schield (2004) statistical literacy was summarized as being literate about everyday arguments that use statistics as evidence. On the other hand, Burnham (2003) defines statistical literacy as the habit of mind that makes us notice the strengths and weaknesses of claims and reports including statistical information, and also thinking the arguments based on statistical information as the claims, reports or arguments commonly appear in the non-technical media without specific prompting.
Watson and Callingham (2003, 2004) studied the ability of dealing with information provided with an empirical study. They proposed a six level hierarchical construct of statistical literacy where the levels are from idiosyncratic to critical mathematical levels which can be seen in detail in Table 2.1.
Table 2.1. Watson and Callingham’s (2004) hierarchical levels of statistical literacy.
Level Brief characterization of levels
6.Critical mathematical
Critical, questioning engagement with context, using proportional reasoning particularly in media or chance contexts, showing appreciation of the need for uncertainty in making predictions, and interpreting subtle aspects of language. 5.Critical Critical, questioning engagement in familiar and unfamiliar contexts that do not
involve proportional reasoning, but which do involve appropriate use of terminology, qualitative interpretation of chance, and appreciation of variation. 4.Consistent- Non
critical
Appropriate but non-critical engagement with context, multiple aspects of terminology usage, appreciation of variation in chance settings only, and statistical skills associated with the mean, simple probabilities, and graph characteristics.
3. Inconsistent Selective engagement with context, often in supportive formats, appropriate recognition of conclusions but without justification, and qualitative rather than quantitative use of statistical ideas.
2. Informal Only colloquial or informal engagement with context often reflecting intuitive non-statistical beliefs, single elements of complex terminology and settings, and basic one-step straightforward table, graph, and chance calculations.
1. Idiosyncratic Idiosyncratic engagement with context, tautological use of terminology, and basic mathematical skills associated with one-to-one counting and reading cell values in tables.
On the other hand, with narrowing the term statistical literacy to the context of adults living in industrialized societies, Gal (2004) formed a special definition consisting of two interrelated components. The first of these components of statistical literacy is the ability to interpret and critically evaluate statistical information, data related arguments, or stochastic phenomena. The second component is people's ability to discuss or communicate their reactions to such statistical information such as meaning, implications, or concerns about the information (Gal, 2004). The illustration of Gal’s (2004) definition can be found in Figure 2.1.
Figure 2.1. Gal’s (2004) definition of statistical literacy.
Although there are differences in conceptualizing statistical literacy, there are common elements of definitions in the literature. For instance, from the review of the literature four themes emerged in the definitions of statistical literacy which are:
understanding of statistical results (Wallman, 1993; Schield, 2001; Burnham, 2003; Garfield, delMas, and Chance, 2003; Watson and Callingham, 2003; Garfield, delMas, Chance, and Ooms, 2006)
the context of everyday life (Burnham, 2003; Watson and Callingham, 2003; Hayden, 2004; Schield, 2004)
understanding (the basic) concepts, vocabulary, symbols of statistics, and some probability (Garfield, delMas, and Chance, 2003; Watson and Callingham, 2003; and Garfield, delMas, Chance, and Ooms, 2006)
critical evaluation of information (Wallman, 1993; Watson and Callingham, 2003 and 2004; and Gal, 2004)
From this synthesis of the literature, understanding statistical concepts, and results; and critical evaluation of information can be considered as the abilities necessary to be statistically literate; where everyday life is the context of statistical literacy; concepts, vocabulary, symbols of statistics and some probability constitutes the content of statistical literacy.
Callingham (2006) stresses the necessity of identifying a framework for assessing statistical literacy. Watson (1997) presented a framework with three hierarchical components with increasing sophistication which can be listed as:
(i) a basic understanding of terminology of probability and statistics
(ii) an understanding of statistical language and concepts given in the context of wider social discussion
(iii) a questioning attitude for questioning the application of concepts to contradict claims made without proper statistical foundation
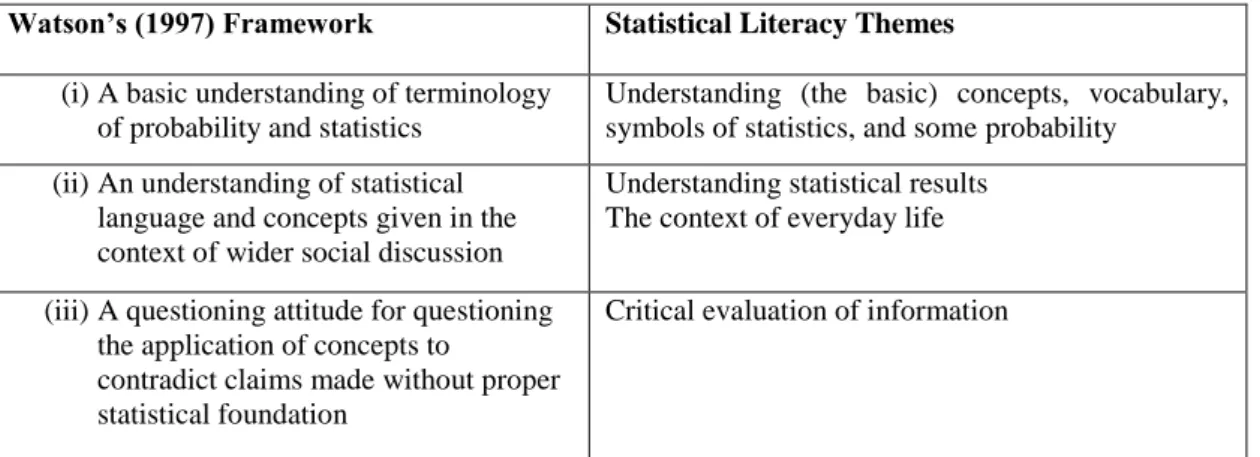
The four themes emerged from statistical literacy definitions and a tabular representation of the compatibility of Watson’s (1997) framework and these four themes can be seen in the following table:
Table 2.2. Comparison of Watson’s (1997) framework and statistical literacy themes.
Watson’s (1997) Framework Statistical Literacy Themes
(i) A basic understanding of terminology of probability and statistics
Understanding (the basic) concepts, vocabulary, symbols of statistics, and some probability
(ii) An understanding of statistical language and concepts given in the context of wider social discussion
Understanding statistical results The context of everyday life
(iii) A questioning attitude for questioning the application of concepts to
contradict claims made without proper statistical foundation
Critical evaluation of information
2.2. Related Constructs
To better understand statistical literacy, reviewing competencies related to statistical literacy is necessary. These constructs are statistical reasoning and statistical thinking. These concepts will be covered briefly under the following headings.
2.2.1. Statistical Reasoning
Garfield and Chance (2000) and Garfield, delMas, and Chance (2003) define statistical reasoning as the way people reason with statistical ideas and make sense of
statistical information. Some selected types of reasoning necessary for statistical reasoning can be listed as reasoning about data, reasoning about representations of data, reasoning about statistical measures, reasoning about uncertainty, reasoning about samples, and reasoning about association (Garfield, 2003). Garfield, delMas, and Chance (2003)’s clarification on statistical reason was summarized in Ben-Zvi and Garfield (2004) as statistical reasoning may involve connecting one concept to another (e.g., center and spread), or it may combine ideas about data and chance having in mind that reasoning means understanding and being able to explain statistical processes and being able to fully interpret statistical results.
2.2.2. Statistical Thinking
Snee (1990, p.118) defines statistical thinking as
“thought processes, which recognize that variation is all around us and present in everything we do, all work is a series of interconnected processes, and identifying, characterizing, quantifying, controlling, and reducing variation provide opportunities for improvement”.
Pfannkuch and Wild (2004) proposed five types of thinking that are fundamental for statistical thinking: Recognition of the need for data, transnumeration, consideration of variation, reasoning with statistical models, and integrating the statistical and contextual. According to them, recognition of the need for data stands for considering the real situations data as a prime requirement for reliable judgments, transnumeration means “changing representations to engender understanding”, consideration of variation occurs in the process of how variation arises and is transmitted through data and the uncertainty caused by unexplained variation. Moreover, statistical models are taken in a broad range including all types of tools that are used in representing and thinking about reality like graphs and by reasoning with statistical models people are expected to read, interpret and reason graphs, centers, spreads, clusters, outliers, residuals, confidence intervals, and p-values to find evidence on which to base a judgment. Lastly, Pfannkuch and Wild (2004) state that synthesizing statistical and contextual knowledge on concluding what can be learned from the data about the context is necessary for statistical thinking and they name this competency as integrating the statistical and contextual.
Garfield, delMas, and Chance (2003) summarizes that statistical thinking involves understanding of why and how statistical investigations are conducted and understanding “big ideas” like nature of variation and sampling, usage of data analysis methods and visual displays of data, research methods to claim causality. Moreover, statistical thinking includes understanding how models are used and utilizing the context of a problem in drawing conclusions.
From the analysis of definitions given above, it can be inferred that there is an understanding of statistical thinking that embraces statistical processes, variation, and the context. Chance (2002) suggests that from existing definitions it can be said that there exists a more global view of the statistical process which include understanding of variability and the statistical process as whole.
As a final word, delMas (2002) assumes that the content is not a determinant factor in distinguishing these three domains, but the cognitive engagement with the content is. Moreover, he lists the tasks he collected from literature related to each domain in the following table:
Table 2.3. delMas’ (2002) three instructional domains.
Basic Literacy Reasoning Thinking
Identify Describe Rephrase Translate Interpret Read Why? How? Explain (The Process) Apply Critique Evaluate Generalize
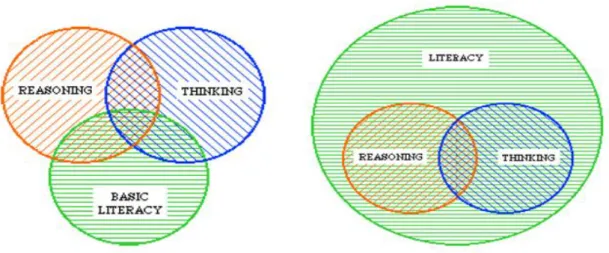
2.3. Models of Statistical Literacy
The models he proposes represent two different perspectives about the relationship between literacy, reasoning and thinking. One perspective he uses is focusing on literacy for the development of basic skills and knowledge necessary for statistical reasoning and statistical thinking. Another perspective is thinking of statistical literacy as a domain that encompasses other domains. In this second perspective, statistically reasoning and statistical thinking are sub goals in the pursuing of developing statistical literacy. In this
point of view, a statistically literate person is the one who also knows how to think statistically. These two models can be seen in Figure 2.2.
Figure 2.2. delMas’ (2002) models of statistical literacy.
In the first model, it is seen that statistical thinking, statistical reasoning, and statistical literacy are independent, yet overlapping domains. In this regard, literacy is considered as the basic literacy for which with identifying, describing, rephrasing, translating, interpreting, and reading is required. These activities can be thought as lower mental processes, which also correspond to “comprehension” level in terms of Bloom’s (1956) taxonomy of educational objectives or “understanding” level in terms of Anderson and Krathwohl's (2000) Taxonomy which is a revised version of Bloom’s taxonomy and equivalent of comprehension level.
On the other hand, Sanchez (2007) proposed two different models of statistical literacy where the complexity of statistical literacy and its relationship with other domains are different in each model. In her model the abbreviations L stands for statistical literacy, R statistical reasoning, and T for statistical thinking. Both models can be seen in Figure 2.3.
Figure 2.3. Sanchez’s (2007) models of statistical literacy.
As Sanchez (2007) declared, in the first model statistical literacy, statistical reasoning, and statistical thinking are independent domains which happen after the accomplishment of the previous one. In the longitudinal model, statistical literacy is the understanding of the whole process and levels of statistical reasoning, statistical thinking and statistical literacy are developing in a synchronized way. In this model, at the informal stage of statistical literacy, people know statistical processes like data collection, description, summary and inference. At the formal level people also know about some formal apparatus like confidence intervals or sampling distributions. From Sanchez’s explanation it can be inferred that the content is not determinant of the competency but it is important in the determining the level that the competency is processed. It can be also thought that delMas and Sanchez both agree on the idea that content does not determine the competency.
The idea of having different models is that there are two conceptualizations of statistical literacy: a competency that is as basic as literacy itself and a complex competency that embraces statistical thinking and statistical reasoning. These two conceptualizations can be summarized with the notions basic understanding of statistical literacy and complex understanding of statistical literacy. Moreover, the distinction between these two conceptualizations stems from the cognitive engagement but not the content.
From this perspective, it can be said that Watson and Callingham (2004), Burnham (2003), Schield (2001), and Wallman (1993) perceive statistical literacy as a complex construct. On the other hand definitions of Gal (2004) and Schield (2004) signal that these authors mainly focus on statistical literacy as a construct with basic competency.
The reasons on having different ideas about the complexity of the statistical literacy can be analyzed. As stated previously, there are four themes that emerge in definitions of statistical literacy: understanding of statistical results, the context of everyday life, understanding concepts, vocabulary, symbols of statistics, and some probability, and critical evaluation of information. Among these four themes the context of everyday life and understanding are relatively clear that the probability of affecting the complexity of statistical literacy is low but the competency of critical evaluation can be effective in determining the complexity of statistical literacy. Critical evaluation can mean a wide range of actions like criticizing the relationship between the data and its interpretation, criticizing the relationship between given statistical results and the research methods that the results were yielded through, or criticizing about the variables that are not included in the study but may affect the statistical results yielded. Hence, it can be said that the complexity of statistical literacy concept can differ through how deep individuals are expected to dig in criticizing a statistical expression they encounter.
2.4. Content of Statistical Literacy
As statistical literacy was described with understanding the concepts, vocabulary, symbols of statistics, and some probability (Garfield, delMas, and Chance, 2003; Watson and Callingham, 2003; and Garfield, delMas, Chance, and Ooms, 2006), it can be said that there is not a consensus about what content should be covered in statistical literacy. Identifying the basic concepts of statistics is an important question to be addressed in order to describe the scope of the definition of statistical literacy used in this study. Previous studies on assessment, teaching, proposals for necessary topics for statistics related concepts, and related curriculum were gathered and analyzed in terms of its content.
2.4.1. Statistical Literacy Content in Instruments
Previous studies assessing or teaching statistical literacy were examined in terms of their content coverage. To start with, studies assessing statistical literacy were searched. As it was seen from the models of statistical literacy, statistical can be seen in relation with statistical reasoning and statistical thinking. Therefore, instruments assessing statistical reasoning and statistical thinking were also searched. It was considered that some topics could be covered commonly although the depth of topics could be different in such instruments. In addition, instruments assessing statistics achievement were also searched.
To start with, Schield (2002, 2008) constructed an inventory about “Reading and Interpreting Tables and Graphs Involving Rates and Percentages” and developed it into “Statistical Literacy Skills Survey. The item- total score correlations, percentage of questions which were answered right were calculated, and by modeling different number of questions, he asserts that the improvement of the instrument can be possible by eliminating some of the questions (Schield, 2008). However no evidence for construct and content validity was reported.
Other than statistical literacy instruments, Garfield, delMas, and Chance (2006) published their project named Assessment Resource Tools for Improving Statistical Thinking (ARTIST) aimed at improving research on statistical literacy, reasoning and thinking for undergraduate students. They developed topic based scales which cover 11 topics each consisting of 7-15 multiple-choice items to assess student reasoning in those particular topics. The psychometric properties of these scales are not published that’s why; they cannot be reported here.
Another study is Comprehensive Assessment of Outcomes for a first course in Statistics (CAOS) test produced by Garfield, DelMas, Chance, Poly, Ooms (2006). The aim of such a study is developing an instrument for measuring conceptual understanding of important statistical ideas by a broader range of students who enroll in the first, non-mathematical statistics courses at the undergraduate level. The content validity for CAOS was assured with three rounds of evaluation by content experts for college-level non-mathematical first course in statistics (delMas, Garfield, Ooms, and Chance, 2006). The
psychometric properties of this scale was reported as valid and reliable (Cronbach alpha= .82) when it was tried in undergraduate student groups (delMas, Garfield, Ooms, and Chance, 2006; 2007).
Allen (2006) developed an instrument called The Statistics Concept Inventory for assessing conceptual understanding of students taking statistics courses from different departments including engineering, mathematics, and social sciences. Content validity of the instrument was achieved through surveying faculty about the necessity of statistics topics in their curricular needs. Moreover, the reliability of the instrument was calculated in different administrations and for the last administration the alpha of the instrument was found as .76.
Garfield (2003) developed and instrument for assessing statistical reasoning named Statistical Reasoning Assessment (SRA) consisting of 20 multiple choice items about probability and statistics concepts as it was defined as reasoning with statistical ideas and making sense of statistical information (Garfield and Chance, 2000). The reliability analysis showed that inter correlations between items were low and items were not measuring one trait or ability.
Moreover, in 2003 Sundre Developed Quantitative Reasoning Questionnaire (QRQ) based upon revisions of Garfield’s (2003) instrument for the purpose of how students use quantitative information in everyday life. The new instrument consisted of 40 multiple choice items and was tried with 804 sophomore students. The internal consistency was calculated as .62. The compilation and comparison of statistics topics covered in assessment studies can be seen Appendix A in Table A.1 and Table A.2 respectively.
2.4.2. Statistical Literacy Content in Instruction
There were also studies which performed an instruction for the attainment of statistical literacy. Wilson (1994) developed and evaluated a statistical literacy program for the use of undergraduate students at Illinois which was named as “A Brief Course in Statistical Literacy”. Dimensions of this program were defined as understanding statistics, applying statistics, and interpreting statistic and topics in this program included picturing
data displays and describing distributions. He also developed an instrument, namely Test of Statistical Literacy I and II, for evaluating the attainment in the course content. He developed two parallel forms of the instrument to evaluate the effectiveness of his instruction, one to be administered as pretest and the other as posttest each consisting of 38 questions; the reliability of the pretest was calculated as .69 and as .82 for the posttest.
Schield (2003) also taught a one semester course in statistical literacy with business majors. This course covered the objectives like reasoning with statistics and describing rates and percents. In 2009, another course, a mini, five two-hour session course was designed for adults in Union College for Lifelong Learning (UCALL) which was named as Numbers in Everyday Life (Hahn, Doganaksoy, Lewis, Oppenlander, Schmee, 2010). Topics covered for this course included some examples and basic concepts, polls and forecasts. In addition, Merriman (2006) designed a unit of work on statistical literacy to ninety 14 years old students in New Zealand using media reports. The duration of the teaching was 12 hours and pre and post assessment were done with questions featured short answer questions involving media reports on statistical literacy concepts. Compilation of statistics topics covered in these instruction studies can be seen at Appendix A in Table A.3.
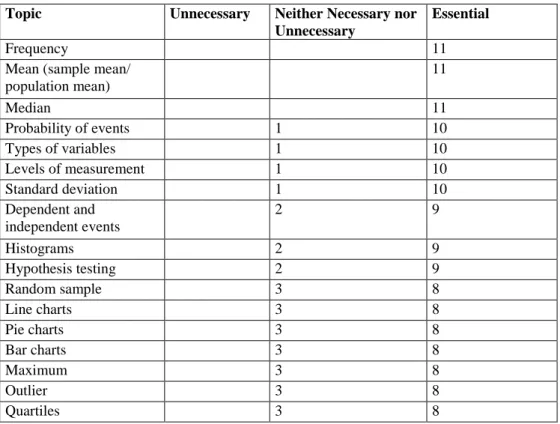
2.4.3. Suggested Statistical Literacy Content by Authors
There are some studies focused on proposing some important topics in statistics education. For example, Scheaffer, Watkins, and Landwehr (1998, as cited in Gal, 2004) proposed a list of topics that are essential to include in a study like number sense and understanding variables. Garfield and Ben-Zvi (2005) also offered a list of big ideas of statistics that students encounter throughout their education including data and distribution.
Moreover, some other researchers identified some ideas that every student should know. For example, in her article “What educated citizens should know about statistics and probability” Utts (2003) tried to compile ideas which she claims that necessary for every student who takes elementary statistics to be an educated citizen. These essential ideas include knowing when it can be concluded that a relationship is a cause and effect type of relationship and when it is not and the difference between statistical significance and
practical importance. Also Schield (1999) stated three important distinctions that are important in distinguishing a statistical literate person and an illiterate one. These distinctions are association versus causation, sample versus population, and the quality of the test versus the power of the test. The association versus causation distinction indicates the ability to distinguish between causal relationships from others. The sample versus population distinction stands for distinguishing target population from the sampled population and the distinction between the quality and power of a test includes the part and whole relationship. He also gives a full list of the knowledge areas that a statistically literate person accomplishes which also include interpreting what a statistic means and asking various questions about the statistics. The detailed list of statistics topics proposed as necessary by the authors mentioned can be seen at the Appendix A in Table A.4.
2.4.4. Statistical Literacy Content in Curricula
The statistics topics in mathematics curriculum can also be considered as a way to identify basic concepts of statistics. In United States, Sorto (2006) analyzed documents regarding mathematics education in middle grades from ten states, mostly being state standards and constructed contour maps accordingly. The map regarding ten states indicated that the least covered topics were shapes of distribution and the process of statistical investigation where the emphasis is on representations of data and measure of center (Sorto, 2006).
In Turkey, grades 1-8 are compulsory for all citizens and statistics topics in these eight year long curricula can be considered as the basic statistical knowledge that every citizen is expected to know. For university students, statistics subjects covered in grades 1-12 can be considered as the basic content knowledge that a person is expected to attain. Since Turkish curriculum before 2006 was spiral, it repeats the content with different depth and breadth analyzing statistics topics in grades 6-12 sufficient for understanding basic content knowledge that a university student is expected to attain.
The national curriculum at 6-8 grade levels includes subjects on both statistics and probability. The objectives are not separately defined for probability and statistics. The concepts for statistics and probability areas covered in these grades include basic
probability concepts, tables and graphs, and measures of center. When 9-12 mathematics curriculum on statistics and probability areas are analyzed, it was seen that there was only one related chapter. This chapter is in the 10th grade and about probability. However in 10th grade, students are assigned to different areas regarding their orientation and future ideals. Those students who wish to pursue degrees that require preparation on science and mathematics are required to take more and extensive science and mathematics courses. That’s why, probability unit is compulsory for only students those who wish to take extensive mathematics courses.
Compared with 1-5 grades curriculum, it can be seen that in 9-12 grades curriculum many of the content covered in primary school is not revisited and three new subjects were added. These new subjects are impossible events, certain events, and conditional probability. All the subjects regarding statistics and probability in grades 6-12 can be organized as follows:
Table 2.4. Basic statistics and probability topics covered in grades 6-12.
Topics for statistics and probability Concepts
Identifying probable events Permutation, combination
Basic probability concepts Experiment, result, sample, random sampling, equal probability, probability of an event
Event types Joint and disjoint events, dependent and independent
events, impossible event, certain events
Probability types Probability calculation of an event, experimental,
theoretical probability, subjective probability, conditional probability
Constructing questions for research and data collection
Research question, suitable sampling, data collection
Tables and Graphs Data representation, bar graphs, line charts, pie chart,
data interpretation, pictorial graphs, histograms Measures of central tendency and
spread
Mean, range, median, maximum, quartile ranks, standard deviation
Moreover, syllabi of statistics courses offered in a public university were collected. Many departments offer these statistics courses to students from majors related to the department like Management and Information Systems (MIS), Economics (EC), Political Sciences (POLS), Sociology (SOC), Psychology (PSY), Mathematics (MATH), International Trade (INTT), Mechanical Engineering (ME) and Civil Engineering (CE). Among the courses offered by the departments mentioned above, syllabi were found for some of the courses. Totally, nine course syllabi from five departments could be found
some of which sequential courses, such as Statistics I and Statistics II. There was a big variation on the topics included in a course depending on the necessities of each department. Although covered in different depth, some common topics were found across syllabuses. These common statistics topics can be found in the following table:
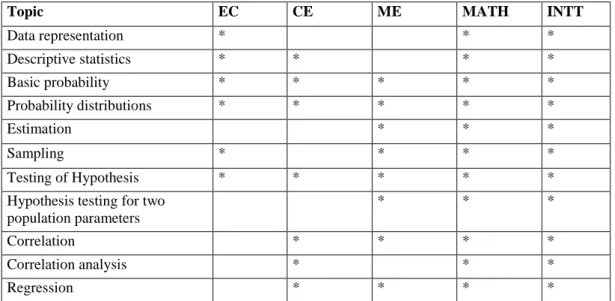
Table 2.5. Common topics covered in statistics courses in a public university.
Topic EC CE ME MATH INTT
Data representation * * * Descriptive statistics * * * * Basic probability * * * * * Probability distributions * * * * * Estimation * * * Sampling * * * * Testing of Hypothesis * * * * *
Hypothesis testing for two population parameters
* * *
Correlation * * * *
Correlation analysis * * *
Regression * * * *
(Note: EC: Economy, CE: Civil Engineering, ME: Mechanical Engineering, MATH: Mathematics, INTT: International Trade)
From the table, it can be seen that there is a variation in the content coverage even in the common topics. It should be noted that advanced statistics courses are also offered within the university. The statistics content included in those advanced statistics courses was excluded in the analysis regarding the common statistics topics at the university. The detailed list of statistics content as covered in these departments can be found at the Appendix A, in Table A.5. Moreover, the compilation of statistics topics covered in the curriculum in different grades can be seen Statistics Topics in Related Curricula in Turkey at the Appendix A in Table A.6.
2.5. Context of Statistical Literacy
Literature reveals statistical literacy requires understanding statistical claims and arguments and critically evaluating them in everyday life situations. The context in which it is meaningful to observe statistical literacy was defined as the context of everyday life by Burnham (2003), Watson and Callingham, (2003), Hayden (2004), and Schield (2004). There were studies which employed daily life examples in the instruction of statistics (Wilson, 1994; Merriman, 2006; Hahn, Doganaksoy, Lewis, Oppenlander, Schmee, 2010).
As Gal and Garfield (1997) stated, traditional questions used for assessment in statistics education usually lack an appropriate context and therefore are limited in giving information about students’ ability to interpret statistical arguments. Hence, statistics questions need to have some context to be effective for assessment.
Using everyday life examples can be seen in assessment of statistical literacy where several studies in statistical literacy were assessed in different contexts. Media articles and research reports (Reston, 2005; Budgett and Pfannkuch, 2007), journal articles (Budgett and Pfannkuch, 2007), and advertisements (Reston, 2005) were seen to be employed as the media for observing statistical literacy.
2.5.1. Statistical Literacy in the Turkish Context
A statistically literate person is expected to be literate about everyday statistics. That’s why; the context is important for understanding statistical literacy. Studies about statistical literacy in the Turkish context were searched however, the researcher was unable to find a study that is directly related to statistical literacy that was done in Turkish context. Therefore, studies about statistical thinking and attitudes towards statistics will be reviewed as the related literature about statistical literacy in the Turkish context.
Beginning with the most related study, Şahin (2011a) analyzed undergraduate students’ questioning of causality in media excerpts and compared them with Watson and Callingham’s (2004) levels of statistical literacy. She found that there is almost one to one correspondence with complexity of participants’ answers and hierarchical levels of statistical literacy proposed by Watson and Callingham. From the data, it can be said that
although many students are aware of the need for experimentation and control to infer causality, many hold idiosyncratic beliefs at the same time.
Moreover, Yılmaz (2003) examined university students questioning of media inferences and observed that university freshmen and sophomore students had the tendency of questioning information in terms of theory or agent where junior and senior students had the tendency of questioning information in terms of data and statistics.
Akkaş (2009) examined 6th
– 8th graders’ statistical thinking in describing, organizing, representing, analyzing, and interpreting data procedures using SOLO (Structure of the Observed Learning Outcome) taxonomy. This taxonomy describes developmental cognitive levels of thinking which are pre-structural, unistructural, multistructural, relational, and extended abstract levels (Biggs and Collis, 1991). In this taxonomy, students at pre-structural level have little understanding of the question posed and his answer is not related to the question. Students in unistructural level shows some understanding, he focuses on the question but only one aspect of it, he gives limited answers to questions. Students in multistructural level can approach the question from multiple aspects but his answers are not aligned with each other, the relationship between aspects emerges at the relational level. The student at relational level can give consistent answers and can understand the role of different aspects in his answer. In the extended abstract level, in addition to the previous level, student can make generalizations and can use reasoning beyond the task. Mooney (2002) developed a Statistical Thinking Framework based on SOLO taxonomy. In his study done with 6th, 7th, and 8th grade students, he tried to identify statistical thinking levels of participants which resulted in four levels: idiosyncratic, transitional, quantitative, and analytical levels with increasing complexity. Mooney found that no students were at the fourth level in Statistical Thinking Framework in all the four processes of data handling. Similarly, Akkaş found that most students were at the second and third stages, and most students are at the third level. Moreover, she also found that none of the students were at the fourth level in the data representation procedures with no students were found at the fourth level in all of the procedures. These results are in line with the previous research as she suggests.
There are also studies about the attitude and self-efficacy. Diri (2007) investigated attitude towards statistics in a vocational school. He developed a scale called “Attitude towards Statistics Scale” based on attitude scales in the literature and a mathematics attitude scale which assumes to measure attitude in the dimensions of love, profession, fear, pleasure, importance, interest, and confidence dimensions. Similarly the Attitude towards Statistics Scale he developed was seen to consist of the same seven dimensions. Moreover, these seven dimensions can be reduced to three dimensions where the first dimension consist of love, interest, and pleasure dimensions; the second one consist of fear and confidence dimension; and the third one consist of profession and importance dimensions. From the data he collected from vocational school students, he observed that students’ attitude varied for differed dimensions of attitude. Students were holding positive attitude for fear and importance dimensions; medium attitude for profession and pleasure dimension, and negative attitude for interest and confidence dimensions.
Sevimli (2010) studied about pre-service mathematics teachers’ misconceptions in statistics lessons, their self-efficacy in statistics, and attitude towards statistics. She translated Statistics Concept Inventory developed by Allen (2006) for measuring participants’ achievement levels in statistics. She concluded that participants are at low achievement level in statistics and have some misconceptions in statistics. Using the “Attitude towards Statistics Scale” developed by Diri (2007), she investigated pre-service mathematics teachers’ attitude levels. She found that participants attitude towards statistics are medium levels of attitude in fear, pleasure, importance, confidence dimensions and negative attitude towards profession and interest dimensions. Moreover, she also measured self efficacy towards statistics with the instrument developed by Finney and Schraw (2003) for this aim. She founded that preservice mathematics teachers in her sample showed high levels of self- efficacy towards statistics.
In a study comparing intercultural modes of thinking and reasoning Akarsu (2009) stated that there are differences between Western and Turkish cultures in terms of attributing place to statistics in their everyday lives. For instance, the lack of recording and reporting, and understanding of science, mathematics, and statistics as “unconnected” with everyday life was stressed in the Turkish culture whereas recording and reporting, and
understanding of science, mathematics, and statistics are more connected with everyday life in the Anglo-Saxon cultures.
To sum, when attitude of university students were examined (Diri, 2007 and Sevimli, 2010), it can be said that students hold medium and low levels of attitude towards statistics. Studies related to questioning inferences (Şahin, 2011a and Yılmaz, 2003) signal that many undergraduate students have the tendency to have idiosyncratic beliefs and questioning information in terms of theory or agent. When 6th to 8th grade students’ statistical thinking was examined (Akkaş, 2009), students were found to be at medium levels during different procedures. Finally, with a look to the culture, Akarsu (2009) found that statistics was understood as unconnected with everyday life in the Turkish culture. From this review, it can be said that thinking with statistics is not expected as a habit of mind for most of the students in Turkey in different levels. That’s why, it is reasonable to study statistical literacy as a basic competency in the context of Turkish undergraduate students.
2.6. Statistical Literacy and Research Competency
The relationship between adult college students’ level of statistical literacy and their academic background was examined by Wade (2009) and Wade and Goodfellow (2009) with a quasi-experimental design of research. The sample was taken from students enrolled in statistics, research methods course without a prior statistics course, research methods course with a prior statistics course, and a control group consisting of people who had taken neither of those courses. The results suggest that there were significant differences between students who have taken any of these classes and those who have not taken any of them in terms of the scores they gained from CAOS test. Moreover, there were statistically significant differences between students who had research method courses with prior statistics course and those who did not take that course, and those who have taken research methods course without prior statistics course. This difference can stem from research methodology course content which Cobb and Moore (1997) summarized as including (a) experimental method and the use of experimental and control groups, (b) pilot studies, (c) the logic of sampling and the need to infer from samples to populations, and (d) the notions of representativeness (as cited in Wade, 2009) which have overlaps with the contents of statistics courses offered. As an example, referring to the Table 2.5 it can be seen that
sampling which is a topic in research methods courses is a topic that is commonly covered in statistics courses given in a public university.
Pérez López (2006) examined theses and dissertations in educational psychology in terms of the statistics used in those studies and found that students had the following difficulties: a) their choice of a suitable statistical test concerning their objective of research, b) the way of interpreting data, c) selection of the design consistent with their objectives, d) their comprehension of the meaning of some statistical concepts, and e) their decision use of charts or graphs. Among the difficulties of comprehension of statistical concepts identified by Pérez López (2006), confusing association and causation, and validity and reliability are the most significant ones.
As for a study done in Turkey (Kabaca and Erdoğan, 2007) investigated about the statistical mistakes done by thesis writers in the field of education. They randomly chose 129 Master of Science and Doctor of Science theses from different universities in the fields of computer education, science education, physics education, chemistry education, and mathematics education. In the results, they found that there were errors in many thesis studies and those mistakes could be categorized into seven dimensions. These dimensions could be listed as errors related to validity and reliability of data collection instruments, sampling, using descriptive statistics, identifying normal distribution, using parametric and non-parametric studies, expressions used, and format. They concluded that encountering with many errors stems from insufficient statistics education. This study can be informative for describing the academic proficiency of graduate students in terms of their background in statistics.
In the Turkish context the national curriculum includes an elective course named as “research methods” for 10th
grade high school students who are pursuing a quantitative oriented major and receiving a curriculum focusing on quantitative courses. The aims of this course include defining basic concepts of research methods courses, recalling data collection methods and explaining the importance of research (TMoE, 2010). However, it is should be noted that this course is not frequently elected in high schools since it does not cover material that students are responsible for the university entrance exams. That’s why,