Volume XI
Issue 3(41)
Summer 2016
ISSN-L 1843 - 6110
ISSN 2393 - 5162
EDITORIAL BOARD
Editor in Chief
PhD Professor Laura GAVRILĂ (formerly ŞTEFĂNESCU)
Managing Editor
PhD Associate Professor Mădălina CONSTANTINESCU
Executive Editor
PhD Professor Ion Viorel MATEI
International Relations Responsible
Pompiliu CONSTANTINESCU
Proof – readers
Ana-Maria Trantescu–English
Redactors
PhD Assistant Cristiana Bogdănoiu PhD Assistant Sorin Dincă
European Research Center of Managerial Studies in Business Administration http://www.cesmaa.eu
Email: [email protected]
Editorial Advisory Board
Claudiu ALBULESCU, University of Poitiers, France, West University of Timişoara, Romania Aleksander ARISTOVNIK, Faculty of Administration, University of Ljubljana, Slovenia
Muhammad AZAM, School of Economics, Finance & Banking, College of Business, Universiti Utara, Malaysia Cristina BARBU, Spiru Haret University, Romania
Christoph BARMEYER, Universität Passau, Germany Amelia BĂDICĂ, University of Craiova, Romania Gheorghe BICĂ, Spiru Haret University, Romania Ana BOBÎRCĂ, Academy of Economic Science, Romania Anca Mădălina BOGDAN, Spiru Haret University, Romania Giacommo di FOGGIA, University of Milano-Bicocca, Italy
Jean-Paul GAERTNER, l'Institut Européen d'Etudes Commerciales Supérieures, France Shankar GARGH, Editor in Chief of Advanced in Management, India
Emil GHIŢĂ, Spiru Haret University, Romania Dragoş ILIE, Spiru Haret University, Romania
Cornel IONESCU, Institute of National Economy, Romanian Academy Elena DOVAL, Spiru Haret University, Romania
Camelia DRAGOMIR, Spiru Haret University, Romania Arvi KUURA, Pärnu College, University of Tartu, Estonia
Rajmund MIRDALA, Faculty of Economics, Technical University of Košice, Slovakia Piotr MISZTAL, Technical University of Radom, Economic Department, Poland Simona MOISE, Spiru Haret University, Romania
Mihail Cristian NEGULESCU, Spiru Haret University, Romania Marco NOVARESE, University of Piemonte Orientale, Italy Rajesh PILLANIA, Management Development Institute, India
Russell PITTMAN, International Technical Assistance Economic Analysis Group Antitrust Division, USA Kreitz RACHEL PRICE, l'Institut Européen d'Etudes Commerciales Supérieures, France
Mohammad TARIQ INTEZAR, College of Business Administration Prince Sattam bin Abdul Aziz University (PSAU), Saudi Arabia
Andy ŞTEFĂNESCU, University of Craiova, Romania Laura UNGUREANU, Spiru Haret University, Romania
J
ournal of
A
pplied
E
conomic
S
ciences
Journal of Applied Economic Sciences is a young economics and interdisciplinary research journal, aimed to publish articles and papers that should contribute to the development of both the theory and practice in the field of Economic Sciences.
The journal seeks to promote the best papers and researches in management, finance, accounting, marketing, informatics, decision/making theory, mathematical modelling, expert systems, decision system support, and knowledge representation. This topic may include the fields indicated above but are not limited to these.
Journal of Applied Economic Sciences be appeals for experienced and junior researchers, who are interested in one or more of the diverse areas covered by the journal. It is currently published quarterly in Spring (March), Summer (June), Fall (September) and Winter (December).
Journal of Applied Economic Sciences is indexed in SCOPUS www.scopus.com, CEEOL www.ceeol.org, EBSCO www.ebsco.com, and RePEc www.repec.org databases.
The journal will be available on-line and will be also being distributed to several universities, research institutes and libraries in Romania and abroad. To subscribe to this journal and receive the on-line/printed version, please send a request directly to [email protected].
Journal of Applied Economic Sciences
ISSN-L
1843 - 6110
ISSN
2393 – 5162
Table of Contents
Tomáš SADÍLEK
Marketing and Visitor’s Satisfaction
… 331
Amine AMAR, Imane El WAHLI, Zine Elabidine GUENNOUN, Youness LAAROUSSI
Fractal Analysis of Moroccan Dirham Exchange Rate: Theory and Comparative Results
… 340
Loredana VĂCĂRESCU HOBEANU
The Major Role of the Small and Medium-Sized Enterprises in the Market Economy .
... 351
Olga ANDREEVA, Evgeniy SHEVCHIKOrganizational and Financial Mechanism of New Russian Industrial Policy: Systemic Approach
... 364
Korhan KARACAOĞLU, Aslı KAPLANAn Examınatıon of the Relatıonshıp between Procrastınatıon and
Self-Effıcacy: An Empırıcal Study …
374
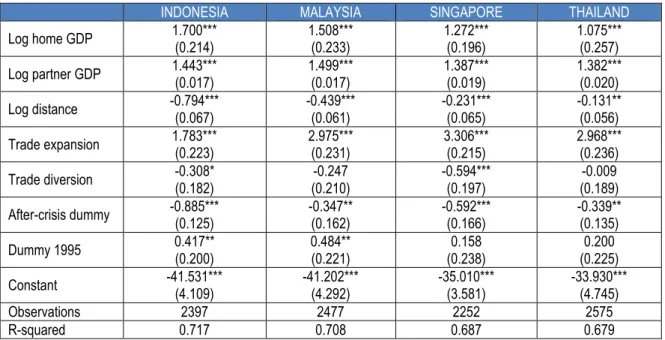
Pakasa BARY, Rani SETYODEWANTI
Variation of Regional Trade Agreement Impact across Member Countries:
Case of Southeast Asia
… 379
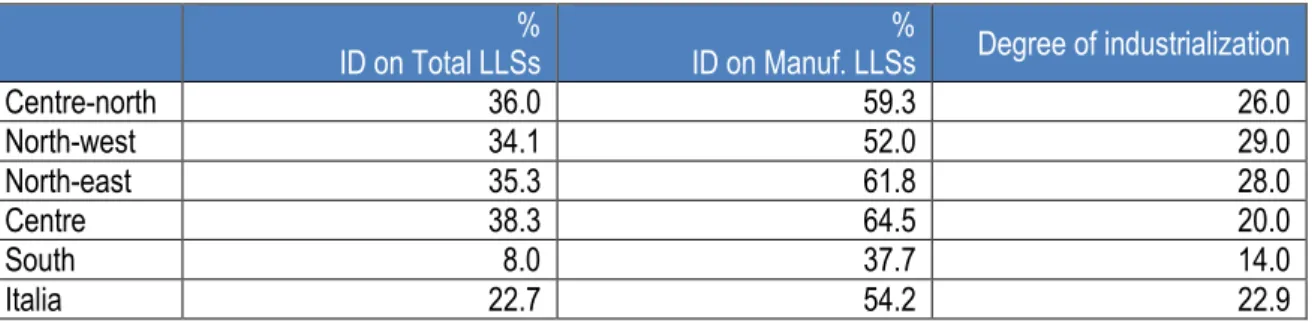
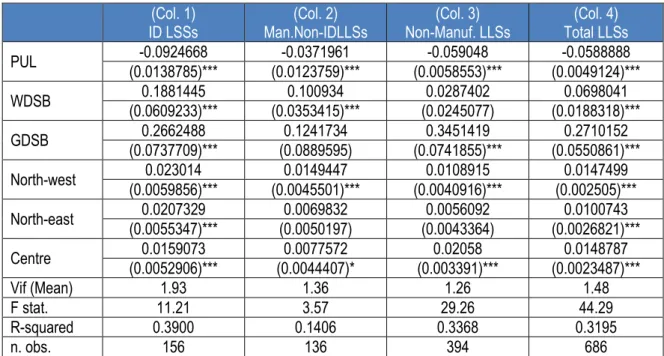
Claudio DI BERARDINO, Gianni ONESTI, Alessandro SARRA Impact of Distributive Services on the Productivity Growth:
The Case of Italian Industrial Districts
… 385
Jaroslav KOREČKO, Ivana ONDRIJOVÁ, Roman VAVREK, Stanislav PEREGRIN The Principle and the Development of Vallue Added Taxe Gap in Slovakia and in the
European Union
... 401
Dana KISELAKOVA, Beata SOFRANKOVA, Jarmila HORVATHOVA Impact of Risks on the Enterprise Performance in the European Union
by using Enterprise Risk Models ...
410
Mohammad Tariq INTEZAR, Ahmed Saied Rahama ABDALLAH, Venkata Sai Srinivasa RAO Opportunities and Challenges of Dates Industry in Saudi Arabia: A Study of AlKharj Region
…
428
2 1 3 4 5 6 7 8 9 10
Enikő KORCSMÁROS, Monika ŠIMONOVÁ
Selected Representatives of Regional Institutions to Support Small and Medium Enterprises
in Slovakia
... 435
Jaka SRIYANA
Optimum Size of Government Spending in Indonesia
... 441
Aparna CHOUDHARY, Sandeep MONDAL, Kampan MUKHERJEE
Green Supply Chain Management: Genesis, Trends and Phases
… 450
Saranya RAKSONG
The Determinants of Money Demand Function in the ASEAN-5 Countries
... 461
Ana KUNDID NOVOKMET, Anja BANOVIĆ
Why Do the Minimum Capital Adequacy Ratios Vary Across Europe?
... 472
Mahesh Chandra JOSHI, Mukta KUKREJA
Emerging Profiles of Indian Outward Foreign Direct Investments
… 488
Olga GRUSHINA, Gennady KHOMKALOV
The Housing Problem in the Light of Market Imperfections Theory
… 501
Arif Pirvelievich SHIHVERDIEV, Natalya Alekseevna MIHALCHENKOVA, Egor Ivanovich EREMEYEV
Methodology of the Assessment Industrial and Raw Agglomerations of the North:
Results of Application. Case Study Komi Republic
… 512
Pavel Aleksandrovicv BATAYKIN, Asya Shamilevna KHASANOVA, Valeriy Vladimirovich SHLYCHKOV, Aidar Ravilevich TOUMASHEV, Marina Viktorovna TOUMASHEVA
Economic Growth in the Conditions of Resource Constraints:
Ordinal Approach to Optimization of Macroeconomic Production Structure
… 521
Wannuda PETPAIROTE, Nongnit CHANCHARAT
Corporate Governance, a Shield of Bankruptcy
… 532
13 12 11 14 15 16 17 18 19 20
Marketing and Visitor’s Satisfaction
Tomáš SADÍLEK University of Economics1, Prague, Czech Republic
Abstract:
The aim of the paper is to describe regional marketing as its own applied discipline of regional economics and to illustrate the method of visitors' satisfaction measurement in the field of regional marketing and tourism. Firstly, there are presented term regional marketing, various theoretical approaches, differences between company marketing and regional marketing, history of regional marketing and its applications. There are also demonstrated satisfaction measurement methods with focus on satisfaction pyramid method and Customer Satisfaction Index. In the field part, successful Czech experience with satisfaction measurement in the tourism and key outcomes from satisfaction research are introduced. The main research output is setting factors with the highest level of satisfaction and sinking trend of visitors' satisfaction in last three years. The project was ordered by Moravian-Silesian region to detect information about visitors of region for changing a marketing strategy in tourism.
Keywords: regional marketing, tourism, marketing research, satisfaction measurement.
JEL Classification: M31, R10.
1. Introduction
Regional marketing has in last couple of years increasing importance in theory as well in practice. Although people did not know regional marketing as a concept in past, they intuitively used some basic rules. Various locations strived to address potential investors, inhabitants or tourist. The theory of regional marketing has appeared 30 years ago as a systematic approach to manage certain localities (cities, counties, countries and regions) and there is customer orientation. Regional marketing uses many methods and tools common for company marketing (or profit organizations marketing). There are used situation analysis, SWOT analysis, positioning, branding, marketing research methods, marketing communication and other. One of the marketing research methods, which are suddenly still not very frequent in the Czech Republic, is satisfaction measurement.
The structure of this study is divided in several parts. First pharagraph called “Regional marketing” presents theoretical approaches, history and application of regional marketing and define its differences to business marketing. Next paragraph is about customer satisfaction in regional marketing, where some approaches to customer satisfaction are described. In the fourth part, “Results and discussions”, methodological framework, with research questions and information about samples are presented and then outputs from national research on tourist visitors’ satisfaction support previous theories. The goal of the research is to present, how is regional marketing and measurement of visitors’ satisfaction in the Czech Republic used. Research question of the study are: (1) How intensive is utilization of visitors’ satisfaction in regional marketing? (2) What are the main factors which visitors evaluate by highest satisfaction? and (3) How CSI (Customer Satisfaction Index) has been developed since 2010 till 2014. The results of the survey are discussed and its implications for public authorities.
2. Main text
We can understand classical marketing as achieving company goals due to satisfying customer needs. Regional marketing focuses on achieving cities' and regions' goals due to satisfying inhabitants', visitors' or potential investors' goals, thus regional marketing is a branch of classical marketing, where regions are described as very complex product. Regional marketing has been constituted and developed between 1970 and 1980. Another definition of regional marketing is a form of non-profit marketing, a variant of company marketing, or as a new one's own marketing discipline (Meyer 1999). As a form of non-profit marketing, the regional marketing conception is based on general non-profit marketing (Fortenberrry 2012). We can use a concept of non-profit marketing in regional marketing, only if the authorities in public government (mayors, regional council presidents etc.) respect marketing approaches in their management styles (Braun/Töpfe in Meyer 1999). Non-profit marketing is understood as marketing in non-commercial organizations. It means, to generate a profit, is not a primary goal, but the organization also gains public benefits.
There are only moving company marketing approaches and general principles into field of regional marketing with importance on marketing philosophy. The parts of the philosophy are using marketing management in companies, repeatedly marketing planning and research, using different marketing tools, concept of strategic and operations actions and principle of coordination of all marketing activities (Spieß in Meyer, 1999).
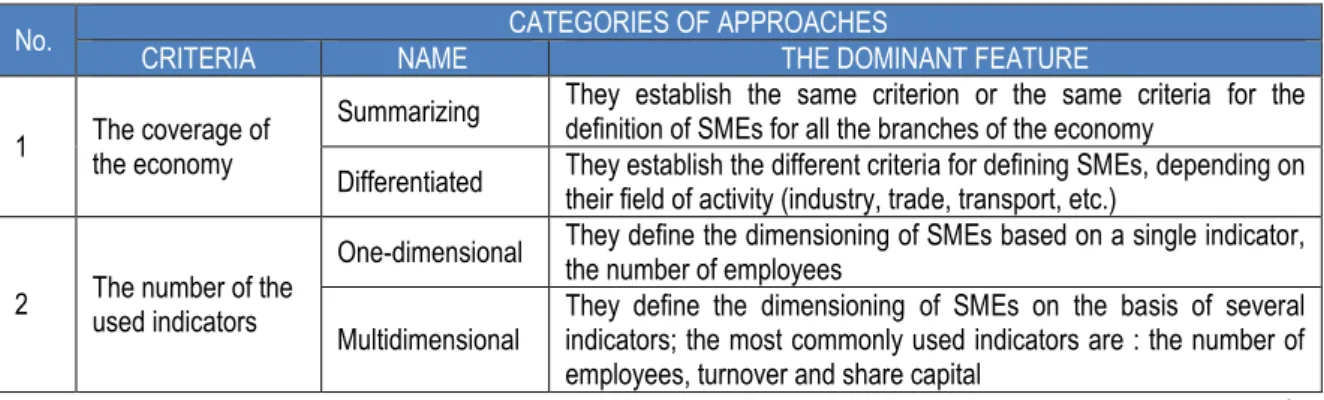
Authors of regional marketing concept as a one's own new marketing discipline think, that regional marketing is independent at company marketing or non-profit marketing, even though regional marketing is proceeding from these two marketing fields. This approach to regional marketing is also preferred in Meyer (1999). Very important part of regional marketing is communication, which is not meant as a marketing communication, but communication between marketing actors together (internal) and between marketing actors and potential customers (external). Some differences between company marketing and regional marketing are described in Table 1. (Ježek 2010)
Table 1 - Some differences between company marketing and regional marketing
CRITERIA COMPANY CITY
Place character Mobile Immobile
Place of sale Independent on region Dependant on region
Main goal Profit maximization Public demand satisfying and achieving set goals
Time period Middle-termed and shot-termed Long-termed
Transaction relations' complexity Small (comparing with city) Bigger, complex
Supplied products amount Smaller amount Big amount
Participant Marketing department's employees (few) Many participant (Participative management needed) Customers Smaller amount, bigger homogeneity Bigger amount, needs', wishes' and interests' differences
Decision making Plurality Not necessary Necessary
Entrepreneurial risks Relatively high Relatively low
Flexibility and adaptability possibility
against external environment Relatively high Relatively low
Source: Own elaboration according to Ježek (2010)
Regional marketing in the Czech Republic has some significant differences, like administrative-territorial centralization in terms of competences and financial resources, distrust between public and private sectors, dominance of strategic planning to the detriment of marketing concepts, lack of finance for the accomplishment of regional marketing, shortage of transparency in the strategies of regional development, overall immaturity of institutions and sceptical attitude to the innovations on the one hand, non-critical acceptance of vogue conceptions on the other hand.
Some interesting examples of usage regional marketing such settlement branding presents Kadár (2014), or place branding by Petrea (2013), or image of tourist brand described by Stăncioiu (2011).
History of regional marketing
With development of company marketing in last 50 years is also spread its utilization out of entrepreneurial sphere to non-profit organizations, but also to villages and cities, then we are speaking about city marketing, and to bigger spatial areas like micro regions, counties, states, where is described as regional or regional marketing. The first facts about regional marketing could be founded between 1970 and 1980 in high developed west European countries.
It is apparent that wide utilization of regional marketing did not appear as a bolt form the blue. Regional and municipal marketing constitute one of the consequences of immense social and economic transformations that took place between 1970 and 1980 in virtually all developed countries and are succinctly describable as the move from fordist paradigm of societal development towards post-fordist one. Emphasis on individual responsibility and activity, limitation of the state interventions into the functioning of market mechanisms or the creation of stimulating milieu for the activities of private subjects became the main principles of these times. (Sucháček 2008)
In the Czech Republic was regional marketing developed after Velvet Revolution in 1989. Pioneers of city and regional marketing were in the Czech Republic consulting companies like Berman Group, DHV and regional development agencies as well. With Czech borders opening there is very intensive transaction of information and sharing good practise from states, which are more experienced with regional marketing utilization for a long time, like Great Britain, Germany or the Netherlands.
Regional marketing theory
In the regional marketing we are using parts of strategic marketing management, which are situation analysis, vision and goal setting, strategy, action, controlling and organization. (Ježek 2010)
The task of situation analysis is to describe nowadays starting position of region. For making a description, is used regional marketing mix of 7 Ps, SWOT Analysis or other methods. The information for situation analysis is reached from primary (marketing research) as well as secondary sources (statistics, public databases) or by experts. The situation analysis is almost provided by external consulting companies.
During vision and goal setting there is important orientation to real goals that are corresponding with managerial principles of setting goals. The well-known is SMART methodology. It is very often situation that regions want to support all its areas, instead of setting basic priority and focusing on them. In past there were only a lack of care on strategy, but today setting strategy is obviously providing by external companies, which are constructing them with reflex to groups of interest wants. Interesting groups often cannot agree with one strategy. In the marketing campaign there is set, which are the focus groups within the strategy
Actions are in the regional marketing implemented with communication tools to affect goal group. To make a successful action, it is important to find an agreement of as high number of participants participating on marketing campaign as possible. Forgotten part of marketing strategy implementation is often controlling. Process of controlling is consisted of three steps, which are standards' setting, performance measurement according to standards and standard deviations' corrections. Effective controlling only can present, if our financial expenditures were invested effectively for the campaign or not.
Organization in regional marketing is not every time full-institutionalized, but nowadays there is in the Czech Republic marketing campaign leader is almost regional development department or tourism department at Regional Office. The controlling during the campaign is also in its competence.
Application of regional marketing
Process of regional marketing implementation has (Sucháček 2008) four basic phases: for entering phase (Initiation and motivation) are typical examples like: Initiatives come from interesting groups, city or regional government, inhabitants or external consulting company. Obviously, there is a circumstance of unsolved problems and a consequence of experienced imperfections and unsolved problems. It is important to motivate partners for cooperation. We can organize introducing conference or present elementary networking. There is important to provoke an interest of partners and motivate them to collaboration.
Analytical phase consists in collecting of finished documentation (spatial plans, strategic plans, spatial data etc.) and complex spatial analysis (obviously made by external consulting company. Another step is to collect facts should be transferred into SWOT analysis. The outcome is competitive advantages analysis and seeking for market position on the one hand and missing to external area on the other hand.
In conception phase are defined visions, goals and preparing of suitable strategies for realization. We have to focus on participative priority selection in the communication and creativity processes. There is cooperation between public and private sector subjects. Realization phase is a finishing of our preparations. Working groups of professionals (experts, government employees, entrepreneurs, public initiatives) participate at transforming goals and strategies are into concrete marketing actions. There are some rules: to prefer our own actions instead of actions, where are coordinated with more participants, a principle “rather now, than later“, cheaper actions instead of more expensive, actions and projects with regional marketing utilization for a long time, like Great Britain, Germany or the Netherlands.
Customer satisfaction in regional marketing
Utilization of Customer Satisfaction Measurement in the field of regional marketing is almost never mentioned in the books dealing with regional marketing. Key definition of customer satisfactions could be this: Satisfaction is a tool for retention of customers. This is a customer´s agreement between expected and gained value. We can define satisfaction as a subjective feeling of customer about saturating his or her needs and wishes. These are determined by experiences, expectations as well as personality and environment.
The basic idea why to measure customer satisfaction is described in enclosed figure, where we can see two possibilities of dissatisfy customers: some of them escape our business and never come back and the rest of them try to comply our staff but also to them relatives and friends, which makes a bed promotion for our business. On the other hand, satisfied customers are loyal for longer time and do repeated purchases in business.
Source: Own elaboration according to Homburg (1999)
Figure 1 - Possible customers' reactions at their satisfaction or dissatisfaction
If we shall really understand customer satisfaction and its reflection in potential company profit, we have to penetrate deeper to issues of customer satisfaction and to discover, the share of completely satisfied customers, substantially satisfied, rather satisfied, rather dissatisfied, substantially dissatisfied and completely dissatisfied. Different level of customer satisfaction has an impact on their loyalty to company and company economic outcomes. (Lošťáková 2009)
We have to notify, that dissatisfied customers are for the enterprise also important, because cost of gaining new customers are much higher, than retention of current customers. If there is a dissatisfied customer, who we left, there is a lot of economic consequences for business, firstly of all lower company profits (Lošťáková, 2009).
There are many tools for satisfaction measurement, almost using scales to mark the satisfaction like Customer Satisfaction Index, European Customer Satisfaction Model, Importance-Satisfaction Matrix, SERVQUAL Concept KANO Model, semantic differential scale or Likert scale. Alternative ways to customer satisfaction presents also. (Zamazalová 2008)
Very efficient one is a called Satisfcation Pyramid, which based in two main approaches (models), how to explore customer satisfaction. (Sadílek 2012)
First model measures two things: customer satisfaction on the one hand, and customer's declared importance of
each asked factor on the other hand. This method was more often in past. The biggest problem is respondents do not know how to evaluate the importance of factor on his/her own, and during personal interview to ask every respondent for telling satisfaction as well as importance is time consuming. The positive of the method is less complicated elaboration and presenting of outcomes. This is also called “declared importance”. The second model does not investigate both variables (satisfaction and importance), but only satisfaction with each factor. For detecting an importance of factors we use correlation analysis. Second approach can reveal incongruity between respondent's declared significance of partial factors and their real significance. The incongruity can be intentional (respondents claim something different, then they are really thinking), or they cannot notify their attitudes. Correlation analysis uses Pearson correlation coefficient (R) giving a value between -1 and 1, which measures strength of linear dependence between two variables. If the value of Pearson correlation coefficient goes to -1 (negative correlation, negative linear dependence), it means, while values of the first variable sink, values of the second variable grow. Positive correlation (positive linear dependence) comes when value of R goes to 1 and then values of both variables are growing. If the value of R moves around 0, both variables are variables linear independent and they do not influence mutually. The way how to describe outcomes from satisfaction pyramid method or other methods is to count the data into Customer Satisfaction Index. For calculating the level of satisfaction of each factor, there were used generally accepted pattern of Customer Satisfaction Index (CSI) with these variables (Fornel 1996):
εj=
∑
i= 1 n vij⋅ xij z∑
i= 1 n vij (1)where: ej - Customer Satisfaction Index of j customer; vij - weight of i- measurable variable for j-value; xij - value of measurable variable; z - number of levels used in the scale; n - number of measurable variables.
First experiences with Customer Satisfaction Index have came from Sweden, where it is called Customer Satisfaction Barometer (author is prof. Fornel) since 1989. Since 1992, in Germany has been Customer Satisfaction Barometer used and after 1994 have been developed American Customer Satisfaction Index, which followed countries like Israel, Taiwan and New Zealand. France started with measurement in 1996 and afterwards European Commission launched a study to make an index based on experiences from national experiment. The outcome was a recommendation for European countries (Ryglová 2010).
3. Results and discussion
To support theoretical findings about regional marketing and satisfaction measurement, let's present an example of satisfaction measurement application. Using the technique of satisfaction measurement is quite frequent abroad, but in the Czech Republic is not used so often, but this series of researches were successful. Methodological framework
Using the technique of satisfaction measurement is quite frequent abroad, but in the Czech Republic is not used so often. The example of successful applications could be this project. In 2010 there were started an extensive project in order to detect visitors’ satisfaction in particular regions of the Czech Republic. The research carried out Ipsos Tambor to order of Czech Tourism agency with the financial support of European Union Programs: IOP no.01358 and IOP no.01360. (More information is available at: http://monitoringczechtourism.cz/ CzechTourism/uvod.html)
The research maps turnout in particular tourist areas and regions in the Czech Republic and focuses on discovering of visitors’ structure, their satisfaction with tourism, ways of spending free time, area equipment, services quality and interest of future visiting the region. The survey has been realized since 2010 to 2014 twice every year in winter and summer. Up to now there are at disposal outcomes from winters and summers from 2010 and 2014.
There is used a method of random sample of only domestic visitors. The technique is a standardized questionnaire consisting of 23 questions, number of respondents oscillated from 25,200 to 26,500 (further information is available at: http://monitoring.czechtourism.cz/CzechTourism/res/Metodika.pdf). From these outputs are calculated statistics presented in the article. So this is type of secondary data research.
The goal of the research is to present, how is regional marketing and measurement of visitors’ satisfaction in the Czech Republic used. Research question of the study are:
How intensive is utilization of visitors’ satisfaction in regional marketing?
What are the main factors which visitors evaluate by highest satisfaction?
How CSI (Customer Satisfaction Index) has been developed since 2010 till 2014? Customer satisfaction and loyalty in Moravian-Silesian region
Moravian-Silesian region let made long-termed marketing research on visitors’ behaviour, preferences, satisfaction, loyalty and a feedback of successfulness of realized marketing techniques. The outcomes from the research are also used at defining changed marketing strategy for further years. This marketing research has been ordered at Ipsos Tambor research agency.
The method of collecting data was CATI (Computer Assisted Telephone Interviewing); the tool was structured questionnaire and the sample were above 2200 customers visited Moravian-Silesian region in last 12 months. The responding was every time in autumn after ending winter and summer season between years 2010 and 2014. The part of structured questionnaire used at doing phone interviews consists of 29 questions related with satisfaction measurement, which are factors affecting total satisfaction.
Source: Own elaboration
Figure 2 - Location of Moravian-Silesian region within the Czech Republic
Very positive finding of the research is really high level of satisfied visitors. In 2010 there were 92% satisfied, in 2011 was 98% of respondents were satisfied, in 2012 the number of satisfied visitors was 98%, in 2013 was 96% and in 2014 was 98%. This is a positive finding, which proves, that almost every visitor was satisfied with his or her stay in Moravian-Silesian region.
Table 2 - Distribution of total satisfaction
(%) 2010 2011 2012 SHARE 2013 2014
Very satisfied 53 56 53 51 72
Rather satisfied 39 42 45 45 26
Rather dissatisfied 7 2 2 4 2
Very dissatisfied 1 0 0 0 0
Source: Own elaboration according to research outputs
In the 29 factors affecting total satisfaction were factors like landscape attractiveness, information about region and tourist and cyclist signage evaluated with the highest values of satisfaction in all years. The reason is clear – visitors are looking for attractive landscape, which is in Moravian-Silesian region represented by Jeseníky and Beskydy mountains and there are also (with Ostrava city) the most visited parts of the region. Information about region is needed one condition to attract potential visitors and offer them wide range of services. The importance of information about region is after visitors' arrival when they have to change their planned program*(e.g. because of weather) and find other solution.
Tourist and cyclist signage has in the Czech Republic long tradition and achieve a high quality level. In every year research respondents indicate highest importance with factors declared highest satisfaction.
In 2013 and 2014 were factors with the highest level of satisfaction staff friendliness and cleanness of public area. Visitors evaluated very positively dining and buying options as well as staff willingness in accommodation, restaurants and information services.
Table 3 - Main factors with the highest satisfaction
2010 2011 2012 2013 2014
Landscape
attractiveness Landscape attractiveness Safety Friendliness Cleanness Health environment Information about region Landscape attractiveness Tourist and cyclist signage Dining options Information about region Tourist and cyclist signage Friendliness Safety Tourist and cyclist signage Attractive tourist paths Friendliness Information about region Buying options Buying options Tourist and cyclist
signage Safety Tourist and cyclist signage Cleanness Staff willingness
Trend of Customer Satisfaction Index growth since 2010 till 2014 is described by Figure 3, where we can see increasing trend in the value of CSI in Moravian-Silesian region, when in four years raised 86% in 2010 to 92.5% in 2014, which is in total upswing of 6.5%. And in comparison with other Czech regions in 2010 the value was a bit upper-average, but in 2014 satisfaction was under-average. Council of Moravian-Silesian region reflects on this situation by changing strategy of tourism and supports it by new marketing techniques.
Table 4 - Customer Satisfaction Index (CSI)
(%) 2010 2011 2012 2013 2014 Average
Moravian-Silesian region 86 88.5 88.76 86.75 92.5 86.0
Change 0 2.5 -0.75 -1.0 5.75 1.3
Source: Own elaboration according to research outputs
This trend is also described by linear regression line with its equation, which expresses positive growing trend since 2010 till 2014. In only two years, 2010 and 2013 were values of CSI very close to average value of 86%.
Source: Own elaboration according to research outputs
Figure 3 - Trend of Customer Satisfaction Index
All these findings mean, that visitors in Moravian-Silesian region were very satisfied with their visits and during interviewing they appraised by high evaluation. Further step would be to discover, if their satisfaction influences repeated visit of the region.
Discussion
In the discussion part, evaluation of research questions has been done with following outcomes: First research question was “How intensive is utilization of visitors’ satisfaction in regional marketing?” In the Czech Republic in last 10 years was rising number of examples of utilization of visitors’ satisfaction in case of tourist satisfaction and also measurement of inhabitants’ satisfaction. Some other cases were used in Czech cities such Ostrava or Český Těšín.
Answer for research question “What are the main factors which visitors evaluate by highest satisfaction?” means, that these factors are safety, friendliness, landscape attractiveness and tourist and cyclist signage, which plays very significant role in the Czech Republic, because Czech is famous for high quality of its tourist and cyclist signage. For public policy makers is important to improve factors with lower level of satisfaction and take care of factors with high importance. Third question “How CSI (Customer Satisfaction Index) has been developed since 2010 till 2014?” is proved by Figure 2, where rising trend since 2010 till 2014 is visible. This is described by regression function and comparing years 2010 and 2014, average value of Customer Satisfaction Index ascended from 86% to 93%.
Public authorities can use these finding in formulation strategies for further period and based on these outputs they can do deeper analysis, what are areas which they have to focus on. Besides presented methods of
86% 89% 89% 87% 93% y = 0,012x + 0,852 R² = 0,5 82% 84% 86% 88% 90% 92% 94% 2010 2011 2012 2013 2014 Value of CSI Trend of CSI
customer satisfaction measurement, exists other methods which are more or less used such Balanced Scorecard or benchmarking. More detailed information about these methods is in Půček (2014a) and Půček (2014b).
Conclusion
The main contribution of the article is a description and utilization satisfaction measurement as a one of marketing techniques in the field of regional marketing, which is until now not very used in the Czech Republic. There are presented contemporary information about regional marketing, its theory, history and applications. Presented methods of satisfaction measurement are suitable for practical use and there are also used in the project of visitors' satisfaction measurement in Moravian-Silesian region. Even though, regional marketing has still more important role in the regions and countries, it is not implemented as a complex approach to managing these spatial areas (like in companies), but almost only same chosen methods and techniques. Very important output or regional marketing is also to set marketing strategy to address potential visitors.
The main findings of presented research example in the field part of article are distribution of total satisfaction, factors with the highest level of satisfaction and also sinking trend of visitors' satisfaction in last three years.
Acknowledgement
The article has been supported by project IGA "Analysis of quality labels utilizations on the Czech foodstuff market and efficiency of campaigns for their support", No. F2/94/2015".
References
[1] Fornell, C., Johnson, M.D., Anderson, E.W., Cha, J., Everitt Bryant, B. (1996). Growing the trust relationship [Electronic version], Journal of Marketing, 60(4): 7-18. Retrieved [February, 2016], from Cornell University, School of Hospitality Administration site: http://scholarship.sha.cornell.edu/articles/431/
[2] Fortenberry, J.L. (2012). Nonprofit Marketing, Burlington, MA: Jones.
[3] Homburg, Ch., Giercing A., Hentschel, F. (1999). Der Zusammenhang zwischen Kundenzufriedenheit und Kundenbindung, Die Betriebswirtschaft, 59(2): 174-195.
[4] Ježek, J. (2010). Aplikace městského marketingu v praxi: vývoj, očekávání, realita (kritický pohled), E+M
Ekonomie a Management, 4: 123-134.
[5] Kadár, M. (2014). The Settlement Branding. Case Studies on City Branding in Transylvania, Transylvanian
Review of Administrative Sciences, 10(SI): 55-69.
[6] Kutscherauer, A. (2006). Regionální a municipální management. Souhrnná výzkumná zpráva, Ostrava. [7] Lošťáková, H. (2009). Diferencované řízení vztahů se zákazníky. Praha: Grada Publishing.
[8] Meyer, J.A. (1999). Regional marketing, München, Verlag Franz Vahle.
[9] Petrea, R., Petrea, D., Olau, P.E., Filimon, L. (2014). Place Branding as Efficient Management Tool for Local Government, Transylvanian Review of Administrative Sciences, 9(SI): 124-140.
[10] Plaček, M., Půček, M., Jetmar, M. (2014). Collaborative benchmarking of municipalities in the Czech Republic – current experience, The NISPAcee Journal of Public Administration and Policy.
[11] Půček, M., Špaček, D. (2014). Strategic public management – selected experiences with BSC implementation,
Transylvanian Review of Administrative Sciences, 10(41): 146-169.
[12] Rumpel, P. (2002). Teritoriální marketing jako koncept územního rozvoj, Ostrava: Ostravskáuniverzita. [13] Ryglová, K., Machalová, J., Vajčnerová, I. (2010). The specification of consumer satisfaction intourism with
the use of geographic IT tools, Acta Universitatis Agriculturae et Silviculturae Mendeleianae Brunensis, 58: 433–444. DOI: http://dx.doi.org/10.11118/actaun201058060433
[14] Sadílek, T. (2012). Students Satisfaction with the Study Programme of Adult Education at University of Ostrava and Tomas Bata University in Zlín, Littera Scripta, 5(2): 15-25.
[15] Spáčil, V., Tvrdý, L., Martiník, I. (2003). Hodnocení spokojenosti se studiem na EkF VŠB – TU Ostrava,
[16] Stăncioiu, A.F., Theodorescu, N., Pârgaru, I., Vlădoi A.D., Băltescu, C. (2011). The Image of the Tourism Destination – a Supporting Element in the Development of the Regional Tourism Brand Study Case: Muntenia,
Theoretical and Applied Economics, Volume XVIII, 2(555): 139-152.
[17] Sucháček, J. (2008). Territorial marketing in the Czech Republic: a trial - and – error process, Paper presented at 48th Congress of the European Regional Science Association, Liverpool, UK.
[18] Zamazalová, M. (2008). Spokojenost zákazníka, Acta Oeconomica Pragensia, (4): 76-82. DOI: 10.18267/j.aop.135
Fractal Analysis of Moroccan Dirham Exchange Rate: Theory and Comparative
Results
Amine AMAR Faculty of Sciences Rabat, Department of Mathematics and Computer Science
University Mohammed V-Agdal2, Maroc
Imane El WAHLI Faculty of Sciences Rabat, Department of Mathematics and Computer Science University Mohammed V-Agdal, Maroc
Zine Elabidine GUENNOUN Faculty of Sciences Rabat, Department of Mathematics and Computer Science University Mohammed V-Agdal, Maroc
Youness LAAROUSSI Faculty of Sciences Rabat, Department of Mathematics and Computer Science University Mohammed V-Agdal, Maroc
Abstract:
Given the central position occupied by the exchange rate and its important role in terms of equilibrium of the supply of and foreign currency demand, its analysis appears among the most active areas of economic research. In this regard, researchers were developed several parametric and non-parametric approaches to model exchange rate behavior. Among these methods, we are particularly interested to fractional Brownian motion (fBm) to model the complexity of used series. The main step of this model is the estimation of Hurst index, which plays a very important role in the research of processes with self-similarity proprieties.
In this paper, we analyze firstly, the evolution of two important series of exchange rates which have a significant impact on the Moroccan economy. In the second, we carry out a comparative analysis of the Hurst exponent statistical properties, using geometrical, temporal, spectral and multi-scale analysis estimation methods. The choice of the efficient method is evaluated in terms of robustness and efficiency.
Keywords: exchange rate, fractal, fractional Brownian motion, Hurst exponent. JEL Classification: C13, C14, C15, C60, E52, F31.
1. Introduction
Exchange rate has been one of the most active areas of economic research over the last years. It occupies a central position in monetary policy, where it may serve as a target or a key macroeconomic instrument. This indicator may be actively managed, in conjunction with other components of monetary policy, with the aim of achieving desired objectives in the areas of inflation or balance of payment. To achieve these goals, monetary authorities can adopt diverse exchange rate regimes. Morocco, for example uses a fixed one, since April 25, 2001. Due to the importance of exchange rate, several theoretical and empirical studies were established with aim the monitoring and the high accurate and precise modeling of the exchange rate evolution. In this context, the objective of this paper is twofold: on the one hand, we analyze and examine the evolution of two important series of exchange rate which have a significant impact on the Moroccan economy, namely “Euro/MAD” and “Dollar/MAD”. On the other hand, we exploit the concept of fractal analysis for measuring the complexity of those series. To achieve this, we present the daily evolution of exchange rate series (Euro/MAD) and (USD/MAD) in the second section. The third one describes briefly fractional Brownian motion and fractal dimension concepts. The empirical estimates are discussed in section four. The paper ends with results and discussions.
2. Presentation of the Data. Exchange rate Series
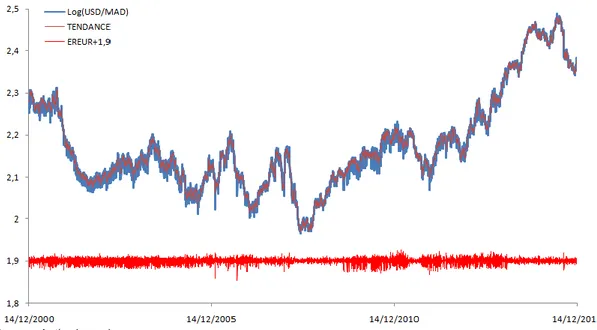
Source: OANDA (www.oanda.com)
Figure 1 - Daily evolution of exchange rate series (Euro/MAD) and (USD/MAD)
In this paper, we consider the series of daily values of exchange rate (Euro/MAD) from December 14, 2000 to December 14, 2015. This provides us two-time series of 5,479 observations in each one, as shown by Figure 1. The Figure1 exhibits that the behavior of the Dirham vis-à-vis the Dollar and the Euro has mitigated effects. Overall, the exchange rate Dollar/Dirham has an erratic behavior, contrary to a nominal exchange rate of the Dirham against the Euro, which remained relatively stable. Despite the erratic fluctuations of Dollar/MAD and slow fluctuations of Euro/MAD, the inflation, which is economically impacted by exchange rate variations, has been contained below 2% (Ezzahid and Maouhoub 2014). This is thanks to the implementation of prudent monetary policy in one hand, and because secondly, of the support of rising oil prices in part by the State.
In the start of the analyzed period, we remark that the evolution of the national currency (Dirham) was largely influenced by the behavior of the Dollar and Euro given their preponderance in the basket of quotation of the Dirham. Thus, in the end of 2000 the Euro depreciated against the Dollar, the Dirham depreciated against the US Dollar and, conversely, has appreciated against the Euro. In April 2001, the Moroccan Dirham was devalued by 5 percent in nominal terms. Ensuing fixed exchange rate policy, pegging the Dirham to a publicly undisclosed basket where the Euro has a much larger weight than the Dollar. Since 2001, a recurrent feature of the real exchange rate has been shown a small variability and mild depreciation-both in price and in labor cost terms-which has been favorable for exports and growth (World Bank 2006). As a result, exports have gained some dynamism, showing growth rates in double digits, both in 2003 and 2004.
More recently Morocco’s currency appreciated relative to its main competitor in Dollar-zone markets. In fact, no less than 10 percent from the real appreciation of the Euro compared with the Dollar in 2005.
According to IMF reports, the analysis of the dynamics of the real exchange rate equilibrium, during the 2006-2011 period (Fadlallah et al. 2014), suggests three distinct periods of over or undervaluation. In fact, in 2006, the real effective exchange rate of the Dirham was undervalued, relatively to its equilibrium level. The trend was being reversed and the Dirham was in balance in 2008, despite a marked slowdown as results of outbreak of the financial and economic crisis and also of the risks to macroeconomic stability. In fact, the Moroccan economy seemed to better cope with the so-called crisis. This is thanks to the implemented instruments, adopted by the Moroccan government, notably the fixed exchange rate regime. After that, the trend reversed and the Dirham was undervalued during 2009-2011. In the end of the analyzed period, the Dirham in total, is depreciated against the Euro and appreciated vis-à-vis the Dollar.
As mention in (Guasoni et al. 2008) and (Black and Scholes 1973), prices can be described as exponential of the sum of a regular process and a stochastic process (because they are non-negative).
X(t) = exp(f(t) + Y(t)) (2.1) Equivalently equal:
log(X(t)) = f(t) + Y(t) (2.2)
Where the functionf(t) corresponds to the regular part and Y(t) is a stochastic process which can be deduced by estimatingf(t) as the moving average of Log(X(t)) on a centered sliding window and subtracting it tolog(X(t)), see Figure 2 and Figure 3.
Source: Author’s work
Figure 2 - Logarithm of daily observation of “Euro/MAD”, low frequency part “trend” and high frequency part “residual” (plus constant)
Source: Author’s work
Figure 3 -Logarithms of daily observation of “Dollar/MAD”, low frequency part “trend” and high frequency part “residual” (plus constant)
3. Fractal dimension, fractional Brownian motion and their application in finance
This part contains three sections, the first one, is devoted to the presentation of the fractal process and their properties, namely the self-similarity and fractal dimension. In the second section, we define the fractional Brownian motion, noted fBm and, we'll show how to simulate it and how to estimate the Hurst parameter.
3.1 Fractal dimension
Many natural phenomena are better described using a dimension between two whole numbers, i.e., a fraction. Thus, a fractal curve can have a dimension between one and two in contrast to the straight line that is one dimensional. The fractal dimension measures how much complexity is being repeated at each scale. It can be used also as a measure of roughness, and in opposition to the long memory characterization, it measures the local memory of the series (Kristoufek and Vorvsda 2013) and (Kristoufek and Vorvsda 2014).
According Hausdorff, the fractal dimension is defined to be the unique value:
d = dimH(X)inℝ0+⋃{∞}suchthatμd′(X) = 0ifd′> 𝑑𝑎𝑛𝑑μd′(X) = ∞ifd′ < 𝑑. (3.1)
Where:
μd(X) = liminf(Ui)
ε→0
∑ (diam(Ui i))d (3.2)
Is a d-dimensional Hausdorff measure of a subset X in a metric space? The infinimum is taken over all countable
covers Ui of X such that diam (Ui)<ε(Laaroussi et al. 2015).
3.2 Self-similarity
A self-similar phenomenon represents a process displaying structural similarities across a wide range of scales of a specific dimension. In other words, the reference structure is repeating itself over a wide range of scales of diverse dimensions (geometrical, statistical or temporal), and the statistics of the process did not depend on scale (Laaroussi et al. 2015).
However, these properties do not hold indefinitely for real phenomena and, at some point, this structure breaks down. Self-similarity can therefore be associated with fractals, which are objects with unchanged appearances over different scales. Examples of geometrical fractal processes are the Cantor set, Sierpinski triangle, Koch curve, etc. In the case of statistical fractals, it is the probability density that repeats itself on every scale, like for instance as found in economics (Pareto’s law), in linguistics (Zipf’s law) and in sociology (Lotka’s law). On the other hand, a dynamical fractal is generated by a low-dimensional dynamical system with chaotic solutions, as it happens in biology (Willis law) and in medicine (cardiac spectrum) (Zohuri, 2015).
Statistically, a stochastic processes 𝑋 = (𝑋𝑡, 𝑡 ≥ 0) taking values on ℝ is said to be self-similar if for
anya ≥ 0, there exist b(a) ∈ ℝ such that
(Xat, t ≥ 0) ≡ (b(a)Xt, t ≥ 0) (3.3)
With (≡) signifies equality in distribution.
In (Lamperti 1962), it is proved thatb(a) can be expressed as(a) = aγ, whereγ ≥ 0. Hence the definition
of self-similar processes becomes:X = (Xt, t ≥ 0)is self similar, if for any a ≥ 0, there exist γ > 0 such that:
(Xat, t ≥ 0) ≡ (aγXt, t ≥ 0) (3.4)
3.3. Fractional Brownian motion
3.3.1. Definition and proprieties
In the pioneering work by Mandelbrot and van Ness (Mandelbrot and Van Ness 1968), fractional Brownian motion is defined by its stochastic representation:
BH(t) = 1 Γ(H+12)(∫ [(t − s)H−1 2 ⁄ − (−s)H−1 2⁄ ] 0 −∞ dB(s) + ∫ (t − s)H−1 2⁄ dB(s) t 0 ) (3.5)
WithΓ represents the Gamma functionΓ(α) = ∫ x∞ α−1
0 exp(−x) dxand 0.5 < H < 1is called the Hurst index
from the statistical analysis, developed by the climatologist Hurst (Hurst 1951), of the yearly water run-offs of Nile river.The fractional Brownian motion is completely defined by its covariance function, given by:
Cov(BtH, BsH) =21(|t|2H+ |s|2H− |t − s|2H), t, s ∈ ℝ. (3.6) And it has the following properties:
−BH(t)has stationary increments;
−BH(0) = 0, and 𝔼(BH(t)) = 0, ∀t ≥ 0; −𝔼(BH2(t)) = t2H for t ≥ 0;
−BH(t)has a Gaussian distribution for t > 0.
−BH(t) is a self similar process, i.e. ∀a≥ 0, ∃γ > 0 such that: BH(at) ≡ aγB
H(t).
From the Eq. (3.6) of the covariance function, we deduce that fractional Brownian motion is characterized by the presence of long-term correlations, when H is different from 0.5. So we can distinguish three cases, the first one illustrates the short memory (no long memory) when H=0.5 (the fBm is a standard Brownian motion). H<0.5 If the auto-covariance of the increments of fBm is negative, so the increments of fBm have opposite signs. Such fBm is called anti-persistent, i.e. an increase of the variable tends to be followed by a decrease and vice-versa. Conversely, if H>0.5, this indicates persistence phenomena (long memory), i.e. the evolution of the series tends to follow trends, in the manner that if the series has increased earlier, so there is a high probability that it continues to do so.
3.3.2. Simulation of fractional Brownian motion
Since few theoretical results and properties are known about fractional Brownian motion, it is important to know how this process can be simulated. Several simulation methods have been proposed. While some of these methods are fast enough, fastness compromises accuracy in most cases. In fact, it is hard to capture all aspects of fBm numerically due to its fractal character.
The only exact method to simulate an fBm would be to generate a Gaussian vector 𝑋(𝑡1), … , 𝑋(𝑡𝑛)through Cholesky decomposition of its covariance matrix. Clearly, this approach is impractical
for large sizes due to its complexity and memory requirement. An approximate, but very fast approach is the random midpoint displacement method (lau et al. 1995). It consists to subdivide an interval recursively and constructs the values of fBm at midpoints from the values at end points. We can evoke also fast Fourier transform (FFT) and Wavelet synthesis of fBmas alternative methods for simulation of fBm (Wornell 1990).
3.3.3. Estimation of Hurst index
After simulation of fBm process, estimating of the Hurst exponent for experimental data plays a very important role in the study of this type of processes. In this section, we briefly describe the main parametric methods to estimate the self-similarity parameter which can be classified into four categories:
Methods based on the properties of the fractal geometry: Box-counting method;
Time Domain based Analysis: Rescaled range (R/S) method and Generalized Quadratic Variation (GQV)
Estimator;
Frequency based Analysis: log-periodogram, a variant of Lobato and Robinson’s method;
Methods based on a multi-scale analysis: wavelet decomposition of the fBm.
Methods based on the properties of the fractal geometry
Geometrical methods are based on fractal dimension estimation. Many formulas have been developed, principally, box-counting dimension defined as follow:
dimB(F) = lim
δ→0
logNδ(F)
−logδ (3.7)
In practice, we use box counting algorithm, which is intuitive and easy to apply.Given a sequence (εn)
decreasing and tends to 0 slowly enough (as a geometric sequence, for example). The fractal object (E) is covered
with a mesh network square of side (εn), and includes the number (Ωn)of square meeting point E.
The fractal dimension is then: D(E) = lim
n→∞[
log(Ωn)
log(εn1)] (3.8) The corresponding log-log diagram is defined as:
1 log ,log n n For different value ofεn, we find the numberΩn. After this we represent this plot, and we extract the fractal dimension as the opposite of the slope (Laaroussi et al. 2015). For a univariate series, it holds that 1 < D ≤ 2. In general, D = 1.5 holds for a random series with no local trending or no local anti-correlations. For a low fractal dimension D < 1.5, the series is locally less rough and thus resembles a local persistence. Reversely, a high fractal dimension D > 1.5 is characteristic for rougher series with local anti-persistence.
Time Domain based Analysis: Rescaled range (R/S) method and Generalized Quadratic Variation (GQV) Estimator
Rescaled range (R/S) method
The Hurst exponent can be calculated by rescaled range analysis (R/S analysis), proposed by Mandelbrot to inspect the long memory for financial time series. It should be noted that the use of R/S analysis is not restricted to finance domain. It is extended to several research fields like earthquake prediction, stock market indices and, runoff time series and stream networks in Agricultural Watersheds. (Cheng et al. 2013)
To define R/S statistic, let us consider a time series {𝑋𝑡} of the sample of length Twhich is divided into 𝑘
intervals of length n (n ∗ k = T), and the average of 𝑛 series observed values is𝑋̅𝑛 =𝑛1∑𝑛 𝑥𝑖
𝑖=1 . The range of
each subinterval is defined asR(n) and the standard deviation as𝑆(𝑛). Take the statistical R/S:
Qn= R(n)/S(n) (3.9)
The range 𝑅(𝑛) and the standard deviation 𝑆(𝑛) are respectively:
R(n) = max1≤k≤n[∑ (xkj=1 j− x̅n)] − min1≤k≤n[∑ (xkj=1 j− x̅n)] (3.10)
S(n) = [1nmax1≤k≤n[∑ (xk j− x̅n)2
j=1 ]]1/2 (3.11)
We can prove thatP lim
n→∞(n −HQ
n) = C,C is a constant and H is Hurst exponent. So can get approximate
estimateH,H = ln(Qn) /ln(n).
In general, the R/S analysis method is described as follows:
(R/S)n= C. nH (3.12)
Where R is rescaled range and S is a standard deviation. We introduce logarithm on Eq. (3.12):
log(RS)n= log(C) + H. log(n) (3.13)
The Hurst exponent H is the slope obtained after a linear regression of ln(𝑄𝑛) on ln(𝑛)
Generalized Quadratic Variation (GQV) Estimator
Considering one path of the process X at N regularly spaced times k/N fork = 0, . . . , N − 1. For convenience, we assume that N is even. Since the Hurst index corresponds to the roughness of the path, a first idea is to measure it through quadratic variation (Bertrand et al. 2010).
VN(1)= ∑ |X (k+1 N ) − X( k N)|2 N k=1 (3.14)
Which, implies that 𝔼 (|X (k+1N ) − X (k N)| 2 ) = C ∗ (1 N) 2H (3.15)
To sum up, the mean quadratic variation corresponds to the empirical variance of the increments and by using stationary of the increments, one can deduce that VN(1) is equivalent to C ∗ (1/N)2H−1 when N goes to
infinity. And after that the estimator ĤN defined by:
ĤN =1 2(1 + log2 VN 2 ⁄ (1) VN(1)) (3.16)
converges as to H(Benassi et al. 1998). Moreover whenH ∈ [0,34], the quadratic variation satisfies a Central Limit Theorem (CLT) with rate of convergence N−1/2 (Guyon and Leon 1989) and after Ĥ
N with the same rate of
convergence (Coeurjolly 2005). WhenH ∈ [3
4, 1], the quadratic variation does no more satisfy CLT (Guyon and Leon 1989). For this
reason, it has been replaced by the generalized quadratic variations (GQV): VN(2)= ∑ |X (k+1 N ) − 2X ( k N) + X( k−1 N )| 2 N k=1 (3.17)
which satisfies CLT with rate N−1/2 (Istas and Lang, 1997) like the estimator Ĥ
N given by Eq. (3.16)after having
replaced quadratic variation by generalized quadratic variation. Let us stress that in Eq. (3.16), the quantity (2ĤN− 1) corresponds to the slope of the log empirical variance computed with the two meshes 1/N and2/N. Actually, the variance of the Hurst estimator can be reduced by using linear regression of the log empirical variance onto log of a family of p meshes j/Nj = 1, . . . , p . (Coeurjolly 2005)
Frequency basis analysis
The log-period gram approach
According (Coeurjolly 2000), this approach consists in exploiting, on the one hand, the spectral signature of the fGn (fractional Gaussian Noise)
f(λ) ∼ cf|λ|1−2Has |λ| → 0,
And on the other hand the fact that the period gram defined by:
IN(λ) =2πN1 | ∑N−1t=0 X(t)e−itλ|2,λ = λk,N=2πkN (3.18)
It should be noted that:
log𝔼(IN(λ)) ≃ logcf+ (1 − 2H)log(|λ|) (3.19)
Pointing out, the linearity in Hof log𝔼(IN(λ))in a neighborhood of 0. Let1 ≤ m1< m2≤ N∗= [N −
1/2] and define𝛼̂𝑁as the estimator deduced from the linear regression of {log(IN(λk))}m1≤k≤m2on{log(λk)}m1≤k≤m2. Thus, the estimator of the self-similarity parameter is done by:
ĤN(m1, m2) =12(1 − α̂N) (3.20)
Geweke and Porter-Hudak (Geweke and Porter-Hudak, 1983) prove the asymptotic normality for ĤN(m1, m2):
√m2
log(N)(ĤN(m1, m2) − H) → N(0, π2
6) (3.21)
(if𝑚1 and 𝑚2 satisfy√m2log(m2) m⁄ 1+ m1log2(N)/m2→ 0)
Variant of Lobato and Robinson
By denotingF(λ) = ∫ f(θ)dθ0λ , Lobato and Robinson (Lobato and Robinson 1996) remark that there exists, in a neighborhood of 0, a log-linear relation between two values ofF(λ).
Let q ∈] 0, 1[, one gets immediately, F(qλ)F(λ) ∼ q2−2H, as |λ| → 0. By estimatingF(λ k)by:
F̂(λk) =2π N ∑ I(λj) [λk,N λ k,N ⁄ ] j=1 fork = m1, … m2 (3.22)
one deduces an estimator of H:
ĤN(q, m1, m2) = 1 −2log(q)1 log{F̂(qλF̂(qλm2)
m2)} (3.23)
For 1/2 < H <3/4, Lobato and Robinson exhibit the optimal value of qvia simulations. Let us mention that if one chooses 𝑚1 and 𝑚2 as previously, one may obtain an asymptotic normality result similar to Eq. (3.21) (Coeurjolly 2000).
Methods based on a multi-scale analysis
The multiresolution wavelet analysis considered as an effective tool for a time series analysis, for which the main idea consists in the expansion of a time series on an orthogonal base, formed by shifts and the multiresolution copies of the wavelet function. The Base functions ψ(t) are named wavelets, if they satisfy a number of conditions, in particular they should be defined in place of complex-valued functions with restricted energy, which oscillate around an absciss a axis, converging rapidly to zero and having a vanishing moment of the first order. Discrete wavelet-transform (DWT) is a continuous and discrete form of wavelet-transformation consisting of a two decomposition researched series: approximating and detailing, with their successive separation for the purpose of increasing the decomposition level. Discrete wavelets are used, as a rule, together with scaling-functions connected to them. Scaling-functions with wavelets have the general definitional domain and a determined relation between values (Kristoufek et al. 2011).
For a given mother wavelet 𝜓 and corresponding scaling-function𝜑, the approximate coefficients 𝑎(𝑗, 𝑘) and detailing coefficients 𝑑(𝑗, 𝑘) are defined as follows:
d(j, k) = ∫−∞+∞X(t)ψj,k(t)dt,a(j, k) = ∫−∞+∞X(t)φj,k(t)dt (3.24) where:
φj,k = 2−j⁄2φ(2−jt − k)andψj,k= 2−j⁄2ψ(2−jt − k) (3.25)
According to the DWT, the time series is represented as the sum of detailing and approximating components:
X(t) = approxj(t) + ∑Jj=1detailj(t)= ∑ a(j, k)φk j,k+ ∑Jj=1d(j, k)ψj,k(t)(3.26)
For estimation of the Hurst exponent in applied research, the method described in (Abry 1998) is the commonly used. The mentioned method is based on the statement that the averaged squared values of the wavelet coefficients𝐸𝑗= 1
𝑛𝑗∑ |𝑑(𝑗, 𝑘)|
2 𝑛𝑗
𝑘=1 obey the scaling law:𝐸𝑗~2(2𝐻−1)𝑗where 𝐻 is the Hurst exponent. The
following equation represents the practicable method of the estimation of the Hurst exponent: log2(Ej) = log2(1
nj∑ |d(j, k)|
2 nj
k=1 ) ~(2H − 1)j + const (3.27)
Results and discussion
Exchange rate processes are always non negative and are better fitted by a log normal process. Thus, in this section, we have extracted residual part from the logarithm of (USD/MAD) and (Euro/MAD) series using the mobile average method. Then we have computed the Hurst index of the logarithm of raw series and their residuals. Thus, we have in sum multiple estimations for four resulted series. The different estimations of the Hurst index are associated to the four families of approaches:
Geometrical Methods: Box-counting method;
Temporal methods: Rescaled range (R/S) method and Generalized Quadratic Variation (GQV) Estimator;
Frequency methods: Log-periodogram, a variant of Lobato and Robinson’s method;
Multi-scale analysis: Wavelet decomposition of the fBm.
The implementation of the previous mentioned methods are realized in Matlab and R (Jennane et al. 2001).
Table 1 - Estimation of Hurst exponent Geometrical
Methods Temporal methods Frequency methods
Multi-scale analysis Box-Counting
Method Analysis R/S Estimator GQV periodogram
log-Variant of Lobato and Robinson Wavelet analysis Log (USD/MAD) 0.4029 0.8853 0.4896 0.5024004 0.4707199 0.5123 Residuals (USD/MAD) 0.4029 0.2761 0.4964 0.5021212 0.4604807 0.4982 Log (Euro/MAD) 0.4029 0.8749 0.4570 0.4990937 0.4681777 0.4848 Residuals (Euro /MAD) 0.4029 0.2688 0.4557 0.4968101 0.4614190 0.4592
Source: Provided by authors
Based on these results, we can remark first, that subtracting the regular part has no effect on the value of Hurst index. This explains that the roughness is not affected by adding or subtracting a regular function, thus, Hurst index which corresponds to roughness of the path is similar both for the studied series and their irregular parts.
Secondly, we denote that the used methods give different values of H index with remarkable differences comparatively to R/S analysis and the geometrical approach. In fact, these methods suffer from several problems; in one hand, (Lo 1991) showed that the statistic “R/S” has two major disadvantages:
It is sensitive to short memories: “R/S” statistic cannot distinguish the short-term characteristics and long-term properties of the series (in the case of finite sample).
It does not constitute a statistical test, because of its unknown asymptotic distribution.
In the other hand, the box counting method suffers from many problems related, essentially to sampling (Jennane et al. 2001). Various authors have compared the different estimation techniques. Theoretically, even if the asymptotic efficiency results are demonstrated for some estimators, there is no reason to confirm their behavior in all circumstances (reduced length of signals, noise sensitivity ...). It is therefore necessary to conduct experimental studies to better understand the potential of estimators. These studies consist to generate asynthetic fBm signal based on theoretically accurate simulations. Each technique will be evaluated in terms of bias (robustness) and variance (efficiency) (Taqqu et al. 1995) and (Jennane et al. 2001).
To determine the best fitted value of Hurst index, we referred to (Jennane et al. 2001) and (Kirichenko et al. 2011) which mention the performance of Maximum Likelihood Estimation and Wavelets analysis in terms of bias minimization. Nevertheless, it must be noted that, the results obtained in (Jennane et al. 2001) showed that the maximum likelihood estimation (MLE) is efficient only for short length signals. By contrast, (Kirichenko et al. 2011) confirm that the wavelet analysis has minimal bias. In addition, they demonstrate that the standard deviations of the estimates depend on the estimation method and decrease while the length of series increases. Basing on this ascertainment and using simulations, they found that the minimal standard deviation is obtained for wavelet estimator.
Following these considerations, we favor the wavelet analysis among the other methods and we adopt it, in our case, as the best estimator of H index for LOG(USD/MAD), LOG(Euro/MAD) and their residuals series.
Recall that, Hurst exponent (H) close to 0.5 would represent a self-determining process, in which the current value of the series would not dependent of past values of the series. According to this proposition, results for our case indicate that Hurst Exponent for LOG(USD/MAD) and LOG(Euro/MAD) are measured 0.5123 and 0.4848 respectively, which are approximately equal to 0.5.
Hence, the considered exchange markets exhibit Brownian motion of the exchange rates time series. In simple words, the both series indicate the performance of Random walk, which means that there is a no correlation between the present and future values. However, we can evoke that that the exchange rate Euro/MAD exhibit more erratic behavior than USD/MAD exchange rate. This can be explained by the monetary policies adopted by Morocco, concerning the choice of the exchange rate regime, which is characterized by a fixed regime instead the flexible one.
The characteristic demonstrated in this paper, in regard to exchange rate behavior, has a negative fallout vis à vis the competiveness of Morocco economy. As mentioned in (Ezzahid et al. 2014), the loss-function values