ĠÇĠNDEKĠLER
EARTH SCIENCES/YER BİLİMLERİ
DEDUCING THE GEOMETRY OF STRIKE-SLIP FAULTING BY RESISTIVITY METHOD
EBRU EFEOĞLU, METĠN AġÇI
1
DETERMINATION OF RESPONSE OF 3D COMPLEX VELOCITY MODELS BY USING SYNTHETIC SEISMOGRAMS
HALĠL ĠBRAHĠM ARSLAN
9
DETERMINING OF SUBSURFACE STRUCTURES BY RESISTIVITY METHOD
EBRU EFEOĞLU 16
EVALUATION OF SOURCE PARAMETERS OF SOME MODERATELY EARTHQUAKES IN SOUTH-EAST OF IRAN
MEHRDAD MOSTAFAZADEH, S. ASHKPOUR MOTLAGH 23
EVIDENCE FOR THE SEISMIC QUIESCENCE PRIOR TO THE JANUARY 25, 2005 HAKKARİ (MW=5.9) EARTHQUAKE, TURKEY
SERKAN ÖZTÜRK, YUSUF BAYRAK 34
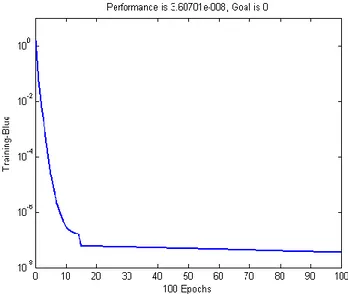
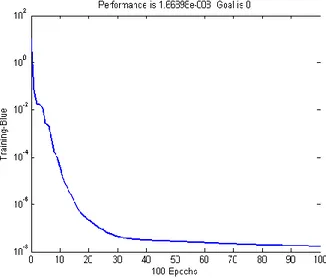
EXTRACTION OF SPATIAL CHARACTERISTIC OF EARTHQUAKE USING ARTIFICIAL NEURAL NETWORK
SHAHABEDDIN ZARRINKAMAR, M. MIRZAEI
44
FREQUENCY ANALYSIS OF CLAMPED LAMINATED COMPOSITE PLATES USING ARTIFICAL NEURAL NETWORK
UMUT TOPAL, E. ÖZTEKĠN
55
IMAGE PROCESSING OF SHARP BOUNDARIES IN 2D ELECTRICAL TOMOGRAPHY OF FAULTS
A. ASHTARI TALKHESTANI, B. ABBASSI
65
MICROZONATION STUDIES BY USING SHEAR WAVE VELOCITY: GEBZE (KOCAELİ) REGION
EBRU EFEOĞLU
70
ON MONITORING OF NEAR SPACE PLASMA PARAMETERS FOR PURPOSE OF EARTHQUAKES PREDICTION
GALENA KHACHIKJAN, T. ABAKANOV, A. LEE 73
PREDICTION OF POROSITY FROM SEISMIC ATTRIBUTE TRACES USING LOCAL LINEAR NEURO-FUZZY MODEL IN GORGAN BASIN
A. ASHTARI TALKHESTANI, M. NABI-BIDHENDI, J. JAMALI, M. MIRMOMENI
80
SEISMIC HAZARD ASSESSMENT FOR KOPEH DAGH REGION
SEISMICITY OF TEHRAN AND SURROUNDING REGIONS
FERESHTEH GOLABI, M. REZA GHEITANCHI 93
STATISTICAL PROPERTIES OF THE AFTERSHOCK SEQUENCE OF MD=5.3 ANKARA (BALA) EARTHQAUKE OF DECEMBER 27,2007
YUSUF BAYRAK, SERKAN ÖZTÜRK
98
ENGINEERING/MÜHENDİSLİK
A CASE STUDY: EFFECTS OF SELECTED MODELING PARAMETERS ON PERFORMANCE EXPECTATIONS OF BUILDINGS
ABDULLAH DĠLSĠZ, GÜLKAN
102
APPLICATION OF CAPACITY SPECTRUM METHOD FOR PERFORMANCE ASSESSMENT OF INDUSTRIAL BUILDING STRUCTURES LOCATED IN EARTHQUAKE-PRONE REGIONS IN TURKEY
B. ÖZTÜRK, M. SADAK, F. DEMĠRALAN
112
APPLYING SPAC METHOD TO DETERMINE SHEAR WAVE VELOCITY, A CASE STUDY IN MİLAD TOWER, TEHRAN
NAVIH KARGAHI, GHAYAMGHAMIAN, SADIDKHOUY, FEREYDOUNI
119
ASSESSMENT OF SYNTHETIC ACCELEROGRAMS FOR DYNAMIC ANALYSES OF STRUCTURES
YASĠN FAHJAN, AYġEGÜL ZEYTĠNCĠ, AYDIN MERT
127
COMPARISON OF METHODS WITH REGARD TO ENERGY PRODUCTION IN A MULTIPLE RESERVOIRS SYSTEM
MÜCAHĠT OPAN 144
COMPRESSIVE BEHAVIOR OF RUBBER-BASED SEISMIC ISOLATION BEARINGS
SEVAL PINARBAġI 154
CONTROL OF SEISMIC RESPONSE OF THREE-DIMENSIONAL MODEL STUCTURE BY MAGNETORHEOLOGICAL DAMPERS
GÖKÇE KINAY, GÜRSOY TURAN 166
CREATING THE LITHOLOGY MAPS OF ERENLER REGION IN SAKARYA BY USING GIS
FĠKRET KURNAZ, ALPER KIYAK
174
CREATING THE MICROZONATION MAPS OF SAPANCA TOWN BY USING GIS
T.FĠKRET KURNAZ, ALPER KIYAK, CAN KARAVUL 180
CREATING THE SPT MAPS OF DERİNCE TOWN (KOCAELI) BY USING GIS
CAN KARAVUL, ALPER KIYAK, T.FĠKRET KURNAZ, HATĠCE DURMUġ 186 CREATING THE SPT MAPS OF ERENLER REGION IN SAKARYA BY USING GIS
DETERMINATION OF RELATIONSHIPS BETWEEN DEFLECTION AND SAFETY FACTORS FOR A CONCRETE GRAVITY DAM IN EARTHQUAKE
ONUR ÖZTÜRK, M. OPAN, TEMEL TEMĠZ
199
DETERMINATION OF RESERVOIR CAPACITIES FOR FLOOD AND DROUGHT CASES IN A RESERVOIRS WITH IRRIGATION OBJECTIVE
MÜCAHĠT OPAN, TEMEL TEMĠZ
208
DETERMINATION OF THE EFFECTS OF 1855 EARTQUAKES ON MASONRY STRUCTURES IN BURSA: CASE STUDY BURSA ÖRDEKLİ PUBLIC BATH
BĠLAL BAĞBANCI, B. ÖZLEM KÖPRÜLÜ 218
DETERMINATION OF THE OPTIMAL OPERATIONAL LEVELS IN MULTIPLE RESERVOIRS SYSTEM: THE CEYHAN BASIN, TURKEY/
MÜCAHĠT OPAN
228
EFFECT OF DISTRIBUTED PATCH MASS ON FREQUENCY OPTIMIZATION OF LAMINATED PLATES
UMUT TOPAL, S. ALBAYRAK, U. UZMAN
248
EXPERIMENTAL AND ANALYTICAL MODAL ANALYSES OF A PROTOTYPE ARCH DAM-RESERVOIR-FOUNDATION MODEL
BARIġ SEVĠM, A. BAYRAKTAR, A.C. ALTUNIġIK, S. ADANUR, M. AKKÖSE
256
GROUND MOTION SIMULATION OF 1999 MARMARA EARTHQUAKES
AYġEGÜL AKSAN, BELĠZ UĞURHAN 270
INVESTIGATION OF EFFECT OF SHEAR WALL CONTINIUTY TO STRUCTURAL CAPACITY IN RC BUILDINGS
BURAK YÖN, M.E. ÖNCÜ
276
OPTIMAL RELATIONSHIP BETWEEN IRRIGATION AND ENERGY PRODUCTION IN THE MUNZUR RIVER BASIN, TURKEY
TEMEL TEMĠZ, MÜCAHĠT OPAN, ADNAN ÖNER
287
OPTIMUM STACKING SEQUENCE OF SYMMETRIC HYBRID LAMINATED THIN PLATES FOR MAXIMUM FREQUENCY SEPERATION
UMUT TOPAL
302
RESTRAINED SHRINKAGE: AN ENEMY CRYPTIC
ġEVKET ÖZDEN, E. AKPINAR, H. MEYDANLI ATALAY 309
STRUCTURAL MODELING AND EARTHQUAKE ANALYSIS OF OTTOMAN MINARETS
YASIN FAHJAN, E. ERTEK 318
THE EFFECT OF THE POTENTIAL OF LIQUEFACTION SENSITIVITY ON DAMAGE: ISTANBUL (HISTORICAL PENINSULA)
GÖKÇE ÇĠÇEK ĠNCE 329
THE EXAMINATION OF THE BC III(A) REINFORCING STEEL BARS ACCORDING TO EARTHQUAKE CODES
FATĠH KÜRġAT FIRAT, M.S. YÜCEMEN
THE HISTORICAL IMPROVEMENT, LITERATURE REVIEW OF STEEL PLATE SHEAR WALLS AND USING IN HIGH SEISMIC REGIONS
SAĠD DUġAK, A.N. YELGĠN 353
VARIATIONS ON SEISMIC RESPONSE VIA VISCOUS DAMPER PLACEMENT IN PLANAR BUILDING STRUCTURES
BAKĠ ÖZTÜRK, E. AYDIN, FARUK POLAT 369
VISUAL SEISMIC ASSESSMENT OF EXISTING REINFORCED CONCRETE BUILDINGS IN CYPRUS
AYÇA EMĠNAĞA
377
YIELD-CAPACITY-RISK RELATIONSHIP FOR A RESERVOIR IN EARTHQUAKE
MÜCAHĠT OPAN, TEMEL TEMĠZ, ONUR ÖZTÜRK 385
EFFECT OF ADDITION OF STEEL FIBERS ON CRACKING LOAD OF REINFORCED CONCRETE BEAMS UNDER THE EFFECT OF TORSION
SERKAN ENGĠN, FUAD OKAY
FIRE PERFORMANCE OF CHEMICAL ADMIXTURES IN CEMENT MORTARS ADNAN ÖNER, ONUR ÖZTÜRK, SERKAN ENGĠN
THE DESIGN AND EVALUATION STAGES OF LOCAL GNSS NETWORKS FOR MONITORING CRUSTAL MOVEMENTS
ORHAN KURT, HALUK KONAK, CANKUT DAĞDAL ĠNCE
391
398
406
DEFICIENCIES AND PROBLEMS THROUGH EMERGENCY ACTIONS AFTER EARTHQUAKES
EZGĠ KORKMAZ, E. AVLAR
423
MÜZELERDE YAPISAL OLMAYAN MALZEME KAYNAKLI RİSKLER
ALPASLAN KUZUCUOĞLU 429
NATIONAL-INTERNATIONAL DISASTER DATABASES AND IMM-AKOM DISASTER INFORMATION SYSTEM: AKOMAS
NĠLAY ERGENÇ, M.T. TÜRK, O. METĠN ĠLKIġIK
435
SPACIAL SCALE EARTHQUAKE STATISTICS IN GEOMAGNETIC COORDINATES
GALENA KHACHIKJAN 445
THE MIXTURE MODELS FOR EARTHQUAKE RECURRENCE TIMES
M. ERĠġOĞLU, T. SERVĠ, N. ÇALIġ, Ü. ERĠġOĞLU, S. SAKALLIOĞLU, H. EROL
452
THE STATISTICAL EXAMINATION OF THE NATURAL DISASTERS AND THE LOSSES DUE TO THESE DISASTERS IN TURKEY
FATĠH KURġAT FIRAT
464
TSUNAMI DISASTER EVACUATION PLAN
VALENCIA, S. SCHEER, P. BUCKLE, A. SILVA, B. RANGUELOV, A.
ATILLAH, S. TINTI 476
URBAN RECONSTRUCTION PROCESS IN THE POST MARMARA EARTHQUAKE PERIOD (Permanent Housing‘s Practices and Results) HAYRĠYE ġENGÜN
ARCHITECTURE/MİMARLIK
481
A REVIEW OF AUGUST 17 EARTHQUAKE'S EFFECTS ON HOUSING PRODUCTION AND DESIGN
RÜVEYDA KÖMÜRLÜ, KAMURAN ÖZTEKĠN
493
APPROACH OF ARHITECTURE HISTORY TO EARTHQUAKE: ―OBJECTIVITY OF EARTHQUAKE PHENOMENON IN DESIGN AND CONSTITUTION OF COLLECTIVE MEMORY‖
OYA ġENYURT
508
EVALUATION OF CHANGES IN BUILDING CONSTRUCTION PROCESS (PLANNING-DESIGN-PRODUCTION) AFTER 1999 MARMARA EARTHQUAKE RÜVEYDA KÖMÜRLÜ, KAMURAN ÖZTEKĠN
516
OPEN AREAS AND GREEN AREAS RISK ANYLSES AND MANAGEMENT ISTANBUL KUCUKCEKMECE DISTRICT MODEL
YILDIZ AKSOY
525
OPINIONS ABOUT THE EFFECTS OF THE EARTHQUAKES LEADING TO DESTRUCTION IN İZMİT, THE OTTOMAN CITY ON THE PHISICAL CONSTRUCTION IN THE CONTEXT OF RELIGIOUS CONSTRUCTIONS
ġENNUR KAYA
531
PRIORITIES AND PREFERENCES OF SOCIETY IN EARTHQUAKE RISK REDUCTION: A SOCIAL RESEARCH IN BAKIRKÖY
SÜLEYMAN BALYEMEZ, L. BERKÖZ
540
THE IMPORTANCE OF EARTHQUAKE RESISTANT BUILDING DESIGN IN ARCHITECTURAL EDUCATION
YASEMĠN KOÇ, Z.Y. HARMANKAYA, M.E. TUNA
THE STRUCTURAL ANALYSES AND REINFORCEMENT STUDIES OF BURSA İNEBEY (EGNE BEG) MADRASAH
M. BĠLAL BAĞBANCI, ÖZLEM B. KÖPRÜLÜ
564
UNSUITTABLE SETTLEMENT POLICIES IN EARTHUAKE RISKY CITIES: A CASE THROUGH İZMİR-KADİFEKALE LANDSLIDE REGION
KIVANÇ KUTLUCA
573
SOCIAL SCIENCES/SOSYAL BİLİMLER
A STUDY ON HIGH SCHOOL STUDENTS‘ ATTITUDES TOWARDS EARTHQUAKES: AN EXAMPLE OF GIRESUN
NEġET BAYRAM, Ġ.H. TOMAR, MUSTAFA CĠN
581
―NATURAL DISASTERS COURSE‖ PROPOSAL FOR HIGHER EDUCATION UNDERGRADUATE PROGRAMS
GÜLġEN ÖZTÜRK, YILDIZ ULUSOY 592
REMEDIATING MISCONCEPTIONS CONCERNING MAGNITUDE AND INTENSITY OF AN EARTHQUAKE THROUGH CONCEPTUAL CHANGE MATERIAL
MUSTAFA CĠN, H. KARA, A. DEMĠR 599
THE EFFECTS OF 17 AUGUST MARMARA EARTHQUAKE ON THE TURKISH ECONOMIC CRISIS OF 2000 NOVEMBER
EMĠNE FIRAT 606
THOUGHTS AND KNOWLEDGE OF THE FIRST GRADE STUDENTS AT HIGH SCHOOLS
ESMA BULUġ KIRIKKAYA, BALĠ, BOZKURT 616
LAW/HUKUK
THE EFFECTS OF EARTHQUAKES ON INCOME TAXES: A LEGAL PERSPECTIVE AZĠZ TAġDELEN
648
IN THE WORKING LIFE AUGUST 17 EARTHQUAKE EFFECTS OF GENDER DISCRIMINATION
CANDAN ALBAYRAK
EARTH SCIENCES
YER BĠLĠMLERĠ
DEDUCING THE GEOMETRY OF STRIKE-SLIP FAULTING BY
RESISTIVITY METHOD
Efeoğlu1, Aşçı1
1-Department of Geophysical Engineering, Faculty of Engineering, Kocaeli University [email protected] , [email protected]
_______________________________________________________________ Key Words: Resistivity, Wenner, Fault, Iznik.
ABSTRACT
Tectonic based formation of river basins resulted from normal or strike-slipfaults, and formation of river basins can only be understood by revealing the mechanisms or geometry of these faults. Consequently, the structure of North Anatolian Fault Zone in Geyve and Iznik river basins is tried to be revealed by resistivity method in order to explain the formation of the mentioned river basins. To understand Geyve and İznik river basins, data were collected perpendicular to the fault line. Wenner configurations were applied. Then we performed an inversion algorithm developed based on the least square method for evaluating the data. In this way we showed that how the fault continues the downwards. Three directions were selected on the Geyve and İznik faults which are considered as the western central branch of the North Anatolian Fault Zone. Separate measurements perpendicular to the fault were performed for each direction. The measurements were collectively evaluated and the geometrical status of the fault in that region was presented. According to the results obtained, the surface and underground traces of the fault were jointly mapped. The underground traces were found to be tending towards the north when compared to the surface traces. The level of this tendency has provided us valuable tectonic information on the basins‘ formation and their evaluation to date.
INTRODUCTION
This study area is in the south-eastern part of the Marmara region. It is cut by many active faults forming some distinct tectonic features; such as Lake İznik.
Bifurcation of the North Anatolian Fault (NAF) master strand east of the Almacık block, the southern strand of the NAF zone follows the Mudurnu valley and further west bifurcates again around Pamukova village (Şengor 1979; Barka & Kadinsky-Cade 1988; Kocyiğit 1988; Barka 1992; Bozkurt 2001; Yaltırak 2002). One of these faults extends westward from Pamukova into Lake İznik. (Kocyiğit 1988), while another fault extends from Mekece to the northern slopes of Uludağ Mountain along the Yenişehir plain (Barka & Kadinsky-Cade 1988; Yaltırak 2002). Lake İznik is situated on the fault segments of the northern block of the North Anatolian Fault Middle Strand (NAFMS), which extend from Pamukova to the Gulf of Gemlik, along the southern coast of Lake İznik and through Gemlik town. Within this framework, the lake itself and almost all of its coastal plains are located on the NAFMS, which can be traced along a 97-km-long corridor from the town of Geyve to Gemlik. This region is made up of a series of structurally active basins, namely the Geyve-Pamukova Basin, Lake İznik and the Gulf of Gemlik (Bargu 1982; Kocyiğit, 1998; Barka & Kuşcu 1996). In this region, Tsukuda et al. (1988) defined two separate fault segments: the Geyve segment between the towns of Geyve and İznik, and the İznik segment (i.e., the Soloz Fault). Both structures exhibit morphological features characteristic of strike-slip faults.
METHOD
The used apparent resistivity equations have been proposed by Telford (1976). In this study Marquardt, 1963 technique was used and this technique is given below;
A
A
I
A
g
p
T
T
1
(1)Here,
p Parameter correcting vector, g Observed and calculated anomaly distinction A jacobian matrix, λ Marquardt factor, I Identity matrix.
Marquardt factor initially were chosen 2. In case of convergence was split into two and In case of divergence was multiplied by two.
MODELING STUDIES
Fault Modeling study and underground structure have been shown Figure1.
Fig. 1. Fault model.
GEOLOGY OF THE STUDY AREA
The geology of the region surrounding Lake İznik includes Late Palaeozoic, Mesozoic and Palaeogene successions forming the pre-Miocene basement. The Miocene sequence unconformably overlies the basement rocks and is covered by Pliocene–Quaternary units Pliocene–Quaternary units consist of sand and gravel layers with laterally variable thicknesses. Pliocene–Quaternary deposits around Lake İznik include alluvial plains, fans, marsh areas, lake terraces and beach facies, especially in the eastern and western sectors (Öztürk at al.2008).
FIELD INVESTIGATIONS
In this field study three direction were selected. Direction1 composed of three profiling measurement. Solutions and approximate cross-section respectively have been shown Figure2 and Figure 3.
Fig. 2. Solution of G1 ve G2 profiling and geometry.
Fig. 3. Solution of G3 profiling and geometry.
According to the results obtained, the surface and underground traces of the fault map has been shown Figure 4.
Fig. 4. Obtained from solutions fault map.
Direction 2 composed of two profiling measurement. Solutions and approximate cross-section respectively have been shown Figure 5 and Figure 6.
Fig. 5. Solution of IZN1 profiling and geometry.
Fig. 6. Solution of IZN2 profiling and geometry.
According to the results obtained, the surface and underground traces of the fault map has been shown Figure 7.
Fig. 7. Obtained from solutions fault map.
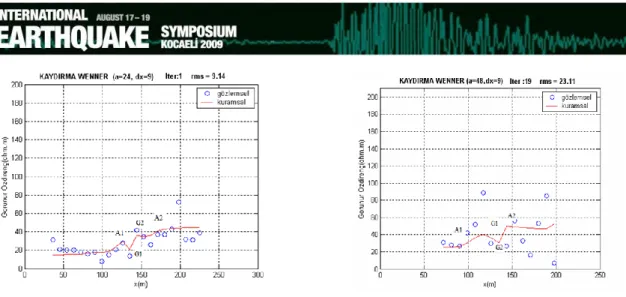
Two profile were selected on this direction. Solution of IZN3 profile and approximate cross-section have been shown Figure 8. Solution of IZN4 profile has been shown Figure9.
Fig. 9. Solution of IZN4 profiling.
According to the results obtained, the surface and underground traces of the fault map has been shown Figure 10.
Fig. 10. Obtained from solutions fault map. Results of inversion has been shown Table1. 1, 2 : Apparent resistivity
a : The distance between electrodes
d : Valid for distance definitions frompoint of measurement to fault dg : The distance between the two faults
dx : The amount of shift Table 1. Results of inversion.
Results of inversion
Initial Parameter Calculated Parameter
1
2 d Dg
1
2 d Dg a dx İter rms G1 10 18 96 ---- 9 16 100 ---- 10 10 49 1,9 G2 25 12 118 ---- 22 12 100 ---- 10 10 6 3,5 G3 Gidiş 36 15 131 ---- 37 18 160 ---- 25 15 5 5,6 G3 Dönüş 36 18 131 ---- 32 20 162 ---- 50 30 4 2,4 IZN1 Gidiş 32 24 100 90 28 23 99 113 24 9 2 3,6 IZN1Dönüş 30 16 120 100 29 15 119 116 48 9 2 2,0 IZN2 Gidiş 25 16 100 30 20 16 100 46 24 9 2 4,3IZN2Dönüş 5 20 110 ---- 5 25 108 ---- 48 9 5 2,9 IZN3 9 38 150 150 14 36 148 187 24 9 2 5,1 IZN4 Gidiş 12 45 120 ---- 15 46 125 ---- 24 9 1 9,1 IZN4Dönüş 30 60 110 ---- 22 59 112 ---- 48 9 19 23,1
CONCLUSION
The present inversion scheme has been tested on synthetic and field data. The results of the tests show that the procedure works well and the convergence process is stable even in the fault model. Three directions were selected on the Geyve and İznik faults which are considered as the western central branch of the North Anatolian Fault Zone. The profile data was interpreted by the application of Damped Least-Squares (Marquardt) inversion techniques. According to resuts obtained from inversion the underground traces were found to be tending towards the north when compared to the surface traces. The results obtained were supported by the magnetic studies conducted by the Bogazici University Kandilli Observatory and Earthquake Research Instutute in the same region.
REFERENCES
Barka, A.A. 1992. The North Anatolian Fault Zone. Annales Tectonicae 6, 164–195. Barka, A.A. & Kadinky-Cade, K. 1988. Strike-slip fault geometry in Turkey and its influence on earthquake activity. Tectonics 7, 663–684.
Bargu, S. 1982. The geology of İznik-Yenişehir (Bursa)-Osmaneli (Bilecik) area. İstanbul
University Yerbilimleri Dergisi 3, 191–234.
Barka, A.A. & Kuşcu, İ. 1996. Extends of the North Anatolian Fault in the İzmit, Gemlik and Bandırma bays. Turkish Journal of Marine Sciences 2, 93–106.
Bozkurt, E. 2001. Neotectonics of Turkey – a synthesis. Geodinamica Acta 14, 3–30. Kocyiğit, A. 1988. Tectonic setting of the Geyve Basin: age and total displacement of the Geyve Fault Zone. Middle East Technical University. Journal of Pure and Applied
Sciences 21, 81–104
Marquardt, D.W, (1963), An algorithm for least squares estimation of non linear parameters, Journal of the Society of Industrial and Applied Mathematics 11,431-441.
Ozturk,K., Yaltırak, C., Alpar, B., The Relationship Between the Tectonic Setting of the Lake İznik Basin and the Middle Strand of the North Anatolian Fault, Turkish Journal of
Earth Sciences (Turkish J. Earth Sci.), Vol. 18, 2009, pp. 209–224.
Şengor, A.M.C. 1979. The North Anatolian transform fault: its age, offset and tectonic significance. Journal of the Geological Society, London 136, 263–282.
Telford, W. M., Geldard, L. P., Sheriff, R. E., and Keyes, D. A., ,(1976).,Applied
Geophysics, Cambridge University Pres
Tsukuda, E., Herece, E. & Kuşcu, İ. 1988. Some Geological Evidence on Activity of the Western Anatolian Fault, Geyve, İznik, Gemlik Area. ITIT Project 8513, 68–91.
Yaltirak, C. & Alpar, B. 2002. Evolution of the NAF Middle segment and shallow seismic investigation of the Southestern Sea of Marmara (Gemlik Bay). Marine Geology 190, 307–327.
ÜÇ
BOYUTLU
KARMAġIK
YER
MODELLERĠNĠN
YAPAY
SĠSMOGRAMLARLA TANIMLANMASI
DETERMINATION OF RESPONSE OF 3D COMPLEX VELOCITY
MODELS BY USING SYNTHETIC SEISMOGRAMS
Arslan1
1-Çanakkale Onsekiz Mart Üniversitesi, Mühendislik Mimarlık Fakültesi Jeofizik Mühendisliği Bölümü, Terzioğlu Yerleşkesi 17020 Çanakkale
_______________________________________________________________ Anahtar Kelimeler: Sismik, Akustik Dalga Yayılımı, Sonlu Farklar Yöntemi, Yapay Sismogram, 3B Düz Çözüm,
ÖZ
Bu çalışmada, üç boyutlu (3B) yer yapısı ve nokta kaynak için akustik dalga denklemleri zaman ortamında çözümlenmiştir. Akustik dalga denkleminin sayısal benzetimi, sonlu farklar(SF) yöntemi kullanılarak yapılmıştır. Sismik kaynak olarak Ricker dalgacığı kullanılmıştır. Farklı hız modelleri için akustik dalga yayılımı hesaplanmış ve bu hız modellerine ait yapay sismogramlar üretilmiştir.Sonlu farklar yöntemi ile dalga yayılımının modellemesi yapılırken, karşılaşılan en önemli sorunlardan biri, hesaplama alanının sınırlarında meydana gelen yansımalardır. Bu yansımaları bastırmak için, hem sınır bölgesi hesaplama alanından uzak tutulmuş, hem de soğuran sınır koşulları kullanılmıştır.
Çeşitli hız modelleri için üretilen yapay sismogramlarda gözlemlenen değişimler 2B ve 3B yaklaşımların farkını ortaya koymuştur. 1B ve 2B hız modelleri üzerinde elde edilen sismogramlardaki ilk varışlarda farklılık yoktur. Fakat uygulama açısından bakıldığında gerçek ölçümlerde ölçüm hattına koşut süreksiz yapıların etkisinin yorumu önem kazanmaktadır. Bu tür modelleme çalışmaları beklenen belirtileri tanımlama açısından önemlidir ve yorumcuya yol gösterici olabilir.
GĠRĠġ
Sismik yöntemlerde kaynak dalga etkisi ile titreşen malzemeler, üzerlerindeki dinamik yükleri çevresindeki birimlere iletirler. Kaynak dalgacık yer içinde ilerlerken süreksizlikler ile karşılaştığında, jeolojiye bağlı olarak yansıma veya kırılmalara uğrayacaktır. Gerçek koşullarda üç boyutta yayılan kaynak dalgacık yer içinde seyahatini sürdürürken kayıtçılara ulaşıncaya dek izlediği bütün yolların etkisini taşıyacaktır. Bu açıdan bakıldığında karmaşık şekilli jeolojik yapıların neden olacağı belirtilerin hesaplanmasında kullanılacak yöntemler önem taşımaktadır.
Karmaşık yer modellerinin yanı sıra zamana ve konuma göre değişim gösteren ortam değişkenlerinin (parametre) göze alınması gerektiğinden yapılacak olan analitik çözümlerde güçlükler söz konusu olabilmektedir. Buna karşın sismik dalgaların yayılım modellemeleri bilgisayar ortamında yapılan sayısal hesaplama teknikleri ile birçok koşulu bir araya getirerek etkin çözümler üretebilmektedir. Sismik yöntemlerde akustik özelliğe bağlı olan dalga yayılımı, akustik dalga denklemi ile kontrol edilmektedir. Üç boyutlu akustik dalga yayılım modellemeleri kullanılarak yapılan nokta bazında hesaplamalar, üç boyutta süreksiz, karmaşık şekilli yapıların etkisini yapay sismogram üzerinde ortaya koyabilmektedir. Bu şekilde tanımlanan koşullar doğrultusunda; yer içi hız modelinin kaynak sinyale vereceği tepki, gerçeğe daha yakın bir şekilde gözlenebilecek ve ortamda tanımlanan keyfi sayıda kayıtçılar, istenilen noktalarda yapay sismogram üretebilmeyi mümkün kılacaktır.
Çalışma kapsamında akustik dalga denklemi, zaman uzayında sonlu farklar yöntemi ile sayısallaştırılmış ve gerekli hesaplamaların yapılabilmesi için bir bilgisayar algoritması geliştirilmiştir. Matlab programlama dili ile işlevsellik kazandırılan algoritma sayesinde, hesaplanacak akustik dalga yayılımı; tanımlanacak olan, karmaşık şekilli hız modellerine ait yapay sismogramların, kolayca oluşturulabilmesini sağlamaktadır. Gerçekleştirilen hesaplamalardan elde edilen sonuçlara ilişkin olarak sunulan örneklerde, 2 ve 3 boyutlu yapıların, tek hat üzerinde elde edilen yapay sismogram üzerindeki etkisi incelenmiştir.
YÖNTEM
AKUSTĠK DALGA DENKLEMĠ
Üç boyutlu, tekdüze, yön bağımsız (homojen, izotrop) bir ortamda, 3B akustik dalga hareketi Kartezyen koordinatlarda nokta kaynak için aşağıda ifade edilen akustik dalga denklemi tarafından kontrol edilmektedir (örn. Mufti ve ark., 1996).
Burada (x,y,z) uzaysal konumları, t: zamansal konumu, U: yer değiştirme bileşenlerine bağlı oluşan dalga alanını, : 3b ortam için noktasal kaynak fonksiyonu ve v(x,y,z): P dalga hızını ifade etmektedir.
SONLU FARKLAR YÖNTEMĠ
Akustik dalga denklemlerinde bulunan konuma ve zamana bağlı türev işleçlerinin Taylor seri açılımı kullanılarak ayrık noktalarda tanımlanıp hesaplanması sonucunda zaman uzayında sonlu farklar yöntemi (yinelemeli SFY) elde edilmektedir. Yinelemeli sonlu farklar yöntemi kullanılarak yapılacak modelleme çalışmalarında, dalga alanının tanımlanabileceği yarısonsuz bir ortam seçilerek, kendi boyutlarından ve kaynak sinyalin dalga boyundan çok daha küçük ebatlarda hücrelere bölünmektedir. Her bir hücre yapısı diğer hücrelerden bağımsız olarak tanımlanırken, hesaplama maliyeti ve kolaylığı göz önünde tutularak, kendi içerisinde tekdüze olduğu kabul edilmektedir. Ayrık noktalarda tanımlanan hücrelerin birbiri ile konumsal ilişkilerini ifade eden örnekleme aralıkları Δx, Δy, Δz, ile tanımlanırken zaman uzayındaki ilişkilerini temsil eden örnekleme aralığı ise Δt ile belirtilmektedir.
Çalışma kapsamında işlemlerin gerçekleştirilebilmesi için Kartezyen koordinatlarda (i,j,k) 3B bir hesaplama alanı seçilerek, ortam küp şekilli (Δx=Δy=Δz) hücrelere bölünmüştür (Şekil-1). Akustik dalga denkleminde yoğunluğun hız ile doğru orantılı olarak arttığı varsayılarak sabit alınıp, hücre içlerine P (düşey) dalga hızları tanımlanmaktadır. Akustik dalga denklemlerinin sonlu farklar yöntemi ile ayrıklaştırılması yapılırken, zaman uzayında 2. konum uzayında ise 4. dereceden fark yaklaşımları kullanılmıştır. Bu fark yaklaşımları ile yapılacak hesaplamalarda bir hücre değerinin hesaplanmasında kullanılan Kartezyen koordinatlardaki hücre konumları Şekil-1 ile verilmiştir. Bu şekilde ayrık noktalarda tanımlanmış olan hız bileşenleri kullanılarak, yer değiştirme bileşenleri, yinelemeli sonlu farklar yöntemi ile her bir zaman adımında hesaplanıp, dalga alanı elde edilmektedir. Yöntemin hesaplamasına dair detaylara Mufti (1990) ye bakılabilir. Bu şekilde yer içinde tanımlanabilecek olan keyfi çeşitlilikte ve karmaşık şekilli yapıları temsil eden hız modellerinde yapılan hesaplamalar doğrultusunda başka koşula gerek duymadan dalga yayılımı gerçekleştirilebilecektir. Dalga yayılımı sırasında ortamda keyfi sayıda ve konumda tanımlanabilecek olan kayıtçılar, her bir yineleme adımında genlik değerlerinin kaydını tutarak, yapay sismogram üretebilmeyi mümkün kılmaktadır.
a b
ġekil 1. a) Kartezyen koordinatlarda örnek bir hesaplama alanı, b) Konum Uzayında 4. derece fark yaklaşımları ile hesaplanan SF yönteminde kullanılan hücre konumları.
KAYNAK UYGULAMASI
Kaynağın yer içi ile evrişiminden elde edilmek istenen ideal tepki; bir atım (pik) şeklinde olacaktır. Bu şekilde tanımlanabilecek bir dalga formu mümkün olmamakla beraber modelleme çalışmalarında dalga formları sıfır fazlı dalgacık kullanılarak bir atım şekline yaklaştırılmaya çalışılmaktadır (Şekil-2).
a b
ġekil 2. a) Sismik kayıtta, süreksizliklerin tepkisini ifade eden cevap türleri b) Ricker dalgacığı.
Yinelemeli sonlu farklar yöntemi doğrultusunda hesaplama işlemlerinde başlangıç (t=0) anında hesaplama alanı durağan ( 0
, , kj i
U =0) olarak kabul edilmektedir. Hesaplama işleminin başlaması ile yer değiştirme bileşenlerine eklenen kaynak sinyal, dalga yayılımını tetikleyecektir. Çalışma kapsamında dalgacığın akustik özellikleri ve sismik ayrımlılığı artırması göz önünde bulundurularak, sıfır fazlı bir dalgacık olan Ricker dalgacığı kullanılmıştır (şekil-2). Hesaplama sırasında Ricker dalgacığı, her bir zaman adımında tek bir noktada yer değiştirme bileşenlerine eklenerek, nokta kaynak etkisi oluşturmaktadır. Ricker dalgacığı aşağıdaki bağıntı ile ifade edilebilir.
2 )) / 1 ( ( ) 2 )) / 1 ( ( 2 1 ( ) ( maks f t maks f e maks f t maks f t F (2)
Burada
F
(t
)
: kaynak fonksiyonu, t: zaman, fmaks: baskın frekansı temsil etmektedir. Ortama uygulanan sismik kaynağın frekansı, en büyük/baskın frekans olarak kabul edilerek, dalgacığın yer içindeki soğurulma miktarını, inebileceği derinliğini, kırılma ve yansıma genliklerindeki belirleyiciliği yönünden önem taşımaktadır.SINIR KOġULLARI
Sonlu farklar yöntemi kullanılarak yapılan dalga yayılım modellemelerinde karşılaşılan en büyük sorunlardan biri sınır koşullarıdır. Seçilen hesaplama alanının kenarlarında bulunan birkaç hücrede tanımlı ayrık dalga alan bileşenlerinin hesaplanamamasından kaynaklanan bu sorun, üzerine gelen dalga cephesini tam yansımaya uğratmaktadır. Bu koşullar altında yapılacak olan hesaplamalarda dalga yayılımı ve oluşturulacak olan yapay sismogram üzerinde yanıltıcı bir etki gözlenecektir. Çalışma kapsamında seçilen yönteme bağlı olarak sınırlarda bulunan iki düğüm noktasının değeri hesaplanamamaktadır (Şekil-3). Bu durumun engellenebilmesi amacıyla deneye dayalı
1
, , 3 1 , , 1 1 , , 2 2 4 2 2 ) 2 2 ( 2 ) 2 , , 1 2 ( 1 , , 2 , , 2 , , 1 2 1 , , 1 n k j U n k j U n k j U x t maks v t k j v n k j U n k j U n k j U n k j U (3) şeklinde bir bağıntı kullanılıp, yansıyan dalga genlikleri bastırılmaya çalışılmıştır. Burada üst imge n; zaman adımını, U; yerdeğiştirme bileşenlerine bağlı dalga alanının düğüm noktalarındaki ayrık değerlerini temsil etmektedir. i=1 için gösterilen bu bağıntı diğer sınır değerlerine uyarlanarak kullanılmıştır. Bağıntının yeterli görülmediği durumlarda hesaplama alanı sınır hücrelerinden uzaklaştırılmıştır. Sınır değerlerinin ihmali sonucunda tekdüze bir ortamda hesaplama alanı kenarlarında oluşacak olan yansımlar ve kullanılan yöntem doğrultusunda, yansımaların bastırılmış halleri Şekil-3 ile 2B kesit üzerinde gösterilmiştir.a
b
c
ġekil 3. a) Örnek bir hesaplama alanında sınır değerlerine ait konumların 2B kesit yüzeyinde gösterimi, b) Sınır değlerinin etkisi ile hesaplama alanında oluşan yansımalar, c) Soğuran sınır koşulları etkisiyle sınır değerlerindeki yansımaların bastırılmış halleri.
UYGULAMALAR
Çalışma sonucunda geliştirilmiş olan akustik dalga yayılımının gerçekleştirilmesine örnek olarak iki tabakalı hız modeli Şekil-4 ile sunulmuştur. Basit bir gösterim olması amacıyla, üç boyutlu ortamda bir boyutlu olarak tanımlanan, iki tabakalı hız modelinde kaynak sinyalin oluşturduğu dalga cephesinin ortamda ilerleyişi gözlenebilmektedir. Örnekteki dalga yayılımı hesaplanırken, 3 hat boyunca tanımlanan kayıtçılar ile her bir zaman adımında kayıt tutularak yapay sismogram oluşturulması gözlenebilmektedir
a) t=0.016 sn. b) t=0.032 sn.
c) t=0.043 sn. d) t=0.08 sn.
e) t=0.096 sn. f) t=0.144 sn
ġekil 4. İki tabakalı örnek bir hız modelinde, zaman uzayında akustik dalga yayılımı ve yapay sismogramın oluşturulmasının farklı zaman adımlarındaki gösterimi.
Burada mavi ile gösterilen alan, dalga cephesini temsilen ricker dalgacağının sıfırdan küçük olan değerlerinin çizdirilmesi ile elde edilmiştir.
ÖRNEK-1 ENGEBELĠ ARA YÜZEY HIZ MODELĠ
Engebeli ara yüzey bulunduran (ondülasyonlu) bir hız modelinin incelenmesi amacıyla, 1000m/sn ve 2000m/sn hızlı, iki tabakalı 2B bir model ele alınmıştır. Orta atış tekniği kullanılarak ortamda dalga yayılımı gerçekleştirilmiş ve yapay sismogram
oluşturulmuştur. Yapay sismogram incelendiğinde, ortamda yayılan sinyalin, ara yüzeyin şekline göre davranış göstereceği gözlemlenebilmektedir. Derinlik arttıkça kırılarak gelen dalgalarda gecikmeler söz konusu olacaktır. Tümsek ve çukur şeklindeki yapılar, sismogram üzerinde birden fazla kırılma gözlenmesine sebep olabilmektedir. Bir boyutlu yapılan çalışmalarda yanıltıcı etkiye sebep olan bu durum göz önünde bulundurulmalıdır.
a b
ġekil 5. a) 2B engebeli arayüzey hız modeli b) Engebeli arayüzey hız modeli kullanılarak oluşturulmuş olan yapay seismogram.
Yapay sismogram üzerindeki yeşil ile işaretlenen noktalar, doğrudan gelenler için hız=yol/zaman bağıntısı ile kuramsal olarak hesaplanarak çizdirilmiştir. Sismogram üzerinde görülebileceği gibi, kuramsal veri ile sismogram birbirini desteklemektedir. İkinci tabakanın etkisiyle oluşan kırılmalar, kuramsal olarak hesaplanmamış, kırmızı ve mavi doğru parçaları, sismogram üzerinde ilk varışların gösterilebilmesi amacıyla çizilmiştir.
ÖRNEK-2 FARKLI KONUMLARDA TANIMLI PRĠZMATĠK YAPILARA AĠT HIZ
MODELĠ
Yer içinde gömülü olan; birbiri ile özdeş, iki prizmatik yapının, ölçüm hattının düşeyinde veya koşut bir konumda bulunması durumunda, sismograma etkisinin incelenmesi amacıyla bir hız modeli oluşturulmuştur. Yapılar yüzeyden 20 m. derinlikte tanımlanmıştır. Birinci yapı ölçüm hattının düşeyinde, ikinci yapı ölçüm hattına 15 metre yatay uzaklıkta tanımlanmıştır. Yapılar profil hattı boyunca 100 m., düşeyde ise 50 m. uzunluğundadır. Ortam hızı 1000m/sn, yapılar ise 2000 m/sn hızlarla tanımlanmıştır. Oluşturulan yapay sismogram incelendiğinde ölçüm hattı düşeyindeki yapının etkisi 50-140 m. aralığında düzgün olarak gözlenebilmektedir. Ölçüm hattına koşut olarak konumlandırılan, diğer prizmatik yapı, üç boyutta yayılan dalganın etkisiyle 280-400m aralığındaki alıcılarda etkisini göstermektedir. İki boyutlu çalışmalarda göz ardı edilebilecek bu durum yorumcuyu yanlış yönlendirebilecektir. Yapay sismogram üzerindeki yeşil noktalar doğrudan gelenleri, kırmızı ile işaretlenmiş noktalar ise ölçüm hattının düşeyindeki yapının etkisiyle oluşan kırılmaları temsil etmektedir. Bu noktalar düzgün yapı özelliği gösterdiği için düşeydeki yapının oluşturacağı kırılmaları ve doğrudan gelenleri temsilen, sistemin doğruluğunun denetlenmesi amacıyla kuramsal olarak hesaplanarak çizdirilmiştir.
a b
c
ġekil 6. a) Prizmatik yapıların 3B gösterimi, b) Prizmatik yapıların yüzeyden 2B gösterimi, c) Prizmatik yapılar kullanılarak elde edilen yapay seismogram.
SONUÇ
Çalışmada gerçekleştirilen akustik dalga yayılımı, muhtemel olarak tanımlanabilecek jeolojik yapıya uygun sismik hız modellerinin yapay sismogram üzerindeki etkisini ortaya koymaktadır. Karmaşık bir yapı özelliği gösteren yeraltını bir ve iki boyutlu modelleme çalışmaları veya düzgün geometrik şekilli varsayımlar ile modellemeye çalışmak muhtemel etkileri belirlemekte yetersiz kalabilmektedir.
Çalışma sonucunda çeşitli hız modelleri için üretilen yapay sismogramlarda gözlemlenen değişimler 2B ve 3B yaklaşımın farkını ortaya koymuştur. Üç boyutlu ortamda oluşturulan 1B ve 2B hız modelleri ile elde edilen sismogramlardaki ilk varışlarda farklılık yoktur, fakat uygulama açısından bakıldığında gerçek ölçümlerde ölçüm hattına koşut süreksiz yapıların etkisinin yorumu önem kazanmaktadır. Bu tür modelleme çalışmaları, beklenen belirtileri tanımlama açısından önemlidir ve yorumcuya yol gösterici olabilmektedir. Beklenen etkilerin modellenmesinde ve yorumlanmasında, gerçekçi yaklaşımlar yapabilmek için, 3B yer yapısında, 3. Boyutta süreksiz yapıların sismik iz üzerindeki oluşturabileceği etkilerin göz ardı edilmemesi kesinlikle tavsiye edilir.
TEġEKKÜR
Çalışma süresince desteği ve katkılarından dolayı değerli hocam Emin U. ULUGERGERLİ‘ye teşekkürlerimi sunarım.
KAYNAKLAR
Mufti, I.R., Pita J.A. And Huntley R.W. 1996. Finite-Difference Depth Migration of Exploration-Scale 3D Seismic Data. Geophysics 61, 776–794.
Mufti, I.R. 1990 Large-Scale Three-Dimensional Seismic Models and Their Interpretive Significance: Geophysics, 55, 1166-1182.
DETERMINING OF SUBSURFACE STRUCTURES BY RESISTIVITY
METHOD
Efeoğlu1
1-Department of Geophysical Engineering, Faculty of Engineering, Kocaeli University [email protected]
_______________________________________________________________ Key Words: Wenner, Schlumberger, Damped Least Squares (Marquardt) Techniqe, Inversion.
ABSTRACT
Modelling process means determining of geometrical and physicalparameters which are representing geological structure. Resistivity method is often prefered in modelling studies because of its easy applicability, speed and cheapness In this study, to examine the usefulness of the electrical resistivity inversion method in the horizontal and vertical discontinuities, modelling studies were carried out using synthetic and field 1-D resistivity data. The models used in the study were composed of fault, dayk and layer earth model. The Schlumberger and Wenner electrode configurations widely used in the resistivity method were employed to generate apparent resistivity data and the solutions were obtained by the Damped Least-Squares (Marquardt) algorithm. Iteration progress and the modification of Marquardt factor are controlled by rms value. Accomplishment of these methods were tested by modeling studies on different problems. Then, these models were applied to the field data. Five different models applied to the apparent resistivity data obtained in the field. The reliability of the solutions was studied by data and model misfit approaches. Study resulted with satisfactory solutions, field data and theoretical data are congruent for all model surveys.
INTRODUCTION
By using the lateral or vertical electrical conductivity, determination of geological structure is one of the main goals of the application of electrical methods. In this study, the applicability of the damped least squares algorithm to the determination of model parameters related to different model is investigated. Inversion of resistivity anomalies by damped least squares (Marquardt) technique consist of some mathematical and statistical operations on the the data to generate the most suitable geophysical model approximating the subsurface geological structure. The initial values of the model parameters are assumed approximately in the inversion procedure. The initial values of model parameters are improved iteratively based on the differences between the observed anomalies and theoretical anomalies caused by the model structure.
METHOD
Reflexive resistivity function is based while evaluating vertical electricity drilling datas. In the lateral orientated studies, the principles of image theory is used.
Lateral electricity drilling ;
The used apparent resistivity equations have been proposed by Telford (1976). Vertical electricity drilling;
n-layer earth model is shown in Figure 1. A, B : Current electrode
When the number of soil exceeds two, the determination of the resistivity and depth for layer from resistivity sounding becames more difficult. For the Schlumberger dc resistivty method, the layered-earth forward response is given by Koefed, 1970.
ass
s
T
J
1 sd
0 2)
(
(1)s : Half the current electrode spacing T(λ) : Resistivity transfer function
λ : Variable having the dimension of inverse distance J : Bessel function
Fig. 1. n-layer earth model with Schlumberger configuration earth and definition of the symbols used in formulas.
DAMPED LEAST-SQUARES (MARQUARDT) TECHNIQUE
g
A
I
A
A
p
T
T
1)
(
(2)p : Parameter correcting vector
g : Observed and calculated anomaly distinction A : jacobian matrix
λ : Marquardt factor I : Identity matrix
Marquardt factor initially were chosen 2. In case of convergence was split into two and In case of divergence was multiplied by two.
MODELING STUDY
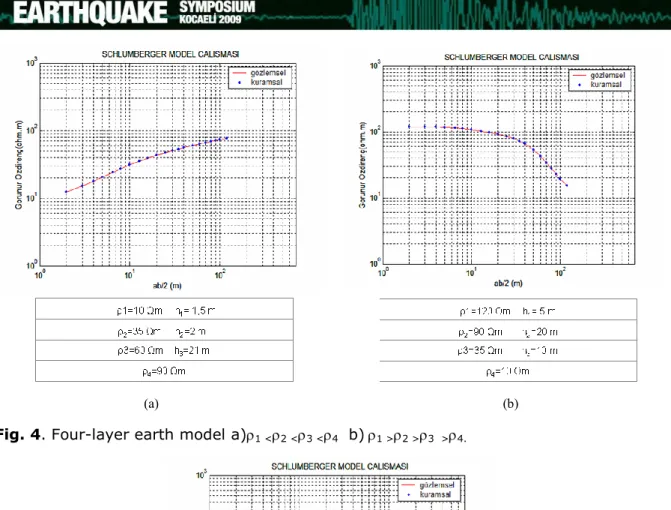
Modelling studies were carried out using synthetic and field 1-D resistivity data. The synthetic data were obtained using four different models. Figure 2,3,4,5 shows model survey results of various model.
(a) (b) Fig. 2.a) Fault model. b) Dike model.
(a) (b) Fig. 3.Dike model a)1 <2 <3 b)1 >2 >3.
(a) (b) Fig. 4. Four-layer earth model a)1 <2 <3 <4 b)1 >2 >3 >4.
Fig. 5. Four-layer earth model a)1 <2 <3 <4 b)1 >2 >3 >41 >2 <3 >4. .
GEOLOGY OF THE STUDY AREA
The North Anatolian fault zone splays into three strands in the eastern Marmara region. The northern strand crosses the Sapanca lake and extends through north of Armutlu peninsula, northern Marmara Sea and Saros Bay. The middle strand splays from Mudurnu valley in SW direction and extends through Geyve, Iznik, Gemlik, Bandirma and Bayramic. The study area is located on the southeast of Marmara region. Pamukova Metamorphics is composed of amphibolites with marble and quartzite interlayers, which is intruded by granites. This metamorphic basement is uncorformably overlain by metaclastics and recrystallized limestone.
FIELD STUDY
Investigated field is shown in figure 6. Wenner configurations were applied. Then we performed an inversion algorithm developed based on the least square method for evaluating the data (Figure 7,8).
Fig. 6. Location map of study area.
Fig. 8. Solution for C profile anomaly.
Results of inversion for Wenner configuration is shown table1. 1, 2 : Apparent resistivity
a : Distance between electrode
d : Valid for distance definitions frompoint of measurement to fault b : Width of dike
Table 1. Results of inversion (Wenner configuration).
Results of inversion (Wenner configuration) Initial Parameter
Calculated Parameter
1 2 3 d b 1 2 3 d b a dx İter rms
A profile 36 18 ---- 131 ---- 37 18 ---- 160 ---- 25 15 5 5,6 B Profile 30 92 25 72 120 28 88 28 75 125 25 10 2 6,9 C Profile 74 47 31 94 150 75 49 33 92 158 25 10 2 5,6
Schlumberger measurement and subsurface structure is shown Figure 9.
Cagniard (1953) charts have been used to determine initial parameters. Then the initial parameters have been used as input parameters for inversion process.
Fig. 9. Solution for schlumberger configuration.
Results of inversion for Schlumberger configuration in the same region is shown Table 2. Table 2. Results of inversion (Schlumberger configuration).
Results of inversion (Schlumberger configuration)
ρ1 h1 ρ2 h2 ρ3 h3 ρ4 İter RMS Initial Parameter 25 0,8 12 12 5 26 60 5 2,3 Calculated Parameter 26 1 15 8 6,5 23 75 --- ---
CONCLUSION
Resistivity method has adevantage of being fast and economical. It can be applied to superficial or deep problems. The presented method for estimation of soil parameters from Schlumberger and Wenner measurements. The procedure has been applied using field test data and has been shown to provide o satisfactory earth model.
REFERENCES
Cagniard L., 1953, Basic theory of the magnetotelluric method of Geophysical prospecting , Geophysics 18, 605-653.
Guptasarma D, (1982), Optimization of short digital linear filters for increased accuacy,
Geophysical Prospecting, 30, 501-514.
Marquardt, D.W, (1963), An algorithm for least squares estimation of non linear parameters, Journal of the Society of Industrial and Applied Mathematics 11,431-441.
Pekeris C.L., (1940), Direct method of interpretation in resistivity prospecting,
Geopphysics, 5, 31-46.
Sunde E.D., (1949), Earth conduction effects in transmission systems: New York, Van
Nostrand, p.55.
Telford, W. M., Geldard, L. P., Sheriff, R. E., and Keyes, D. A., ,(1976). , Applied
EVALUATION OF SOURCE PARAMETERS OF SOME MODERATELY
EARTHQUAKES IN SOUTH -EAST OF IRAN
Mostafazadeh1, Ashkpour1
1-International Institute of Earthquake Engineering and Seismology, Iran- Tehran, P.O.BOX. 19395/3913
[email protected], [email protected]
_______________________________________________________________ Key Words: source parameters, source time function, waveform modeling, Gowk fault.
ABSTRACT
The occurrence of the South east of Iran earthquake of four largeearthquakes provides an important opportunity to study source properties of earthquakes in this region. We constrain source parameters of the March 14 1998 (Mw 6.6) earthquake by analyzing body wave form seismogram and compiled source parameters of 11 June 1981 (Ms 6.7), 28 July 1981 (Ms7.1), 20 November 1989 (mb5.6), events that is obtained from body wave form modeling. The results from waveform modeling (March 14 1998) indicate that source depth was 4 km and that right-lateral strike slip motion mechanism. We have calculated source time function (STF) of March 14 1998 earthquake and compiled this function for other events of Gowk fault system earthquakes that is obtained from teleseismic body waveform modeling. The duration of each event was determined from source time function. Corner frequency and source radius have been calculated for each event by using pulse duration from source time function. Corner frequencies and source radius range are changed from 0.013 Hz to 0.16 Hz and 8.14 to 100 km respectively. Minimum and maximum displacement is observed 8.14× 10⁻⁴ km and 0.01 km respectively.
INTRODUCTION
On March 14, 1998 at 19: 40: 28.3 GMT a large earthquake (MW= 6.0) occurred on the Gowk fault in south east of Iran, (Fig. 1) (Vernant et al., 2007). Study of instrumentally earthquake records show that some of the large earthquakes had occurred in this suture zone during the past 26 years (Table 1). Much of the mechanical deformation resulting from Arabia-Eurasia collision is accommodated in Iran plateau. Active faulting in Iran is related to the convergence between the Eurasia and Arabia plates, which occurs at about 40 mm yr-1 at longitude 600 E and is mostly accommodated by distributed shortening within the political borders of Iran (Berberian et al., 2001). While much of this shortening is taken up in the main earthquake and mountains belts of the Zagros, Alborz and Kope Dagh (Quttmeyer, R. C, and K. H. Jacob, 1979), some is also accommodated in central Iran, of which Kerman province is part. Recent and active deformation in Kerman province is dominated by NW- striking thrusts and N-to NNE striking right-lateral strike slip motion, related to the indentation of Iran by the Arabian shield (Berberian et al., 2000). We focus on the Gowk Fault system in south east of Iran ranges.
The essential purpose of this study is to determine fault rupture or source complexity, and prepare information about time history of displacement on the Gowk fault system. In addition we want to evaluate the seismic moment duration (Table 1). Figure 1 shows the geographical location of study area.
Table 1. List of seismic events had occurred in Kerman province during 26 years ago.
Date Time Lat. Lon. Mw
1981.06.11 07:24:24 29.86 57.68 6.58
1981.07.28 17:22:24 29.99 57.79 6.98
1989.11.20 04:19:07 29.90 57.72 5.83
Fig. 1. Iran map which shows the major fault zones and geographical regions. White arrow with 25mm/yr rate represents Arabia- Eurasia plate convergence (Vernant et al., 2007). Arabia- Eurasia convergence occurs in the Zagros, the Alborz, Kopeh Dagh, and possibly in central Iran by the rotation of strike-slip faults. Right lateral shear between central Iran and Afghanistan is taken up on N-S right –lateral faults of the Gowk-Nayband and Sistan suture zone systems, which surround the Dasht-e-Lut. The study area that marked by black box.
HISTORICAL AND INSTRUMENTAL EARTHQUAKES
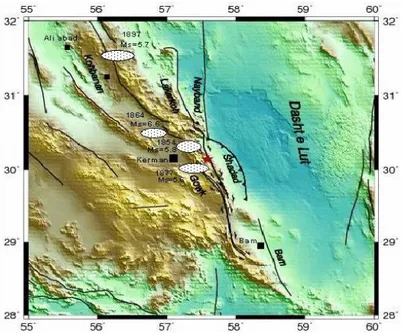
Study of historical earthquake records (Berberian, M., 1994) shows that some of damaging earthquakes had occurred in Kerman province (the capital of Kerman province is Kerman city) (figure 2). The most significant events are:
The 27 May 1897 earthquake with magnitude Ms=5.7 which affected a larger area, caused damage in the Kerman. In 17 January 1864, the Chatrood earthquake (Ms=6.0) occurred in the region. In April 1854, the Horjand earthquake (Ms =5.8, Io=VIII) occurred in northeast of Kerman. This catalogue shows that the earthquake had a same trend as Lakarkuh fault. In 1877 Sirch-Hasan-abad earthquake (Ms=5.6) destroyed some of villages (Ab-e-garm, Sirch, Hasan-Abad, Deh-Gholi and Hashtadan villages). Figure 3 shows the location of the five major instrumentally earthquakes with magnitudes of greater than 5 that have struck the cities and villages in Kerman province during the period of 1981 to 1998. These events are listed bellow:
1- The Golbaf earthquake of 11 June 1981, Ms6.7, 2- The Sirch earthquake of 28 July 1981, Ms7.1,
3- The South Golbaf earthquake of 20 November 1989, mb5.6,
4- The North Golbaf (Fandogha) earthquake of 14 March 1998, Mw6.6.
Sirch earthquake is the largest event recorded instrumentally in the Kerman province. The large earthquakes in 1981 were associated with a total 64 km of fresh movements along northern end of Golbaf (Gowk) fault and 10 km at the southern segment of Lakarkuh fault. Maximum vertical displacement of 10 cm were observed east of Golbaf, whereas after the second shock displacement of 14 cm vertical and 20 cm horizontal
(Dextral) were measured near Chahar-Farsang and Poshteh along the Lakarkuh fault system (Zohoorian et al., 1984).
Fig. 2. Map showing the location of some historical records in Kerman province, ( ).
Fig. 3. Tectonic map of the Gowk area and adjacent regions, we reported the main faults from IIEES reports. Beach balls show distribution and earthquake focal mechanisms of instrumentally recorded events with Mw ≥ 5.5 which occurred in study area.
LONG-PERIOD WAVEFORM MODELLING
Body waveform modeling has become one of the most important tools available to seismologist for refining earth structure models and understanding fault-rupturing process. Three component waveform data from the far-field GDSN stations were obtained for the selected earthquakes. IASPEI SYN4 algorithm (McCaffery et al., 1994), which is a recent version of (Nabelek, J. L., 1984) inversion procedure based on a weighted least squares method, was used for waveform inversion. The source time function (described
by a series of overlapping isosceles triangles) (McCaffery et al., 1994), centroid depth, and the fault orientation parameters (strike, dip, and the rake) are used in order to compute synthetic seismograms and the seismic moment.
The inversion procedure adjusts the relative amplitudes of the source time function element, the centroid depth, the seismic moment and source orientation. We refer to this solution as the minimum misfit solution. The Green's function for P and SH waves can be express in the form:
g(t)= CR(t)M(t)gS(t) (1) Where gS(t) is the displacement of the P or SH waves emerging at the base of the crust in the source region in response to a impulse, M(t) and CR(t) are the responses to these waves by the mantle and crust at the receiver respectively (Taymaz, T. 1990).
Amplitudes are corrected for geometrical spreading and attenuation is introduced with a t*=1s for P wave and t*= 4 s for SH wave (Nabelek, J. L., 1984). As explained by (Fredrich et al., 1988) uncertainties in t effect mainly the source duration and seismic
moment, rather than the source orientation or centroid depth .
The seismic moment clearly depends on the duration of the source time function, and to some extends on centroid depth and velocity structure (Taymaz, T., 1990). We estimated the lengths of time functions by increasing the number of isosceles triangles until the amplitudes of the later ones became insignificant.
INVERSION RESUALTS
The focal mechanism of the 1998 March 14 earthquake was computed by inverting 26 P-and 15 SH- Long-Period waves with good azimuthally coverage (Fig. 4). Having found a set of acceptable source parameters, we followed the procedure described by MaCaffrey (McCaffery , R . & Nabelek, J., 1987), (Nelson et al., 1987) , (Fredrich et al., 1988), in which the inversion routine is used to carry out experiments to test how well individual source parameters are resolved. We investigated one parameter at a time by fixing it at a series of values either side of its value yielded by the minimum misfit solution, and allowing the other parameters to be found by the inversion routine. We then visually examined the quality of fit between observed and synthetic seismograms to see whether it had deteriorated from the minimum misfit solution. In this way we were able to
estimate the uncertainty in strike, dip, rake and depth for each event (figure 5).
Fig. 4. Map of Incorporated Research Institutions for Seismology (IRIS) stations (∆ =30o-90o) which their seismograms are used in this study, show the appropriated azimuthally distribution. The triangles show the station location, and alphabetic marks show the station code.
Fig. 5. Test to check of the inversion of 1998 Mach 14 event (sensitivity of source parameters). Synthetic seismograms are doted, observed are solid lines. The first line in each shows the minimum misfit solution. P and SH focal spheres are shown, with the time function and numbers showing the strike, dip, rake, centroid depth and seismic
moment. First box shows the HRV CMT tests, first line in this box indicate the best fit in this study, second line is the HRV solutions with all parameters fixed, and the last line shows the CMT solutions Depth free. We carried out the velocity structure in this study a half space of Vp = 6.5 kms-1, Vs =3.7 kms-1, and ρ =2.85 gcm-3,respectively. The boxes show the depth, strike, dip, and rake tests.
Fig. 6. Minimum misfit solution for the 14 March 1998 earthquake in Gowk fault (Table 2) showing P (top) and SH (bottom) observed (solid) and synthetic (doted) waveforms. Waveforms for each station are arranged azimuthally around the focal spheres. Station positions on focal spheres are identified by capital letters and arranged clockwise starting from north. STF is the source time function. Vertical ticks on the seismograms indicate the inversion window. Numbers beneath the header line are strike, dip, rake, centroid depth (km) and scalar moment (N.M). Stations were weighted according to azimuthally density and then S seismograms weights were halved, to compensate for their larger amplitudes. P and T axes are represented by a black and white dot.
The synthetic seismogram solution indicates right lateral strike-slip on a fault dipping 54o (± 5o ) NW, with a strike of 158o (-10o/+11o), a rake of 200o (-11o/+9o) a hypocentral depth of 4 km (± 2 ), a source time function with a duration of 10 seconds while the 95%
of the energy was abruptly released within first 9 sec., and a scalar moment of 1.319 ×10¹⁹ N.m (figure 6), (table 2). We carried out all inversions on supposed a half space with Vp = 6.5 km.s-1, Vs = 3.7 km.s-1, and ρ = 2.85 gr.cm-3. Our solution is good agreement with the published in the Harvard CMT catalogue and (Beberian et al., 2001), except in seismic moment that our result indicates a larger value than those obtained in previous studies (see Table 2.) and we think it is more consistence‘s with observed average displacement.
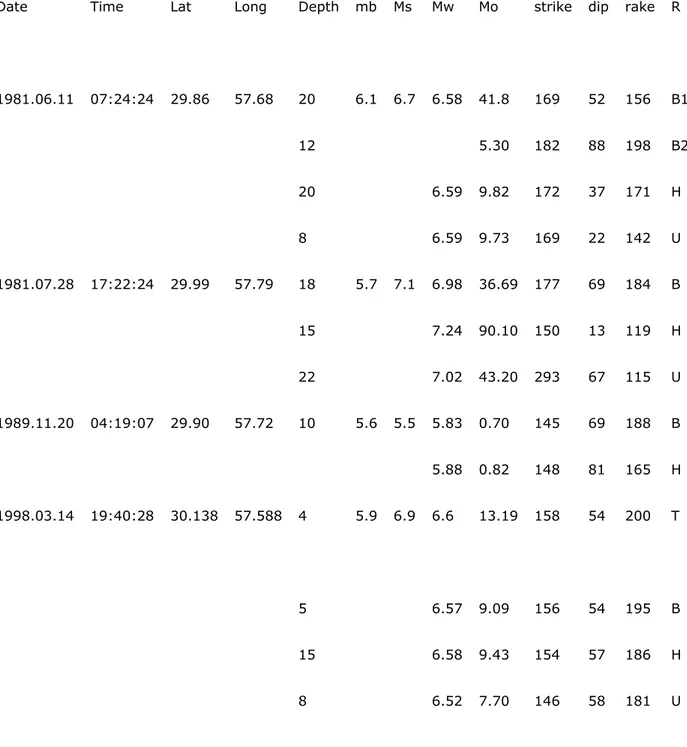
Table 2. Table 2. Source parameters of recent earthquakes of Gowk region. Seismic moment (M0) is in units of 1018 N.M. The last column gives the earthquake source parameters on each line: from body wave modeling in this paper (T, this study) and Berberian (Berberian, M., et al., 2001). (B, with B1and B2 signifying the first and second subevents in the 1981 June 11 earthquake) or from the CMT solutions by Harvard (H) or USGS (U).
Date Time Lat Long Depth mb Ms Mw Mo strike dip rake R
1981.06.11 07:24:24 29.86 57.68 20 6.1 6.7 6.58 41.8 169 52 156 B1 12 5.30 182 88 198 B2 20 6.59 9.82 172 37 171 H 8 6.59 9.73 169 22 142 U 1981.07.28 17:22:24 29.99 57.79 18 5.7 7.1 6.98 36.69 177 69 184 B 15 7.24 90.10 150 13 119 H 22 7.02 43.20 293 67 115 U 1989.11.20 04:19:07 29.90 57.72 10 5.6 5.5 5.83 0.70 145 69 188 B 5.88 0.82 148 81 165 H 1998.03.14 19:40:28 30.138 57.588 4 5.9 6.9 6.6 13.19 158 54 200 T 5 6.57 9.09 156 54 195 B 15 6.58 9.43 154 57 186 H 8 6.52 7.70 146 58 181 U
SOURCE TIME FUNCTION
The teleseismic source time function gives information about fault ruptures or source complexity. Studies of source complexity are also important to evaluate the validity of asperity models of faulting, where the fault is characterized by localized regions of higher strength. The physical features of teleseismic source time functions appraise the source complexity of the earthquakes. These features include the overall duration, multiple or single event character, individual source pulse widths, and roughness of the time function. The measures of source size and complexity can then be compared with the age of subducted lithosphere, plate convergence rate, and other physical parameters of subduction zone (Hartzell, S. H., and Heaton, T. H., 1985). The earthquakes larger than about Ms 6.9 can rarely be represented by a single point source, even at the wavelengths recorded by the WWSSN 15-100 long period instruments (with a peak response at a bout 15 s period). These earthquakes usually consist of several discrete ruptures, separated by several seconds in time and several km in space (Kanamori, H. & Stewart, G. S., 1987), often occurring on faults with different orientations (Butler et al., 1979).
PREVIOUS WORKS
Three measures of source duration of an earthquake have been reported in the literature (Fig.7 taken from Singh et al.[16]): the total rupture duration (t), the pulse duration of each subevent of a complex earthquake (p), and rise time (r) (Singh et al., 2000). It is well known that a constant stress drop source model implies that Mo /3 is a constant. For shallow earthquakes the reported values of Mo/t3 lie between 0.251023 and 1.01023 dyne cm/s3 (Kanamori, H., and J.W.Giwen., 1981), (Furumoto, M., and I. Nakanishi., 1983), (Ekstom , G., R.Engahl., 1989), (Ekstom et al., 1992). These results were obtained from the analysis of teleseismic data. Kikuchi and Ishida (Kikuchi, M., and M. Ishida., 1993) studied source time function (STF) and subevent pulse duration, p, of earthquakes in the Kanto region of Japan, which were recorded by broadband seismographic network near the epicentral region.
Fig. 7. An example of three measures of source duration of an earthquake (taken from Singh et. al., 2000).
INTERPRETATION AND CONCLUSION
The 11 June 1981 Golbaf earthquake produced surface ruptures on two subparallel N-S strands of the Gowk fault system. Displacement were small, typically with 3 cm right-lateral strike slip and 5 cm vertical offset on the longer eastern fault and hairline cracks on the shorter western one (Berberian et al., 1984), (Priestly et al., 1994), (Jackson ET AL., 2000). This event shows a complex rupture process, involving slip in at least two
sub events of different orientation (Berberian et al., 1984). We can see clearly same pattern in STF (Fig. 8). The complexity of the source time function as evidenced by the complexity of the body phases, low fault rupture velocity, is explained in terms of a multiple source.
The STF of 28 July 1981 Sirch earthquake have larger moment release in the second part of the process and consisted several impulses that can be interpreted as a more complex rupture process (Fig.8). These earthquakes have larger moment release in the second part of the process, while ratios of subevent for foreshock occurs in the first part and initiate with small release followed after 4s.
The STF of 20 November 1989 and 14 March 1998 earthquakes started with a high release of energy in first part of subevent one. Varying the seismic moment along total duration of STF is direct related to varying the source velocity structure did have an effect on centroid depth and seismic moment. In addition uncertainties in attenuation factor, t*, mainly affect estimates of source duration and seismic moment. The STF of these events show that the rupture characteristics contain a different size of subevents with same shape and same rupture history. The rise time of subevent 1 is larger than another subevents and most part of seismic moment release in first rupturing process. The nature of this function shows that the faulting consists of several fractures separated by strong barriers, which remain unbroken after the event. If the barriers are completely broken, there may be no aftershocks within the main-shock fault plane.
We have used that the corner frequency is very approximately given by f0 =1/p where
p is the largest pulse duration (Table 3) (Helmberger, D. V. and S. D. Malone., 1975), (Husebye, E. S. Mykkeltveit, S., 1980). The essential purpose of calculates the corner frequency is evaluating the source dimension. Then we have calculated source radius using Brune (Brune, J. N., 1970) relation for a circular fault (Table 3). We used 3.5 km/ sec for rupture velocity.
R = 2.34 v /2f0
The seismic moment, Mo, is given by Mo = Au where is the rigidity (3 1010Nm-2), A is the fault area, and u is the average displacement. Let us assume that the fault is roughly circular in area with diameter L, and that the ratio u /L are 510-5 (see e.g. Scholz, Aviles Wessnousky., 1986 ). The displacement value for each event calculated by using above assuming (Table 3),.
Fig. 8. Far-field source time functions of the 3 January 1969, 30 July 1970, 22 February 1984, 6 March 1986, 14 February 1971, 17 September 1989, 28 November 1991 earthquakes showing emergent seismic moment release (see Priestley et. al., 1994, Jackson et. al., 2002).
Table 3. Source parameters of largest sub- events that is observed from source time functions.
No Date fo (hz) r0 (km) t (sec) Displacement (km)
1 1981.06.11 0.063 20.69 5 2×10⁻³
2 1981.07.28 0.013 100 25 0.01
3 1989.11.20 0.16 8.14 2 8.14× 10⁻⁴
4 1998.03.14 0.053 24.59 6 2.4× 10⁻³
ACKNOWLEDGMENTS
This work is related to Ph.D. project (5323 code) of the first author at International Institute of Engineering Earthquake and Seismology (IIEES). We would like to thank the IRIS team for providing the data and Harvard University for providing the CMT solutions. We thank Professor Engdahl who kindly provided us with the final catalogue for events in the area of Iran. Special thanks Professor James Jackson, Dr. Kith Priestly, Dr. Alessia Maggi, and Dr. Piter Zwick for their helpful comments during this researchThe authors should place their acknowledgements here.
REFERENCES
Berberian, M., Jackson, J. A., Fielding, E., Parsons, B, E., Priestley, K., Qorashi, M., Berberian, M., (1994). Natural Hazards and First Earthquake Catalogue of Iran. V.1. Historical Hazards in Iran Prior to 1900. International Institute of Earthquake Engineering and Seismology (IIEES), P.603.
Berberian, M., Jackson, J.A., Qorashi, M., Talebian, M., Khatib, M., Priestley, K., (2000). The 1994 Sefidabeh Earthquakes in Eastern Iran:blind Thrusting and Bedding-Plane Slip on a Growing Anticline, and Active Tectonics of the Sistan Suture Zone. Gophys. J. Int. 142, 283-299.
Berberian, M., & Jackson, J.A., Qoreshi, M. Kadjar, M.H., (1984). Field and Teleseismic Observations of the 1981 Golbaf-Sirch Earthjquakes in SE Iran, Geophys. J. R. astr.
Soc, 77, 809-838.
Brune, J. N., (1970). Tectonic Stress and the Spectra of Seismic Shear Waves from Earthquakes, J. Geophys. Res., 75, 4997-5009.
Butler, R., Stewart, G. S. and Kanamori, H., (1979). The July 27 1976 Tangshan China Earthquake –a Complex Sequence of Intraplate Events, Bull. Seism. Soc. Am., 69, 207-220.
Ekstom, G., R.Engahl., (1989). Earthquake Source Parameters and Stress Distribution in the Adak Island Region of the Central Aleutians Islands, J. Geophys. Res. 94. 15499-15519.
Ekstom, G., R. S. Stein, J. P. Eaton, and D. Eberhart-Phillips. (1992). Seismicity and Geometry of a 100-km Long Blind thrust 1. The 1985 Ketleman Hills, California Earthquake, J. Geophys. Res. 97, 4843-4863.
Fredrick, J., McCaffrey, R. Denham, D., (1988). Source Parameters of Seven Large Australian Earthquakes Determined by Body Waveform Inversion. Geophys. J., 95, 1-13.
Furumoto, M., and I. Nakanishi. (1983). Source Time Scaling Relation of Large Earthquakes, J. Geophys. Res. 88, 2191-2198.
Hartzell, S. H., and Heaton, T. H., (1985). Teleseismic Time Functions for Large Shallow Subduction Zone Earthquakes, Bull. Seism. Soc. Am., 965-1004.
Helmberger, D. V. and S. D. Malone. (1975). Modeling Local Earthquakes as Shear Dislocations in a Layered Half-Space, J. Geophys. Res. 80, 4881-4888.