Contents lists available atScienceDirect
Energy Conversion and Management
journal homepage:www.elsevier.com/locate/enconmanPyrolytic kinetics, reaction mechanisms and products of waste tea via
TG-FTIR and Py-GC/MS
Haiming Cai
a, Jingyong Liu
a,⁎, Wuming Xie
a, Jiahong Kuo
a, Musa Buyukada
b, Fatih Evrendilek
c,daGuangzhou Key Laboratory of Environmental Catalysis and Pollution Control, Guangdong Key Laboratory of Environmental Catalysis and Health Risk Control, School of Environmental Science and Engineering, Institute of Environmental Health and Pollution Control, Guangdong University of Technology, Guangzhou 510006, China bDepartment of Chemical Engineering, Bolu Abant Izzet Baysal University, Bolu 14052, Turkey
cDepartment of Environmental Engineering, Bolu Abant Izzet Baysal University, Bolu 14052, Turkey dDepartment of Environmental Engineering, Ardahan University, Ardahan 75002, Turkey
A R T I C L E I N F O Keywords: Waste tea Pyrolysis Kinetic Master-plots TG-FTIR Py-GC/MS A B S T R A C T
The present study experimentally quantified the pyrolysis behaviors of waste tea (WT) as a function of four heating rates using thermogravimetric-Fourier transform infrared spectrometry and pyrolysis-gas chromato-graphy-mass spectrometry analyses. The maximum weight loss of WT (66.79%) occurred at the main stage of devolatilization between 187.0 and 536.5 °C. The average activation energy estimates of three sub-stages of devolatilization were slightly higher (161.81, 193.19 and 224.99 kJ/mol, respectively) by the Flynn-Wall-Ozawa than Kissinger-Akahira-Sunose method. Kinetic reaction mechanisms predicted using the master-plots were f (α) = (3/2)(1 − α)2/3[1− (1 − α)1/3]−1, f (α) = (1 − α)2, and f (α) = (1 − α)2.5for the three sub-stages, re-spectively. The prominent volatiles of the WT pyrolysis were CO2> C]O > phenol > CH4> Ce O > NH3> H2O > CO. A total of 33 organic compounds were identified including alkene, acid, benzene, furan, ketone, phenol, nitride, alcohol, aldehyde, alkyl, and ester. This study provides a theoretical and practical guideline to meeting the engineering challenges of introducing WT residues in the bioenergy sector.
1. Introduction
Globally, the biomass feedstocks of bioenergy crops, and agri-cultural and forestry residues are considered to be the fourth largest resource of primary energy[1]. In particular, various biomass residues (e.g., pine sawdust, wheat straw, rice straw, and rice husk) have been explored as a renewable and clean energy resource to generate elec-tricity, hydrogen, and liquid fuels [2,3]. For example, their use in bioenergy production via high-tech pathways such as pyrolysis has been relied on in restricting global mean temperature rise to 1.5 °C above pre-industrial by the end of this century [4–6]. Tea industry is con-sidered to be the most common non-alcoholic beverage worldwide and produces large amounts of waste tea (WT). In 2015, the amount of the global tea production was 5.3 million tons 2.27 million tons of which were from China, and over 90% of which was left after consumption as WT [7,8]. The utilization potential of WT has been quantified in the domains of feeding animals[9], synthesizing silver nanoparticles[10], preparing microcrystalline cellulose [8], and developing an efficient adsorbent to remove mercury[11]. However, for generating bioenergy via pyrolysis, there exist a very few studies in related literature.
Pyrolysis of various biomass feedstocks such as para grass, wood sawdust, and moso bamboo has been studied owing to its energy effi-ciency and environmental advantages[12–14]. The fast pyrolysis of WT can also yield high bioenergy in the forms of char, liquid and gas productions[15]. However, to meet the engineering challenges of de-signing the WT pyrolysis process in the bioenergy sector necessitates the better quantification and understanding of its pyrolysis behaviors, kinetics and products[16,17].
Thermogravimetric (TG) analyses and estimates provide a guidance on the feasibility, design, and optimization of the sustainable bioenergy systems[4,18]. The use of the iso-conversional methods has led to the reliable estimation of the kinetic triplets of the apparent activation energy (Eα, kJ/mol), the pre-exponential factor (A), and the kinetic model f (α) [19]. Their model-free approaches such as Flynn-Wall-Ozawa (FWO), and Kissinger-Akahira-Sunose (KAS) cannot directly lead to a reaction kinetic model[20]. The model-fitting approaches can yield Eaand A estimates based on a priori knowledge of reaction me-chanism functions[21]. For example, the master-plots constitute the theoretically baseline curves using differential f (α) as well as integral g (α) functions, regardless of Eaand A. The master-plots method depends
https://doi.org/10.1016/j.enconman.2019.01.031 Received 31 October 2018; Accepted 13 January 2019
⁎Corresponding author.
E-mail address:[email protected](J. Liu).
Available online 06 February 2019
0196-8904/ © 2019 Elsevier Ltd. All rights reserved.
on kinetic models instead of kinetic parameters of the process by comparing experimental master plots to theoretical ones, thus pro-viding insight into the mechanism(s) of the pyrolysis process[22,23]. Thus, the model-free and model-fitting methods should be combined to estimate the kinetic parameters as well as the reaction mechanisms.
Thermogravimetric analysis coupled with Fourier transform in-frared spectroscopy (FTIR) and pyrolysis-gas chromatography/mass spectrometry (Py-GC/MS) is the most common method to estimate the pyrolysis behaviors and products of biomass residues [24–28]. The main pyrolytic products identified using TG-FTIR were H2O, CH4, CO2, CO, NO, NO2, and carboxylic acids from moso bamboo[14]. The bio-crude-oil products were identified from Ceylon refused WT using TG-FTIR[29]. TG-FTIR was also used to determine the evolutions of gases from the pyrolysis process for WT[30]. The chemical characteristics and composition of theabrownin formed in Pu-erh teas were de-termined using Py-GC/MS [31]. However, the pyrolytic products re-leased in the complex reactions have been found to be more accurately determined using the combination of TG-FTIR and Py-GC/MS analyses [32,33]. For example, Chen et al. [32]accurately estimated the co-pyrolysis products of Chlorella vulgaris and kitchen waste using both TG-FTIR and Py-GC/MS.
There exists a knowledge gap in related literature about bioenergy production via the pyrolysis of WT as an abundant feedstock. Therefore, the objective of this study was to quantify the pyrolysis degradation behaviors, kinetics and products for WT by using the combination of TG-FTIR and Py-GC/MS analyses.
2. Materials and methods
2.1. Sample preparation
Waste tea was produced from soaking tea leaves in 100 °C water for several times. Soaked WT was dried naturally under good ventilation for 24 h and then in an oven at 105 °C for 24 h for the further removal of moisture. The samples were grounded into 200 mesh before the ex-perimental runs. The ultimate, proximate and higher heating value (HHV) analyses of WT are presented inTable 1. The components of WT were measured in triplicates using the wet chemistry method of Van Soest[20].
2.2. TG-FTIR experiments
A thermogravimetric analyzer (NETZSCH STA 409 PC Luxx) was used to quantify the non-isothermal pyrolysis behaviors of WT in the inert (100% N2) atmosphere. The sample was heated from 30 to 900 °C at the four heating rates of 5, 10, 20 and 40 °C/min. The N2flow rate was held constant at 60 mL/min. The program control procedures of temperature-rise, atmosphere type, and gasflow rate were set before-hand. The initial sample masses were kept the same (6 ± 0.5 mg) for the analyzer in each experiment to ensure the comparability of the pyrolysis parameters. To ensure their repeatability, all the experimental
runs were conducted at least twice.
Gases evolved from the pyrolysis process at 10 °C/min were de-tected using FTIR (Nicolet iS 50 FTIR spectrometer). FTIR spectra were observed at a rate of 8 scans per sampling at a resolution of 4 cm−1in the wavenumber range of 4000 to 600 cm−1. The purge and evolved gases from the TG pyrolysis furnace were transferred into the FTIR gas cell via a heated transfer line. The temperature of the capillary bundle was heated to 260 °C before the experiment to avoid the liquefaction of gases that passed through the capillary bundle. The test data were processed using the OMNIC software (Thermo Electron, USA).
2.3. Py-GC/MS experiments
Pyrolysis-gas chromatography/mass spectrometry was used to dis-tinguish and identify the pyrolytic volatiles. At the pyrolysis stage, Frontier Lab PY-2020id was used as a pyrolysis reactor to conduct the pyrolysis at 600 °C for 24 s using purified He as the carrier gas. The volatiles products were separated using a chromatographic column with HP-5MS capillary (30 m × 0.32 mm × 0.25μm) whose tempera-ture was increased from 40 °C for 2 min to 300 °C for 10 min at a rate of 8 °C/min. The mass spectra were obtained in an electron ionization mode at 70 eV. The yields of the compounds were computed using the GC–MS spectra characterized according to the standard solution cali-bration, NIST library database, and previously published reports.
2.4. Kinetic analyses
The kinetic analysis can reveal the effect of reaction temperature and time on the thermal degradation during the pyrolysis process of a given biomass material [35]. The pyrolysis reaction kinetics can be stated thus:
Nomenclature
WT waste tea
β heating rate (K/min)
TG-FTIR thermogravimetric-Fourier transform infrared spectro-metry
Py-GC/MS pyrolysis-gas chromatography/mass spectrometry E apparent activation energy (kJ/mol)
A pre-exponential factor (s−1) R2 coefficient of determination α conversion degree
T the absolute temperature (K)
t reaction time
FWO Flynn-Wall-Ozawa method KAS Kissinger-Akahira-Sunose method TG mass loss
DTG derivative mass loss HHV higher heating value CO2 carbon dioxide CO carbon monoxide CH4 methane NH3 ammonia gas H2O water 3-D three dimensional Table 1
Ultimate, proximate and HHV analyses of WT.
Sample WT
Ultimate analysis (wt%, dry basis) C 47.99 ± 0.04 [34]
H 6.60 ± 0.04
O 28.73 ± 0.10
N 4.90 ± 0.07
S 0.18 ± 0.02
Proximate analysis (wt%, dry basis) Moisture 5.45 ± 0.03 Volatiles 82.31 ± 0.04 Ash 6.15 ± 0.06 Fixed carbon 6.09 ± 0.07 Qnet(MJ/kg) 20.86 ± 0.33 Composition Hemi-cellulose 20.64 ± 0.23 Cellulose 7.06 ± 0.14 Lignin 20.04 ± 0.08 O (wt%) = 100%– C – H – N – S – moisture – ash; Fixed carbon = 100 – moisture– ash – volatiles.
= dα
dt k T f α( ) ( ) (1)
whereα, t, T, k(T), and f (α) are conversion degree, reaction time, the absolute temperature (K), the reaction rate constant, and the reaction mechanism function, respectively.α and k(T) can be determined using Eqs.(2) and (3): = − − α m m m m t f 0 0 (2) = ⎛ ⎝− ⎞ ⎠ k T Aexp E RT ( ) a (3) where m0, mtand mfis the initial, actual andfinal masses of the sam-ples, respectively. R is the gas constant (8.314 J/K mol).
=
β dT dt/ , and combining Eqs.(1) and (3)leads to the following:
= ⎛ ⎝− ⎞ ⎠ dα dt A β E RT f α exp a ( ) (4) Performing the integration and transformation on Eq.(4)under the initial conditions (α= 0, at T = T0), Eq.(5)can be obtained thus:
∫
∫
= − = ⎛⎝− ⎞⎠ α dα α A β E RT G( ) 1 exp dT α T 0 0 a (5) The Eq.(5)is the basis of the most kinetic analyses employed in the related literature[36]. The reaction process is generally characterized combining the model-free and -fitting methods[22].2.4.1. Iso-conversional methods
In this study, the model-free non-isothermal methods of Flynn-Wall-Ozawa (FWO) and Kissinger-Akahira-Sunose (KAS) were adopted to determine the apparent activation energy [36,37]. As proposed by Doyle’s approximation, the FWO method can be stated thus[38]:
⎜ ⎟ = ⎛ ⎝ ⎞ ⎠ − − ⎛ ⎝ ⎞ ⎠ β AE RG α E RT ln ln ( ) 5.3305 1.052 a (6) As developed according to Coats-Redfern approximation, the KAS method can be described as follows[39,40]:
⎜ ⎟ ⎛ ⎝ ⎞ ⎠ = ⎛ ⎝ ⎞ ⎠ − β T AR EG α E RT ln ln ( ) 2 a (7) In the plots ofln
( )
βT2 versus 1/T, and lnβ versus 1/T, the slope of
−Ea/R yields the activation energy estimate. 2.4.2. Integral master-plots method
The master-plots serve to pinpoint the reaction models of the thermal degradations. In this method, the integrated form of Eq.(5)can be expressed as follow[41]: = G α AE βRP u ( ) ( ) (8) where u = E/RT, and P (u) is the temperature integral. P (u) can be approximated using the empirical equations since it has no analytical solution. When the Tang–Liu–Zhang–Wang–Wang approximation is applied to the master-plots, the deviation of the numerical solution for P (u) at u > 14 becomes less than 0.1%[42,43].
= − × + p u exp u u u ( ) ( ) (1.00198882 1.87391198) (9)
For a single step degradation with a constant G (α), the appropriate kinetic model was confirmed using the master-plots where Eaand A values were estimated usingα = 0.5 as the baseline point. Thus, Eq.(8) was expressed as follows:
=
G AE
βRP u (0.5) ( 0.5)
(10) where u0.5= E/RT0.5. G (0.5) is the integral reaction model atα = 0.5; T0.5is the temperature atα = 0.5.
The ratio of Eq.(8)to Eq.(10)can be expressed as follows:
= G α G P u P u ( ) (0.5) ( ) ( 0.5) (11)
This differential kinetic equation is among the most common ap-plications of the Moment Propagation method.
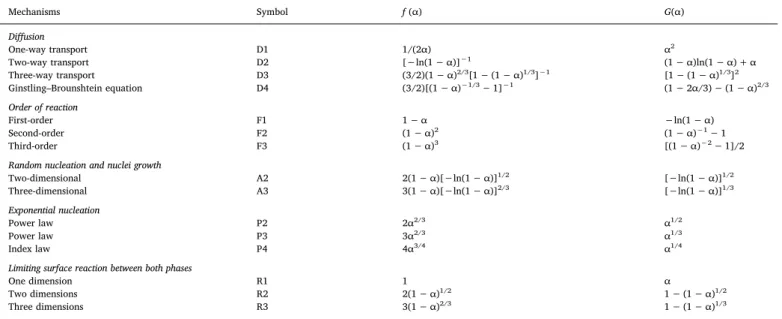
Table 2presents the most common reaction models—G (α)—of the thermal degradations. To obtain the best model, the theoretical G (α) /G (0.5) and experimental P (u) /P (u0.5) values versus x were plotted, respectively. As can be seen in Eq.(11), for a given x, the P (u) /P (u0.5) and G (α) /G (0.5) values are equivalent. If an inappropriate G (α) ki-netic model was used, a greater difference between the theoretical versus experimental values would appear in the master-plots.
Table 2
The most common kinetic models, and their corresponding mechanisms for a solid state process[43].
Mechanisms Symbol f (α) G(α) Diffusion One-way transport D1 1/(2α) α2 Two-way transport D2 [−ln(1 − α)]−1 (1− α)ln(1 − α) + α Three-way transport D3 (3/2)(1− α)2/3[1− (1 − α)1/3]−1 [1− (1 − α)1/3]2 Ginstling–Brounshtein equation D4 (3/2)[(1− α)−1/3− 1]−1 (1− 2α/3) − (1 − α)2/3 Order of reaction First-order F1 1− α −ln(1 − α) Second-order F2 (1− α)2 (1− α)−1− 1 Third-order F3 (1− α)3 [(1− α)−2− 1]/2
Random nucleation and nuclei growth
Two-dimensional A2 2(1− α)[−ln(1 − α)]1/2 [−ln(1 − α)]1/2 Three-dimensional A3 3(1− α)[−ln(1 − α)]2/3 [−ln(1 − α)]1/3 Exponential nucleation Power law P2 2α2/3 α1/2 Power law P3 3α2/3 α1/3 Index law P4 4α3/4 α1/4
Limiting surface reaction between both phases
One dimension R1 1 α
Two dimensions R2 2(1− α)1/2 1− (1 − α)1/2
3. Results and discussion 3.1. Thermogravimetric analyses
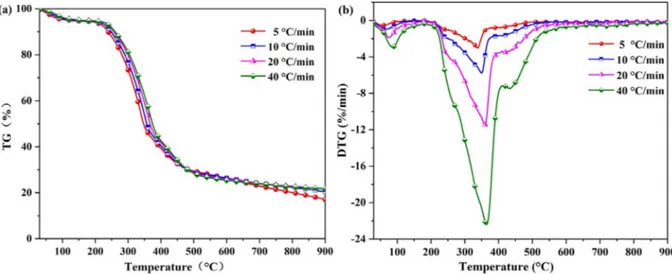
As the initial stage of the combustion and gasification processes of a given biomass type mainly composed of (hemi-)cellulose, and lignin, the pyrolysis process plays an important role in determining ignition, flame stability, products, and burnout[44]as well as obtaining char, gas and bio-oil products at different temperatures[29,45]. The (D)TG curves of the WT pyrolysis in the N2atmosphere under the four heating rate are presented inFig. 1.Fig. 1a and b showed that the (D)TG curves shifted towards the higher temperature with the increased heating rate, without affecting the pattern of the thermal degradation. This can be attributed mainly to the better heat transfer effect gained with lower sample particles[34,46].Fig. 2showed that the pyrolysis process of WT at 10 °C/min can be divided into the following three stages: drying at < 187.0 °C; devolatilization between 187.0 and 536.5 °C; and de-gradation of char and minerals > 536.5 °C.
The weight loss of WT was due to the evaporation of water at the low temperature in the first stage and corresponded to the range of 187.0 to 536.5 °C in the second stage of devolatilization (the main stage). The total weight loss of 66.79% in this main stage was related to the higher release of volatiles from the degradation of the organic compounds such as (hemi-)celluloses, partial lignin and other macro-molecular substance as well as to the lowerfixed carbon content of the sample. The peakfitting tool of Origin 9.0 was applied to divide the thermal degradation process of the main stage (devolatilization) into the three sub-stages, as was also applied to the thermal degradation of oily sludge, petrochemical wastewater sludge and hydrotalcite [22,42,43]. In thefirst sub-stage, the weight loss was mainly tied to the degradation of hemi-cellulose whose main degradation temperature was between 187.0 and 315.0 °C (Fig. 2). Hemi-cellulose with a lower degree of polymerization is a mixture of various polymerized mono-saccharides such as xylose, mannose, glucose, galactose, and arabinose [15]. In the second sub-stage (315.0–385.0 °C), the weight loss was mainly due to the degradation of cellulose and part of lignin. Cellulose is a high-molecular compound with a long linear chain composed of D-glucosyl group[47]and has a crystalline structure made up of ordered microfibrils that renders its thermal degradation more difficult than that of hemi-cellulose[27]. In the third sub-stage (385.0–536.5 °C), the degradation of lignin and macromolecular substances was more di ffi-cult than that of (hemi-)cellulose due to its complex composition. The pyrolysis of hemi-cellulose, cellulose, and lignin was reported to mainly occur from 200 to 300 °C, 300 to 400 °C, and 200 °C until the end of the pyrolysis process, respectively[14]. The maximum weight loss rate of
WT was estimated at 5.51%/min at 345.3 °C. The final stage (> 536.5 °C) appeared to stem from the slow thermal degradations of residuals such as chars, minerals, and ash as the part of thefinal solid residues [48]. The WT residues were estimated at 20.42% after the pyrolysis in the N2atmosphere.
3.2. Kinetics analyses
3.2.1. Apparent activation energy estimates
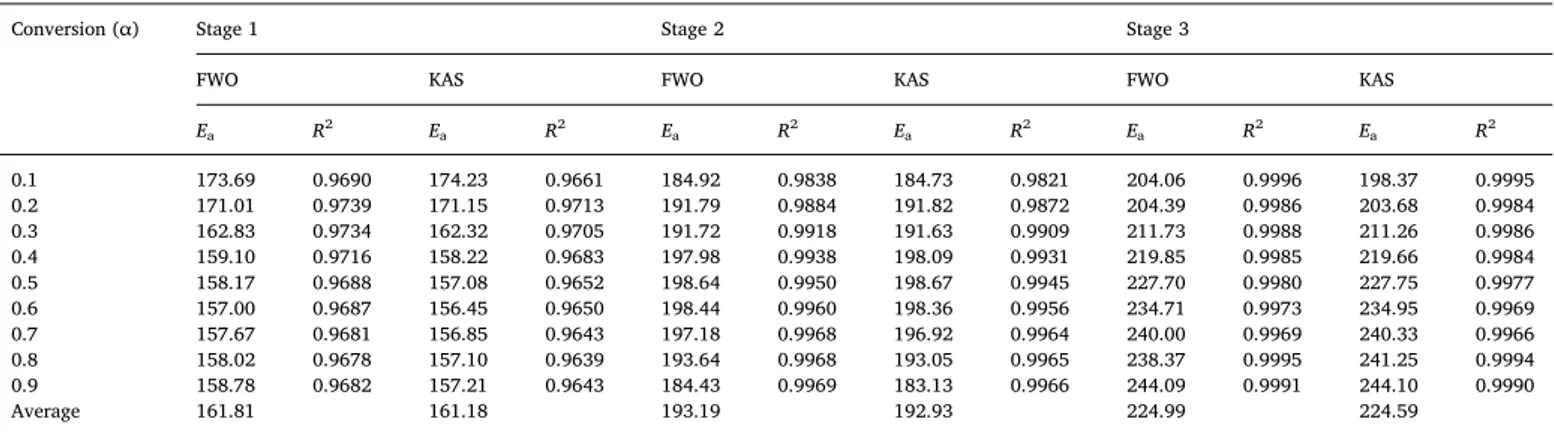
As recommended by the Kinetics Committee of the International Confederation for Thermal Analysis and Calorimetry[41], the para-meter estimations of the microscopic pyrolysis reactions were based on the iso-conversional methods[14]. Since the thermal decompositions at the start and end of each stage were not stable, the conversion rate (α) was selected to range from 0.1 to 0.9 at an interval of 0.1 in order to better reflect changes in Eavalues of WT. According to Eqs.(6) and (7), the Eavalues for the three sub-stages of the main devolatilization stage of the WT pyrolysis were estimated using the FWO and KAS methods at the four heating rates. As showed inFig. 3, the plots of lnβ (FWO) and ln [β/T2] (KAS) versus 1/T resulted in linear relationships for the given conversion degrees. The Eaestimates were derived from the slope of the regression lines (Table 3). The coefficients of determination (R2) ranged from 0.9639 to 0.9996.
The average Ea estimates for the three sub-stages were slightly higher (161.81, 193.19 and 224.99 kJ/mol, respectively) by the FWO
Fig. 1. (D)TG curves of WT pyrolysis at four heating rates: (a) TG and (b) DTG.
than KAS method. Since many different reactions in pyrolysis require different amounts of energy, the Eavalue varied with the conversion degrees [49]. Thefirst and second stages with the low and high Ea values were due to the thermal degradations of hemi-cellulose, and cellulose and partially lignin, respectively. Consistent with ourfinding, the Eavalue was found to be higher in the thermal degradation of cellulose than hemi-cellulose[48]. The increased Eain the third stage with the elevated temperature was due to the degradations of lignin, and coke with low reaction activity [15]. The increased Eawith the increased degree of pyrolysis at higher temperatures is consistent with the fact that the sample was more difficult to decompose [42]. The degradation process were found not to follow the same reaction me-chanism [48]. Since the average Eaestimates by the KAS and FWO methods were very close, their average values (161.50, 193.06 and 224.79 kJ/mol) were adopted in the integral master-plots.
3.2.2. Reaction model by master-plots
In order for the complete reaction kinetics to be understood, the pre-exponential factor (A), the model, and the order of reaction (n) need to be estimated. The solid state kinetic models can be found using the master-plots when Eais specified. The theoretical versus experimental master-plots are compared to obtain the most probable model [41]. Based on the predetermined Eavalue, and the temperature measured as a function ofα, P (u) can be estimated directly according to Eq.(9). The plots of P (u)/P (u0.5) versusα are shown inFig. 4a–c. The P (u)/P (u0.5) plots of each sub-stage under 5, 10, 20 and 40 °C/min were almost identical. This in turn suggested that the degradation kinetic me-chanism was constant regardless of the heating rate and can be de-scribed using a single model[19].
The theoretical master-plots—G (α) /G (0.5)—were computed using various kinetic functions (Table 2). The master-plots of P (u) /P (u0.5) Fig. 3. Kinetic plots of three sub-stages according to FWO and KAS.
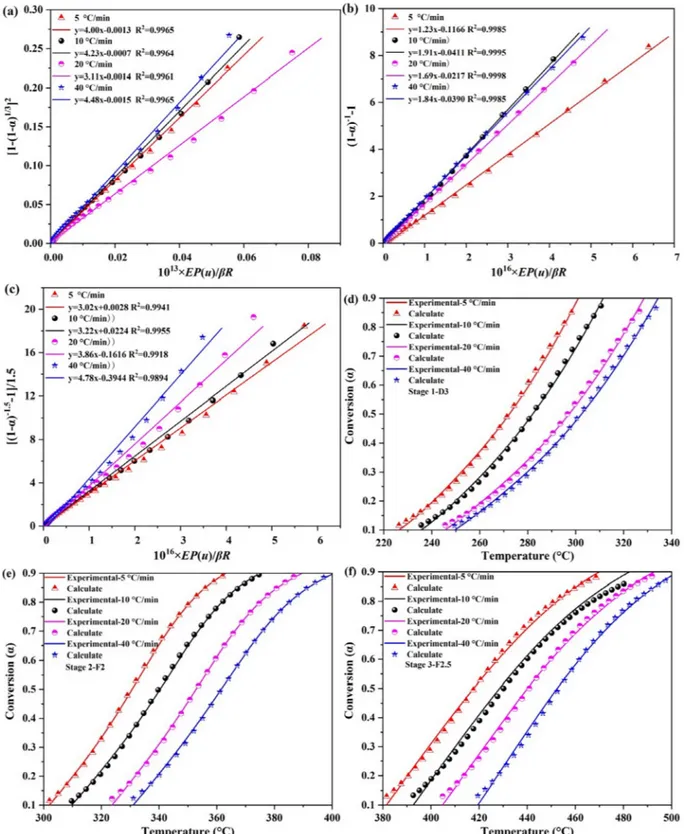
and G (α) /G (0.5) were compared for each sub-stage at 10 °C/min (Fig. 4d–f). The P (u) /P (u0.5) plots of the sub-stages 1 and 2 were close to D3 and F2 of the theoretical master-plots, respectively. The values of Eaand R2obtained by the different pyrolysis mechanisms are provided in Table 4. Eavalues of D3 (159.94 kJ/mol) and F2 (192.35 kJ/mol) were also consistent with the model-free methods. Therefore, the combination of the close P (u) /P (u0.5) plots and the Eavalues pointed to D3 and F2 as the best-fit mechanisms to describe the kinetics of sub-stages 1 and 2. However, thefinal sub-stage was located in between the theoretical master-plots F2 and F3, thus indicating that the Fn model f (α) = (1 − α)nbest described the kinetic process of this sub-stage. 3.2.3. Reaction order and pre-exponential factor
The last section showed that thefirst and two sub-stages had a de-terminate mechanism. To determine the reaction mechanism of the last sub-stage, the expression f (α) = (1 − α)n
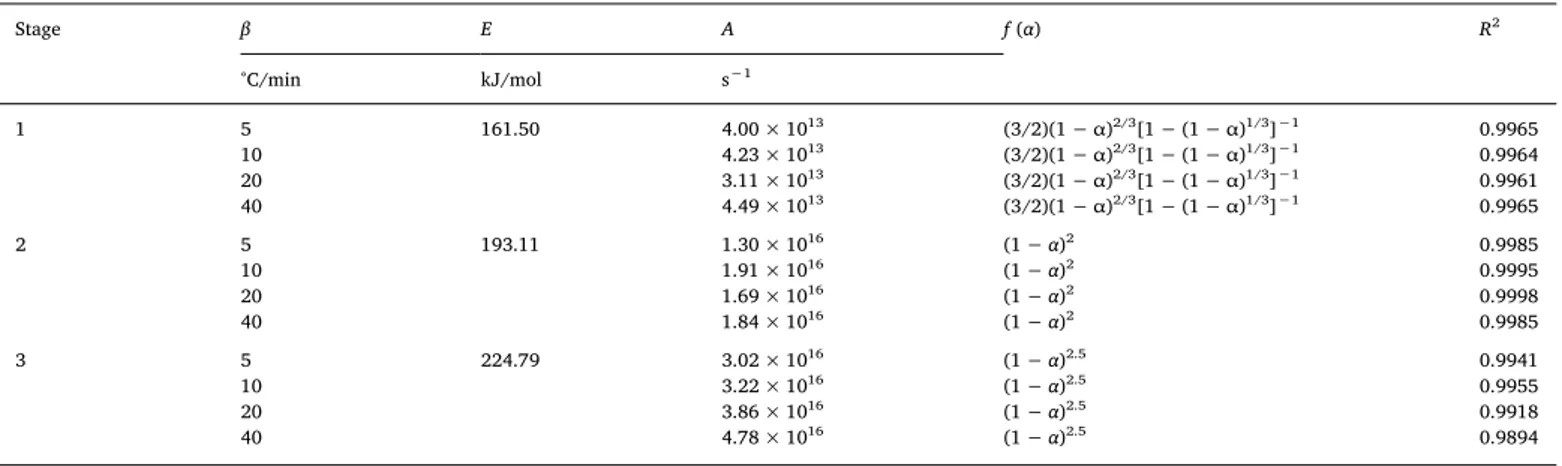
when introduced into Eq.(8) became thus: = = − − − − G α AE βRP u α n ( ) ( ) (1 ) 1 1 n 1 (12) To further test its optimal value, n was increased from 2.0 to 3.0 with an increment of 0.1 and a plot of [(1− α)1−n− 1]/(n − 1) versus EP (u)/βR was fitted a least-square regression line. The most potential n value for the three sub-stages were estimated with the closest zero in-tercept (Fig. 5a–c). The kinetic triplets of Ea, A, and f (α) for the three sub-stages of the main WT pyrolysis at 5, 10, 20 and 40 °C/min are shown inTable 5. The corresponding model functions were f (α) = (3/
2)(1− α)2/3[1− (1 − α)1/3]−1; f (α) = (1 − α)2; and f (α) = (1 − α)2.5 for the sub-stages, respectively.
For the validation of kinetic results,Fig. 5d–f showed the compar-ison of calculated versus experimental conversion curves for the three sub-stages. The goodfit between the calculated and experimental data indicated the accuracy of the kinetic analysis results to be used to de-sign a pyrolysis-processing system for WT as the feedstock in the bioenergy sector.
3.3. TG-FTIR analyses
The online gas-phase characteristics as a function of the pyrolysis temperature were detected using the FTIR spectra [50]. The macro-molecules of (hemi-)cellulose, and lignin are subjected to the reactions of cross-link polymerization and dehydrogenation oxidation during the pyrolysis process and are in turn accompanied by the production of small molecule gases[14,51].Fig. 6a shows the 3-D FTIR diagram of the WT pyrolysis at 10 °C/min. The evolved gases at a peak value of 345.3 °C were identified using their characteristic absorbance (Fig. 6b). The gas products, and their functional groups are presented inTable 6. The change in the absorbance intensity of the volatile components with the temperature rise is presented inFig. 6c. The gas products of the WT pyrolysis were generated mainly in the devolatilization stage cor-responding to the range of 180 to 530 °C. At a lower temperature, all volatiles components appeared to originate mainly from hemi-cellulose. The concentrations of the gaseous products increased remarkably with the increased temperature. This was because cellulose, and partially, Table 3
Activation energy (Ea) estimates, and coefficients of determination (R2) based on FWO and KAS for the three stages of the main WT pyrolysis.
Conversion (α) Stage 1 Stage 2 Stage 3
FWO KAS FWO KAS FWO KAS
Ea R2 Ea R2 Ea R2 Ea R2 Ea R2 Ea R2 0.1 173.69 0.9690 174.23 0.9661 184.92 0.9838 184.73 0.9821 204.06 0.9996 198.37 0.9995 0.2 171.01 0.9739 171.15 0.9713 191.79 0.9884 191.82 0.9872 204.39 0.9986 203.68 0.9984 0.3 162.83 0.9734 162.32 0.9705 191.72 0.9918 191.63 0.9909 211.73 0.9988 211.26 0.9986 0.4 159.10 0.9716 158.22 0.9683 197.98 0.9938 198.09 0.9931 219.85 0.9985 219.66 0.9984 0.5 158.17 0.9688 157.08 0.9652 198.64 0.9950 198.67 0.9945 227.70 0.9980 227.75 0.9977 0.6 157.00 0.9687 156.45 0.9650 198.44 0.9960 198.36 0.9956 234.71 0.9973 234.95 0.9969 0.7 157.67 0.9681 156.85 0.9643 197.18 0.9968 196.92 0.9964 240.00 0.9969 240.33 0.9966 0.8 158.02 0.9678 157.10 0.9639 193.64 0.9968 193.05 0.9965 238.37 0.9995 241.25 0.9994 0.9 158.78 0.9682 157.21 0.9643 184.43 0.9969 183.13 0.9966 244.09 0.9991 244.10 0.9990 Average 161.81 161.18 193.19 192.93 224.99 224.59
Fig. 4. P (u)/P (u0.5) versus conversion degree for the four heating rates and the sub-stages of the WT pyrolysis (a) 1, (b) 2 and (c) 3; and G (α)/G (0.5) versus conversion degree for the 15 reaction models and the sub-stages of the WT pyrolysis (d) 1, (e) 2 and (f) 3 at 10 °C/min.
lignin began to disintegrate. In the higher temperature, the relative concentrations of volatiles components decreased gradually due to the degradation of lignin and cokes with low reaction activity. This was in line with the fact that the reactions occur at the higher temperatures with higher apparent activation energy when the recalcitrant materials are involved[42].
The peaks with the bands of 4000 to 3500 cm−1 indicated the
releases of H2O from the pyrolysis process [32]. The main release temperature of H2O was in the range of 180 to 530 °C. H2O was released mainly from the evolution of bulk water, bound water, and crystal-lization water in the mineral substance of the samples as well as from the cracking or reaction of oxygen functional groups in the pyrolysis process with the temperature rise[14,30].The absorbance peak in the range of 3115–2675 cm−1 was related to the release of CH4, with 2359 cm−1to the release of CO2. The release of CH4can be attributed to the cracking of methoxyl–O–CH3, which consists of hemi-cellulose, cellulose, and lignin. The yield of CH4rose greatly with the elevated pyrolysis temperature. The presence of a more obvious peak at 436 °C corresponding to the lignin pyrolysis may be caused by the abundant OeCH3content of lignin. CH4was reported to be generated as a result of several reactions during the pyrolysis thus: the free radical reaction (CH2/CH3+ H→ CH4) at the low temperatures; and the thermal de-gradations of methoxyl–O–CH3[52]and benzyl groups at the higher temperatures[42]. The CO2release occurred due to the cracking and reforming of functional groups of carboxyl (C]O) and COOH, the cracking and abscission of CeC and CeO bonds connected with the main branch of hemi-cellulose, the cracking of C]O groups in cellu-lose, and the breaking of lateral CeC bonds[52]. A weak peak of CO2 between 600 and 800 °C was attributed to the secondary degradation of C]O and CeO compounds, thus leading to the breaking chains and the reforming reactions. The absorbance waves between 2240 and 2060 cm−1were related to the release of CO. The CO was detected although its concentration was not obvious. It was produced mainly by the degradation of carbonyl (CeOeC) and carboxyl (C]O) with poor Fig. 4. (continued)
Table 4
Eavalues (kJ/mol) of various pyrolysis mechanisms estimated by master-plots for the three sub-stages at 10 °C/min.
Mechanism Stage 1 Stage 2 Stage 3
Ea R2 Ea R2 Ea R2 D1 125.97 0.9831 184.00 0.9336 157.97 0.8848 D2 138.94 0.9910 207.87 0.9536 180.19 0.9132 D3 159.94 0.9958 238.50 0.9730 208.86 0.9419 D4 144.88 0.9932 217.94 0.9610 189.62 0.9240 F1 82.22 0.9958 130.70 0.9847 114.07 0.9585 F2 113.82 0.9763 192.35 0.9989 172.12 0.9931 F3 97.06 0.9892 269.20 0.9897 244.72 0.9955 A2 36.57 0.9947 60.23 0.9818 51.13 0.9481 A3 21.36 9.9931 36.75 0.9779 30.15 0.9338 P2 24.68 0.9696 38.33 0.9056 30.65 0.8194 P3 13.44 0.9560 22.15 0.8770 16.49 0.7450 P4 7.81 0.9265 14.05 0.8346 9.42 0.6261 R1 58.45 0.9801 86.89 0.9257 73.08 0.9673 R2 69.37 0.9932 106.61 0.9612 91.49 0.9203 R3 73.43 0.9952 114.14 0.9704 98.54 0.9348
thermal stability. The release of CO grew with the increased pyrolysis temperature. CO increased slowly again at above 730 °C due to the boudouard reaction of coke and CO2(C + CO2→ 2CO). The source of carbon oxide was shown to form from the ether bridges joining the lignin sub units at lower temperatures, and the dissociation of diaryl ether at higher temperatures[27].
The absorbance peak of C]O stretching in the region of 1900 to 1600 cm−1 corresponded to aldehyde, organic acid, and ketone
produced by the splitting of epoxy group (eCH(O)CHe)[37]. Phenols with benzene ring group and hydroxyl group can be identified through the CeC skeleton vibration (1600–1450 cm−1). The bending vibration at 1400–1300 cm−1and the stretching vibration at 1200–1000 cm−1 were due to the hydroxyl group (CeO (H)) compounds. The releases of C]O, eOH, and CeO(H) such as carbonyls, acids, ether, phenol, and alcohol occurred mainly between 180 and 500 °C. The peak of absor-bance at 966 cm−1was due to the NH3.
Fig. 5. (a-c) plotting G (α) versus 10x× EP (u)/βR for the three stages of the WT pyrolysis; (d-f) calculated and experimental conversion data for the three sub-stages at the four heating rates.
In summary, the main gaseous products of the WT pyrolysis were identified as H2O, CH4, CO2, C]O, phenol, CeO, and NH3, and to a lesser extent CO. Overall, the release concentrations of the pyrolysis products were reported to be represented by the peak intensity of a specific wavenumber[53]. The summed integral values of emissions of the gas products are provided inFig. 6d. The concentrations of these eight components were of the following order: CO2> C]O > phenol > CH4> CeO > NH3> H2O > CO. Since the results of
the TG-FTIR analyses needed to be confirmed, the Py-GC/MS analysis was provided for confirmation, and more detailed information about the products.
3.4. Py-GC-MS analysis
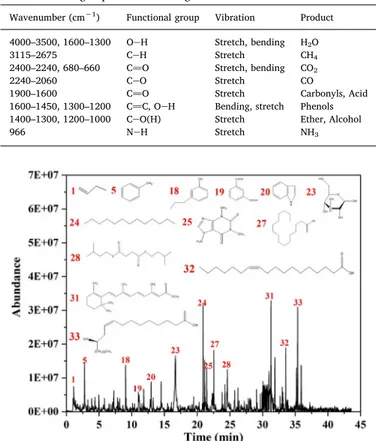
The total ion intensity of the gases evolved from the WT pyrolysis is presented using Py-GC/MS inFig. 7. The products of the WT pyrolysis, Table 5
Estimation of kinetic triplets of Ea, A, and f (α) for the three sub-stages of the main WT pyrolysis at four heating rates by master-plots.
Stage β E A f (α) R2 °C/min kJ/mol s−1 1 5 161.50 4.00 × 10¹³ (3/2)(1− α)2/3[1− (1 − α)1/3]−1 0.9965 10 4.23 × 10¹³ (3/2)(1− α)2/3[1− (1 − α)1/3]−1 0.9964 20 3.11 × 10¹³ (3/2)(1− α)2/3[1− (1 − α)1/3]−1 0.9961 40 4.49 × 10¹³ (3/2)(1− α)2/3[1− (1 − α)1/3]−1 0.9965 2 5 193.11 1.30 × 10¹⁶ (1− α)2 0.9985 10 1.91 × 10¹⁶ (1− α)2 0.9995 20 1.69 × 10¹⁶ (1− α)2 0.9998 40 1.84 × 10¹⁶ (1− α)2 0.9985 3 5 224.79 3.02 × 10¹⁶ (1− α)2.5 0.9941 10 3.22 × 10¹⁶ (1− α)2.5 0.9955 20 3.86 × 10¹⁶ (1− α)2.5 0.9918 40 4.78 × 10¹⁶ (1− α)2.5 0.9894
Fig. 6. (a) 3D infrared spectrum; (b) TG-FTIR spectrum for volatiles at a peak value of 345.3 °C; (c) absorbance of volatiles as a function of temperature; and (d) yield of emissions for WT pyrolysis.
and their chemical compositions according to the NIST MS library are listed inTable 7. We mainly found the seven compound families of acid, benzene, furan, ketone, phenol, ester, and nitride. C]O (including acid, ester, ketone, and aldehyde) was the main product, as with the TG-FTIR result. The resultant products from the devolatilization of organic compounds can be either used to generate heat and electricity or transformed into chemicals via subsequent pathways[50].
The acids and ketones were previously demonstrated to result from the hemi-cellulose degradation, while phenols and aldehydes were due to the lignin degradation [13]. There existed a total of 33 organic compounds based on Py-GC/MS, including alkene, acid, benzene, furan, ketone, phenol, nitride, alcohol, aldehyde, alkyl, and ester. The pre-cipitated species mainly included D-glucopyranoside-D-glucopyranosyl (peak 23), tridecylene (peak 24), caffeine (peak 25), hexadecanoic acid (peak 27), and ricinoleic acid (peak 33). Caffeine was detected as the pyrolysis product since the tea products contained a certain amount of caffeine[54]. Toluene, phenol, 4-propyl-, hexancdioic acid, bis(2-me-thylpropyl) ester, retinoic acid, methyl ester, and octadecenoic acid were some of the other compounds found in smaller amounts in the pyrolysis process. Yang et al.[55]found some similar compounds such as P-xylene, indole, toluene, and hexadecanoic acid from the pyrolysis of hazardous biological waste. The pyrolysis products of bagasse were found to include ketones, carboxylic acid, aldehydes, esters, alcohols, and benzene due to crackings, lignin polymerizations, and cellulose condensations[47]. Methylindole, careen, and benzenediol were also detected with the products since they were often added to tea as spices [56].
Overall, hemi-cellulose was shown to exhibit the following pyrolysis pathways: depolymerization, dehydration to furan and pyran ring de-rivatives, and furanose and pyranose ring-breakage to light oxygenated species. The primary pyrolysis of cellulose consisted of the following two similar stages: depolymerize to form anhydrosugars, and pyranose ring- breakage to light oxygenated species[27]. Lignin, made of the Table 6
Main functional groups identified using TG-FTIR.
Wavenumber (cm−1) Functional group Vibration Product 4000–3500, 1600–1300 OeH Stretch, bending H2O
3115–2675 CeH Stretch CH4
2400–2240, 680–660 C]O Stretch, bending CO2
2240–2060 CeO Stretch CO
1900–1600 C]O Stretch Carbonyls, Acid
1600–1450, 1300–1200 C]C, OeH Bending, stretch Phenols 1400–1300, 1200–1000 CeO(H) Stretch Ether, Alcohol
966 NeH Stretch NH3
Fig. 7. Py-GC/MS detection of gas products evolved from the WT pyrolysis.
Table 7
The classification and peak-area percentage of WT pyrolytic products based on Py-GC/MS.
Label m/z Molecular formula Family Compound t (min) Area (%)
1 56 C4H8 Alkene Butene 1.12 2.09
2 60 C2H4O2 Acid Acetic acid 1.52 0.44
3 78 C6H6 Benzene Benzene 1.71 0.49 4 96 C6H8O Furan 2, 5-Dimethyl-furan 2.08 0.44 5 92 C7H8 Benzene Toluene 2.77 4.19 6 112 C8H16 Alkene Octene 3.14 0.69 7 113 C7H15N Nitride Ethyl-piperidine 3.27 1.18 8 93 C6H7N Kctone Methyl-pyridone 3.53 0.37
9 82 C5H6O Furan 2-Methyl- Furan 3.88 1.17
10 106 C8H10 Benzene 1,3-Dimethyl-benzene 4.38 1.18 11 106 C8H10 Benzene P-Xylene 4.96 1.75 12 112 C7H12O Kctone Methyl-cyclohexanone 5.82 0.87 13 110 C6H6O2 Phenol Benzenediol 6.87 0.40 14 140 C10H20 Alkene Decene 7.07 0.70 15 108 C7H8O Phenol 4-methyl-phenol 7.21 0.66 16 112 C6H8O2 Kctone 2-Hydroxy-3-methyl-cylopent-2-enone 7.97 0.66 17 116 C9H8 Benzene Indene 8.15 1.01
18 136 C9H12O Phenol Phenol, 4-propyl- 9.07 3.79
19 166 C8H6O4 Acid Benzene-1,3-dicarboxylic acid 11.83 2.56
20 117 C7H8N Nitride Indole 12.97 2.49 21 136 C9H12O Phenol Mehly-methylethy-phenol 13.28 1.23 22 131 C9H9N Nitride Methyl-indole 14.50 1.81 23 180 C6H12O6 Aldehyde D-Glucopyranoside,D-glucopyranosyl 16.69 21.62 24 184 C13H28 Alkyl Tridecylene 20.89 6.89 25 194 C8H10N4O2 Nitride Caffeine 21.13 5.43 26 240 C16H32O Alcohol 9-Hexadecen-1-ol,(Z)- 21.44 3.23
27 256 C16H32O2 Acid Hexadecanoic acid 22.54 5.15
28 258 C14H26O4 Ester Hexancdioic acid, bis(2-methylpropyl) ester 24.59 4.37
29 296 C19H36O2 Aldehyde 9-Octadecenoic acid (Z)- 25.74 1.99
30 258 C14H26O4 Ester Dodecanedioic acid, dimethyl ester 29.07 0.97
31 314 C21H30O2 Ester Retinoic acid, methyl ester 31.30 5.03
32 284 C18H36O2 Acid Octadecenoic acid 33.55 5.05
irregular array of differently bonded hydroxyl- and methoxy-sub-stituted phenyl-propane units, is a complex, heterogeneous, three-di-mensional polymer. Lignin structure showed intense structural trans-formations with the following degradation reactions: (1) the lignin β-O-4 bonds cleaving, (2) severe re-condensation reactions, (3) vinyl ether structures forming by the loss of the terminal hydroxymethyl groups from lignin side chains, and (4) the oxidative cleavage of the Cα-Cβ benzylic bonds with the formation of benzoic acid and benzoic alde-hyde end groups[13]. Since benzene rings are not easy to break during the pyrolysis, the organic matter mainly comes from pyran rings of glucopyranose monomer and breaking of CeC bond on the rings[14]. The resultant pyrolysis products can be used as the main bioenergy intermediates and chemical substances.
4. Conclusion
In this study, the behaviors, kinetics, and products of the pyrolysis of waste tea were quantified. Out of the three stages of the thermal degradation, the main stage belonged to devolatilization between 187.0 and 536.5 °C. Our kinetic analysis indicated that the best-fit models were f (α) = (3/2)(1 − α)2/3
[1− (1 − α)1/3]−1, f (α) = (1 − α)2and f (α) = (1 − α)2.5for the sub-stages of devolatilization, respectively. The main gaseous products of the WT pyrolysis based on TG-FTIR were identified as H2O, CH4, CO2, C]O (acid anhydride, ketone or alde-hyde), phenol, CeO, NH3, and CO. The pyrolytic volatile products based on Py-GC/MS during the fast thermal cracking consisted of the seven compound families of acid, benzene, furan, ketone, phenol, ester, and nitride. The product species mainly included D-glucopyranoside-D-glucopyranosyl, tridecylene, caffeine, hexadecanoic acid, and ricinoleic acid. Overall, all the quantifications in this study are important to meeting the optimization and upscaling challenges of sustainable bioenergy production via the pyrolysis of waste tea in the power and industrial sectors integrated with carbon capture and storage technol-ogies. The reaction models, and the pyrolysis products can provide some baselines and insights in order for the pyrolysis technologies in the industries to utilize waste tea as an alternative solid fuel. This low-cost and abundant biomass may be used to generate bioenergy and chemicals in a cost-efficient and ecofriendly way.
Declaration of interest None.
Acknowledgments
This research wasfinancially supported by National Natural Science Foundation of China (No. 51608129) and the Science and Technology Planning Project of Guangdong Province, China (Nos. 2016A050502059, 2019B020208017 & 2018A050506046). We would like to thank the teacher Yu from School of Light Industry and Chemical Engineering for providing TG guidance.
References
[1] Biswas B, Pandey N, Bisht Y, Singh R, Kumar J, Bhaskar T. Pyrolysis of agricultural biomass residues: comparative study of corn cob, wheat straw, rice straw and rice husk. Bioresour Technol 2017;237:57–63.https://doi.org/10.1016/j.biortech. 2017.02.046.
[2] Li L, Wang G, Wang S, Qin S. Thermogravimetric and kinetic analysis of energy crop Jerusalem artichoke using the distributed activation energy model. J Therm Anal Calorim 2013;114(3):1183–9.https://doi.org/10.1007/s10973-013-3115-2. [3] Xu C, Hu S, Xiang J, Zhang L, Sun L, Shuai C, et al. Interaction and kinetic analysis
for coal and biomass co-gasification by TG-FTIR. Bioresour Technol 2014;154:313–21.https://doi.org/10.1016/j.biortech.2013.11.101. [4] Hu M, Wang X, Chen J, Yang P, Liu C, Xiao B, et al. Kinetic study and syngas
production from pyrolysis of forestry waste. Energy Convers Manage 2017;135:453–62.https://doi.org/10.1016/j.enconman.2016.12.086.
[5] Daioglou V, Stehfest E, Wicke B, Faaij A, van Vuuren DP. Projections of the avail-ability and cost of residues from agriculture and forestry. GCB Bioenergy
2016;8(2):456–70.https://doi.org/10.1111/gcbb.12285.
[6] Welfle A, Gilbert P, Thornley P. Securing a bioenergy future without imports. Energy Policy 2014;68:1–14.https://doi.org/10.1016/j.enpol.2013.11.079. [7] Fan S, Tang J, Wang Y, Li H, Zhang H, Tang J, et al. Biochar prepared from
co-pyrolysis of municipal sewage sludge and tea waste for the adsorption of methylene blue from aqueous solutions: kinetics, isotherm, thermodynamic and mechanism. J Mol Liq 2016;220:432–41.https://doi.org/10.1016/j.molliq.2016.04.107. [8] Zhao T, Chen Z, Lin X, Ren Z, Li B, Zhang Y. Preparation and characterization of
microcrystalline cellulose (MCC) from tea waste. Carbohyd Polym 2018;184:164–70.https://doi.org/10.1016/j.carbpol.2017.12.024.
[9] Ahmed ST, Lee JW, Mun HS, Yang CJ. Effects of supplementation with green tea by-products on growth performance, meat quality, blood metabolites and immune cell proliferation in goats. J Anim Physiol An N 2015;99(6):1127–37.https://doi.org/ 10.1111/jpn.12279.
[10] Qing W, Chen K, Wang Y, Liu X, Lu M. Green synthesis of silver nanoparticles by waste tea extract and degradation of organic dye in the absence and presence of H2O2. Appl Surf Sci 2017;423:1019–24.https://doi.org/10.1016/j.apsusc.2017.07.
007.
[11] Shen B, Tian L, Li F, Zhang X, Xu H, Singh S. Elemental mercury removal by the modified bio-char from waste tea. Fuel 2017;187:189–96.https://doi.org/10.1016/ j.fuel.2016.09.059.
[12] Ahmad MS, Mehmood MA, Al Ayed OS, Ye G, Luo H, Ibrahim M, et al. Kinetic analyses and pyrolytic behavior of Para grass (Urochloa mutica) for its bioenergy potential. Bioresour Technol 2017;224:708–13.https://doi.org/10.1016/j. biortech.2016.10.090.
[13] Chen W-H, Wang C-W, Kumar G, Rousset P, Hsieh T-H. Effect of torrefaction pre-treatment on the pyrolysis of rubber wood sawdust analyzed by Py-GC/MS. Bioresour Technol 2018;259:469–73.https://doi.org/10.1016/j.biortech.2018.03. 033.
[14] Liang F, Wang R, Hongzhong X, Yang X, Zhang T, Hu W, et al. Investigating pyr-olysis characteristics of moso bamboo through TG-FTIR and Py-GC/MS. Bioresour Technol 2018;256:53–60.https://doi.org/10.1016/j.biortech.2018.01.140. [15] Ma Z, Chen D, Gu J, Bao B, Zhang Q. Determination of pyrolysis characteristics and
kinetics of palm kernel shell using TGA–FTIR and model-free integral methods. Energy Convers Manage 2015;89:251–9.https://doi.org/10.1016/j.enconman. 2014.09.074.
[16] Zou S, Wu Y, Yang M, Li C, Tong J. Pyrolysis characteristics and kinetics of the marine microalgae Dunaliella tertiolecta using thermogravimetric analyzer. Bioresour Technol 2010;101(1):359–65.https://doi.org/10.1016/j.biortech.2009. 08.020.
[17] Yahya NY, Ngadi N, Wong S, Hassan O. Transesterification of used cooking oil (UCO) catalyzed by mesoporous calcium titanate: kinetic and thermodynamic stu-dies. Energy Convers Manage 2018;164:210–8.https://doi.org/10.1016/j. enconman.2018.03.011.
[18] Tang Y, Ma X, Wang Z, Wu Z, Yu Q. A study of the thermal degradation of six typical municipal waste components in CO2and N2atmospheres using TGA-FTIR. Thermochim Acta 2017;657:12–9.https://doi.org/10.1016/j.tca.2017.09.009. [19] Ghadikolaei SS, Omrani A, Ehsani M. Non-isothermal degradation kinetics of
Ethylene-Vinyl Acetate Copolymer nanocomposite reinforced with modified Bacterial Cellulose Nanofibers using advanced isoconversional and master plot analyses. Thermochim Acta 2017;655:87–93.https://doi.org/10.1016/j.tca.2017. 06.014.
[20] Mishra RK, Mohanty K. Pyrolysis kinetics and thermal behavior of waste sawdust biomass using thermogravimetric analysis. Bioresour Technol 2018;251:63–74.
https://doi.org/10.1016/j.biortech.2017.12.029.
[21] Xu F, Wang B, Yang D, Hao J, Qiao Y, Tian Y. Thermal degradation of typical plastics under high heating rate conditions by TG-FTIR: pyrolysis behaviors and kinetic analysis. Energy Convers Manage 2018;171:1106–15.https://doi.org/10. 1016/j.enconman.2018.06.047.
[22] Yahyaoui R, Jimenez PES, Maqueda LAP, Nahdi K, Luque JMC. Synthesis, char-acterization and combined kinetic analysis of thermal decomposition of hydro-talcite (Mg6Al2(OH)16CO3·4H2O). Thermochim Acta 2018;667:177–84.https://doi.
org/10.1016/j.tca.2018.07.025.
[23] Chen J, Song X, Mu L, Li A, Yin H. Thermogravimetric analysis and kinetics of the combustionof refining and chemicals wastewater in different oxygenconcentrations. J Therm Anal Calorim 2015;119:2205–19. https://doi.org/10.1007/s10973-014-4373-3.
[24] Xie C, Liu J, Xie W, Kuo J, Lu X, Zhang X, et al. Quantifying thermal decomposition regimes of textile dyeing sludge, pomelo peel, and their blends. Renew Energy 2018;122:55–64.https://doi.org/10.1016/j.renene.2018.01.093.
[25] Lin Y, Liao Y, Yu Z, Fang S, Lin Y, Fan Y, et al. Co-pyrolysis kinetics of sewage sludge and oil shale thermal decomposition using TGA–FTIR analysis. Energy Convers Manage 2016;118:345–52.https://doi.org/10.1016/j.enconman.2016.04. 004.
[26] Zhao J, Xiuwen W, Hu J, Liu Q, Shen D, Xiao R. Thermal degradation of softwood lignin and hardwood lignin by TG-FTIR and Py-GC/MS. Polym Degrad Stabil 2014;108:133–8.https://doi.org/10.1016/j.polymdegradstab.2014.06.006. [27] Gu X, Ma X, Li L, Liu C, Cheng K, Li Z. Pyrolysis of poplar wood sawdust by TG-FTIR
and Py–GC/MS. J Anal Appl Pyrol 2013;102:16–23.https://doi.org/10.1016/j. jaap.2013.04.009.
[28] Chen J, Lang X, Wang Y, Li G, Yang Z, Fan S. Comparative evaluation of different non-condensable gases on thermal behaviors, kinetics, high pressure properties, and product characteristics of heavy oil. Energy Convers Manage 2018;162:13–25.
https://doi.org/10.1016/j.enconman.2018.02.029.
[29] Soysa R, Choi YS, Kim SJ, Choi SK. Fast pyrolysis characteristics and kinetic study of Ceylon tea waste. Int J Hydrogen Energy 2016;41(37):16436–43.https://doi.org/
10.1016/j.ijhydene.2016.04.066.
[30] Tian L, Shen B, Xu H, Li F, Wang Y, Singh S. Thermal behavior of waste tea pyrolysis by TG-FTIR analysis. Energy 2016;103:533–42.https://doi.org/10.1016/j.energy. 2016.03.022.
[31] Peng C, Liu J, Liu H, Zhou H, Gong J. Influence of different fermentation raw materials on pyrolyzates of Pu-erh tea theabrownin by Curie-point pyrolysis-gas chromatography-mass spectroscopy. Int J Biol Macromol 2013;54:197–203.
https://doi.org/10.1016/j.ijbiomac.2012.12.021.
[32] Chen L, Yu Z, Liang J, Liao Y, Ma X. Co-pyrolysis of chlorella vulgaris and kitchen waste with different additives using TG-FTIR and Py-GC/MS. Energy Convers Manage 2018;177:582–91.https://doi.org/10.1016/j.enconman.2018.10.010. [33] Hao J, Feng W, Qiao Y, Tian Y, Zhang J, Che Y. Thermal cracking behaviors and
products distribution of oil sand bitumen by TG-FTIR and Py-GC/TOF-MS. Energy Convers Manage 2017;151:227–39.https://doi.org/10.1016/j.enconman.2017.08. 083.
[34] Cai H, Zou H, Liu J, Xie W, Kuo J, Buyukada M, et al. Thermal degradations and processes of waste tea and tea leaves via TG-FTIR: combustion performances, ki-netics, thermodynamics, products and optimization. Bioresour Technol 2018;268:715–25.https://doi.org/10.1016/j.biortech.2018.08.068.
[35] Xie C, Liu J, Zhang X, Xie W, Sun J, Chang K, et al. Co-combustion thermal con-version characteristics of textile dyeing sludge and pomelo peel using TGA and artificial neural networks. Appl Energy 2018;212:786–95.https://doi.org/10. 1016/j.apenergy.2017.12.084.
[36] Jiang L, Zhang D, Li M, He J-J, Gao Z-H, Zhou Y, et al. Pyrolytic behavior of waste extruded polystyrene and rigid polyurethane by multi kinetics methods and Py-GC/ MS. Fuel 2018;222:11–20.https://doi.org/10.1016/j.fuel.2018.02.143. [37] Zhang Z, Wang C, Huang G, Liu H, Yang S, Zhang A. Thermal degradation behaviors
and reaction mechanism of carbonfibre-epoxy composite from hydrogen tank by TG-FTIR. J Hazard Mater 2018;357:73–80.https://doi.org/10.1016/j.jhazmat. 2018.05.057.
[38] Huang J, Liu J, Chen J, Xie W, Kuo J, Lu X, et al. Combustion behaviors of spent mushroom substrate using TG-MS and TG-FTIR: thermal conversion, kinetic, ther-modynamic and emission analyses. Bioresour Technol 2018;266:389–97.https:// doi.org/10.1016/j.biortech.2018.06.106.
[39] Chen J, Xie C, Liu J, He Y, Xie W, Zhang X, et al. Co-combustion of sewage sludge and coffee grounds under increased O2/CO2atmospheres: thermodynamic char-acteristics, kinetics and artificial neural network modeling. Bioresour Technol 2018;250:230–8.https://doi.org/10.1016/j.biortech.2015.05.031.
[40] Chen R, Lu S, Zhang Y, Lo S. Pyrolysis study of waste cable hose with thermo-gravimetry/Fourier transform infrared/mass spectrometry analysis. Energy Convers Manage 2017;153:83–92.https://doi.org/10.1016/j.enconman.2017.09.071. [41] Irmak Aslan D, Parthasarathy P, Goldfarb JL, Ceylan S. Pyrolysis reaction models of
waste tires: application of Master-Plots method for energy conversion via devola-tilization. Waste Manage 2017;68:405–11.https://doi.org/10.1016/j.wasman. 2017.06.006.
[42] Chen J, Mu L, Jiang B, Yin H, Song X, Li A. TG/DSC-FTIR and Py-GC investigation on pyrolysis characteristics of petrochemical wastewater sludge. Bioresour Technol 2015;192:1–10.https://doi.org/10.1016/j.biortech.2015.05.031.
[43] Liu C, Liu J, Sun G, Xie W, Kuo J, Li S, et al. Thermogravimetric analysis of (co-) combustion of oily sludge and litchi peels: combustion characterization, interac-tions and kinetics. Thermochim Acta 2018;667:207–18.https://doi.org/10.1016/j. tca.2018.06.009.
[44] Selcuk N, Yuzbasi NS. Combustion behaviour of Turkish lignite in O2/N2and O2/ CO2mixtures by using TGA–FTIR. J Anal Appl Pyrol 2011;90(2):133–9.https://doi.
org/10.1016/j.jaap.2010.11.003.
[45] Uzun BB, Apaydin-Varol E, Ateş F, Özbay N, Pütün AE. Synthetic fuel production from tea waste: characterisation of bio-oil and bio-char. Fuel 2010;89(1):176–84.
https://doi.org/10.1016/j.fuel.2009.08.040.
[46] Chen J, Wang Y, Lang X, Ren X, Fan S. Comparative evaluation of thermal oxidative decomposition for oil-plant residues via thermogravimetric analysis: thermal con-version characteristics, kinetics, and thermodynamics. Bioresour Technol 2017;243:37–46.https://doi.org/10.1016/j.biortech.2017.06.033.
[47] Lin Y, Liao Y, Yu Z, Fang S, Ma X. A study on co-pyrolysis of bagasse and sewage sludge using TG-FTIR and Py-GC/MS. Energy Convers Manage 2017;151:190–8.
https://doi.org/10.1016/j.enconman.2017.08.062.
[48] Chandrasekaran A, Ramachandran S, Subbiah S. Determination of kinetic para-meters in the pyrolysis operation and thermal behavior of Prosopis juliflora using thermogravimetric analysis. Bioresour Technol 2017;233:413–22.https://doi.org/ 10.1016/j.biortech.2017.02.119.
[49] Aslan DI, Ozogul B, Ceylan S, Geyikci F. Thermokinetic analysis and product characterization of Medium Density Fiberboard pyrolysis. Bioresour Technol 2018;258:105–10.https://doi.org/10.1016/j.biortech.2018.02.126.
[50] Fang S, Yu Z, Ma X, Lin Y, Chen L, Liao Y. Analysis of catalytic pyrolysis of mu-nicipal solid waste and paper sludge using TG-FTIR, Py-GC/MS and DAEM (dis-tributed activation energy model). Energy 2018;143:517–32.https://doi.org/10. 1016/j.energy.2017.11.038.
[51] Stefanidis SD, Kalogiannis KG, Iliopoulou EF, Michailof CM, Pilavachi PA, Lappas AA. A study of lignocellulosic biomass pyrolysis via the pyrolysis of cellulose, hemicellulose and lignin. J Anal Appl Pyrol 2014;105:143–50.https://doi.org/10. 1016/j.jaap.2013.10.013.
[52] Ding Y, Ezekoye OA, Lu S, Wang C. Thermal degradation of beech wood with thermogravimetry/Fourier transform infrared analysis. Energy Convers Manage 2016;120:370–7.https://doi.org/10.1016/j.enconman.2016.05.007.
[53] Granada E, Eguía P, Vilan JA, Comesaña JA, Comesaña R. FTIR quantitative ana-lysis technique for gases. Application in a biomass thermochemical process. Renew. Energy 2012;41:416–21.https://doi.org/10.1016/j.renene.2011.11.020. [54] Sökmen Münevver, Demir Ezgi, Alomar SY. Optimization of sequential supercritical
fluid extraction (SFE) of caffeine and catechins from green tea. J Supercrit Fluid 2018;133:171–6.https://doi.org/10.1016/j.supflu.2017.09.027.
[55] Yang S, Zhu X, Wang J, Jin X, Liu Y, Qian F, et al. Combustion of hazardous bio-logical waste derived from the fermentation of antibiotics using TG-FTIR and Py-GC/MS techniques. Bioresour Technol 2015;193:156–63.https://doi.org/10.1016/ j.biortech.2015.06.083.
[56] Zhu Y, Lv HP, Shao CY, Kang S, Zhang Y, Guo L, et al. Identification of key odorants responsible for chestnut-like aroma quality of green teas. Food Res Int 2018;108:74–82.https://doi.org/10.1016/j.foodres.2018.03.026.