RESEARCH
Epidemiological and cost analysis
of burn injuries admitted to the emergency
department of a tertiary burn center
Tolga Eser
1, Cemil Kavalci
1, Cem Aydogan
2and Afsin Emre Kayipmaz
1*Abstract
Background: Burn injury is an emergency medical condition that rapidly develops as a result of tissue exposure to electrical, chemical or thermal energy. Therefore, its treatment usually begins at the emergency department. In this study we aimed to perform an epidemiological analysis of burn injuries presenting to the emergency department of a tertiary burn center, and factors affecting the cost of their medical care.
Methods: Patients who presented to Baskent University Ankara Hospital Adult Emergency Department with burn injuries between January 2012 and December 2014 were studied for age, sex, time of admission, type of burn injury, clinical prognosis, mortality rate, percent burn area, and total cost of care. A total of 264 patients were enrolled. Chi square test was used for the comparison of categorical variables. Non-parametric tests were used for the comparison of continuous variables.
Results: This study included 179 (67.8 %) women and 85 (32.2 %) men. The most common types of burn injuries were hot water burns and scalding. Eleven point seven percent of the patients sustained burn injuries in occupational accidents. 95.1 % of the patients were discharged from the emergency and 4.5 % of them were hospitalized. Only 1 (0.4 %) patient died. There was no significant difference between patient outcomes (discharge vs. hospital admission) with respect to the cost of care (p = 0.846) No significant difference was found between the cost of care of surgical and non-surgical management of burn injuries (p = 0.206). No significant difference was found between the costs of care of different types of burn injuries (p = 0.053). There was a significant difference between burn degrees with respect to the cost of care (p = 0.038). A significant difference was found between the costs of care of patients with a percent burn area of less than 10 % and those with a percent burn area of more than 10 % (p < 0.001), indicating that as percent burn area increased, a proportional increase occurred in the cost of care.
Conclusions: Burn degree and percent burn area were the main determinants of the cost of care of burn injuries. In conclusion, burn injuries are preventable by taking occupational measures and raising public awareness about domestic accidents.
Keywords: Burns, Cost analysis, Emergency treatment, Epidemiology
© 2016 The Author(s). This article is distributed under the terms of the Creative Commons Attribution 4.0 International License (http://creativecommons.org/licenses/by/4.0/), which permits unrestricted use, distribution, and reproduction in any medium, provided you give appropriate credit to the original author(s) and the source, provide a link to the Creative Commons license, and indicate if changes were made.
Background
Burn injury is an emergency medical condition that rap-idly develops as a result of tissue exposure to electrical, chemical or thermal energy. Therefore, its treatment usually begins at the emergency department. Since a
significant proportion of patients affected by burn injury are admitted to the emergency department immediately after the incident, healthcare staff working in the emer-gency department should have a good command of these cases (Alharbi et al. 2012). After providing first medical aid at the emergency department, it is imperative that multiple departments, particularly general surgery and plastic surgery, cooperate for the management of burn injuries (Ilhan et al. 2012).
Open Access
*Correspondence: [email protected]
1 Department of Emergency, Faculty of Medicine, Baskent University,
Fevzi Cakmak Street No: 45 Bahcelievler, Cankaya, Ankara, Turkey Full list of author information is available at the end of the article
A major proportion of patients with burn injuries are discharged from the emergency department once outpa-tient treatment and follow-up is scheduled (Yolcu et al.
2013). When hospital admissions are taken into account, however, burn injuries are a significant source of mor-tality and morbidity (Sever et al. 2011). Furthermore, demanding medical care of these patients gives rise to the high cost of care depending on burn percentage, degree, as well as the duration of hospital stay (Hazar et al. 2013). Hence, taking preventive measures to avoid these injuries is the key to success for their management. Emergency physicians who assume a critical role in the management of burn injuries should necessarily have knowledge of the most common types of burn injuries and their cost of care in the emergency department.
In this study we aimed to perform an epidemiologi-cal analysis of burn injuries presenting to the emergency department of a tertiary burn center, and factors affecting the cost of their medical care.
Methods
This retrospective descriptive study was conducted after being approved by Baskent University Faculty of Medi-cine Ethics Committee (Project No: KA14/282 Date of Approval: 15.10.2014). Patients who presented to Baskent University Ankara Hospital Adult Emergency Depart-ment with burn injuries between January 2012 and December 2014 were studied for age, sex, time of admis-sion, type of burn injury, clinical prognosis, mortality rate, percent burn area, and total cost of care. A total of 264 patients were enrolled.
Hospital automation system was used to access patients’ medical data including age; sex; hour, month, and year of admission; cause and type of burn injury; occupational and suicidal nature of burn injury; burn degree; percent burn area; surgical intervention if per-formed; indications for admission according to the rule of nines; post-treatment clinical status, regular attend-ance to follow-up visits; and cost of care denominated in Euro (€). The sum for treatment cost has been obtained by adding up the invoice amounts of the inpatients and all the check-ins to the emergency department and burns outpatient department.
International Classification of Diseases (ICD) diag-nostic codes T30, T31, and T32 were used to determine and record burn injuries. Statistical analyses were done with “SPSS 17.0 for Windows” software package. Chi-square test was used for the comparison of categorical variables. The distribution of continuous variables was assessed with the Kolmogorov–Smirnov test. Non-para-metric tests were used for the comparison of continuous variables.
The correlation between various variables and cost of care was analyzed with the Spearman’s correlation test. A p value of less than 0.05 was considered statistically significant. Results
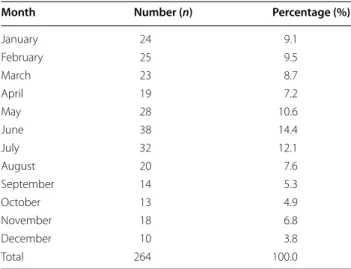
This study included 179 (67.8 %) women and 85 (32.2 %) men. Thirty-four (12.9 %) patients were admitted to emergency department between 00:00 and 06:00; 15 (5.7 %) between 06:00 and 12:00; 74 (28 %) between 12:00 and 18:00; and 141 (53.4 %) between 18:00 and 24:00. The monthly distribution of the emergency depart-ment admissions for burn injuries was shown in Table 1. Accordingly, patients suffering from burns check into emergency department most frequently between 18:00 and 24:00 and in June.
Seventy-seven (29.2 %) patients were admitted in 2012; 126 (47.7 %) in 2013; and 61 (23.1 %) in 2014. One hun-dred and ninety-five (73.9 %) patients were admitted for hot water burns-scalding; 25 (9.5 %) for flame burns; 24 (9.1 %) for hot contact burns; 18 (6.8 %) for chemical and 2 (0.8 %) for electric burns. The most common types of burn injuries were hot water burns and scalding. Thirty-one (11.7 %) patients sustained burn injuries in occupa-tional accidents and 233 (88.3 %) in non-occupaoccupa-tional accidents. There was no suicidal burn injury in our study. Two hundred and fifty-one (95.1 %) patients were dis-charged from the emergency department and 12 (4.5 %) were hospitalized. Only 1 (0.4 %) patient died. 70.8 % of the patients involved (n = 187) are found to have attended to outpatient clinic controls, and 28.8 % have not.
There was no significant difference between patient outcomes (discharge vs. hospital admission) with respect to the cost of care (p = 0.846) (Table 2).
Table 1 Monthly distribution of admissions for burn inju-ries
Month Number (n) Percentage (%)
January 24 9.1 February 25 9.5 March 23 8.7 April 19 7.2 May 28 10.6 June 38 14.4 July 32 12.1 August 20 7.6 September 14 5.3 October 13 4.9 November 18 6.8 December 10 3.8 Total 264 100.0
It was found that there was no statistically significant difference between the gender-based groups (p = 0.079) (Table 3).
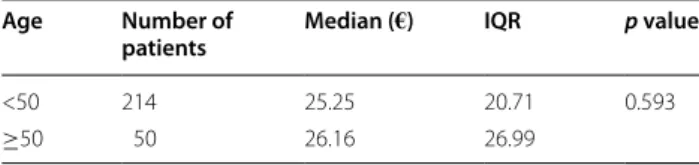
It was found that there was no statistically significant difference between the patients who were older versus younger than 50 (p = 0.593) (Table 4).
There was a significant difference between the years of admission with respect to the cost of care (p < 0.001). Based on the annual analysis, the highest cost of care was incurred in 2012 and the lowest in 2014 (Table 5).
No significant difference was found between the cost of care of surgical and non-surgical management of burn injuries (p = 0.206) (Table 6).
No significant difference was found between the costs of care of different types of burn injuries (p = 0.053) (Table 7).
There was a significant difference between burn degrees with respect to the cost of care (p = 0.038). The second degree burns incurred the highest cost of care while the third degree burns led to the lowest cost of care (Table 8).
A significant difference was found between the costs of care of patients with a percent burn area of less than 10 % and those with a percent burn area of more than 10 % (p = 0.001), indicating that as percent burn area increased, a proportional increase occurred in the cost of care (Table 9).
There was a significant positive correlation between age and treatment cost (r = 0.184, p = 0.003), and also between percent burn area and treatment cost (r = 0.804, p < 0.001).
According to the descriptive statistics table, it was found that those who have 2.degree burns belong to the highest age group and those who have 3.degree burns belong to the lowest age group (Table 10).
According to the descriptive statistics table, the most frequent reason of burns for the older age group is flame burnt while the most frequent reason for young age groups is contacted with hot objects (Table 11).
Of the patients, those who were applied surgical inter-vention were older than those who were not applied sur-gical intervention (Table 12).
Hospitalized patients are of higher age group while those who were discharged from hospital were the lowest (Table 13).
Discussion
According to our study, there is no statistically signifi-cant difference between the patients’ discharged from the hospital versus hospitalized statuses in terms of costs (p = 0.846). We consider that the reason for above con-cern is that the cost analysis figures were including the costs arising from patients’ subsequent applications to burns outpatient department. Accordingly, we think that outpatient treatment versus inpatient treatment does not make a difference in terms of treatment costs. And despite the apparently higher costs of the patients who were applied surgical intervention; our statistical analy-sis has shown that there was no significant difference between the two groups (p = 0.206). Considering the var-iables such as the need for general anesthesia, the materi-als used, the necessity of multidisciplinary approach we expect the cost of the patients who are subject to surgi-cal intervention, be higher. As a result of our study, we observed no significant difference between the cost ver-sus the reason of the burns (p = 0.053). However, it is Table 2 Comparison of cost of care by patient outcome
IQR inter-quartile range
* Mann–Whitney-U test
Outcome Number of
patients Median (€) IQR p value
Discharge 251 25.14 21.84 0.846*
Hospital admission 12 26.10 31.58
Table 3 Comparison of gender-based groups in terms of costs
IQR inter-quartile range
* Mann–Whitney-U test
Gender Number of
patients Median (€) IQR p value
Female 179 24.22 19.26 0.079*
Male 85 27.77 28.96
Table 4 Comparison of age-based groups in terms of costs
Age Number of
patients Median (€) IQR p value
<50 214 25.25 20.71 0.593
≥50 50 26.16 26.99
Table 5 Comparison of the cost of burn care in different years of admission
IQR inter-quartile range
* Kruskal–Wallis test
Year of admission Number of
patients Median (€) IQR p value
2012 77 30.29 27.50 <0.001*
2013 126 26.24 20.44
observed that the burns which occur due to flame expo-sure result in remarkably higher costs. No statistically significant data has been observed between patient age versus cost (p = 0.593). There is a statistically significant difference between the degree of the burn versus cost (respectively p < 0.001 and p = 0.038). This means that the cost is determined by the burnt area and its degree rather than the patient’s age.
Our study revealed that, among burn survivors admit-ted to our emergency department, female burn survivors were 2.1 times more common than male burn survivors. This was in contrast to a study by Saritas et al. (2011), which reported that 65 % of burn survivors who were admitted to the emergency department were male. We believe that more female survivors were admitted in our series due to the proximity of our hospital to residential areas and small-sized workplaces and its remoteness to industrial areas.
Table 6 Comparison of costs of care of surgical versus non-surgical management of burn injuries
IQR inter-quartile range, min minimum, max maximum
* Mann–Whitney-U test
Surgical intervention Number of patients Median (€) IQR Min Max p value
Not performed 258 25.09 21.61 5.96 190.93 0.206*
Performed 6 48.29 254.23 9.60 475.52
Table 7 Comparison of the costs of care of different types of burn injury
IQR inter-quartile range
* Kruskal–Wallis test
Cause of burn
injury Number of patients Median (€) IQR p value
Hot water-scalding 195 25.96 21.27 0.053*
Flame 25 29.05 73.05
Contact with hot 24 18.37 13.43
Chemical 18 18.60 24.92
Electric 2 23.74 –
Table 8 Comparison of treatment costs by burn degree
* Kruskal–Wallis test
IQR inter-quartile range
Burn degree Number of
patients Median (€) IQR p value
1. Degree 49 23.29 16.21 0.038*
2. Degree 208 26.24 24.28
3. Degree 7 14.70 4.63
Table 9 Comparison of cost of care by percent burn area
IQR inter-quartile range
* Mann–Whitney-U test
Percent burn
area Number of patients Median (€) IQR p value
Percent burn
area < %10 250 24.93 20.17 <0.001* Percent burn
area ≥ %10 14 75.00 75.54
Table 10 Age of the patients versus burn degree
Median (year) IQR
1. Degree 29.00 19.00
2. Degree 35.00 23.00
3. Degree 30.00 11.00
Table 11 Patient age versus reason of burns
Cause of burn injury Median (year) IQR
Hot water-scalding 32.00 22.00
Flame 37.00 21.00
Contact with hot 26.50 25.00
Chemical 31.00 13.00
Electric 31.50 –
Table 12 Patient age versus surgical intervention
Surgical intervention Median (year) IQR
Not performed 32.50 21.00
Performed 38.00 38.00
Table 13 Age of patient versus clinical outcome
Median (year) IQR
Discharge 32.00 21.00
The median age of our study population was 33 years. Kowal-Vern et al. (2014) similarly reported a median age of 30 years for burn injury survivors. We think that the reason for young adults suffering from burns is observed more frequently is because these individuals are more active at home and at work. Young adults are more open to traumas and therefore the burns due to their motor-vehicle use, alcohol consumption and that they can work under heavy-duty labor requirements.
The most frequent time period for admissions was between 18:00 and 00:00 (54.4 %). DeKoning et al. (2009) also reported that admissions for burn injuries most commonly took place between 18:00 and 19:00. We con-sidered that spending more time in low-safety, uncon-trolled places and at kitchen during this period caused an increase in the burn injuries.
In our study, the most common types of burn injury were, in descending order of frequency, hot water burns-scalding, flame burns, and burns by contact with hot sub-stances/surfaces. This finding was in agreement with that reported by Kowal-Vern et al. (2014). However, Avsarog-ullari et al. (2003) and Ahn and Maitz (2012) reported that flame burns were the most common types of burn injury followed by scalding. The study of Avsarogullari et al. (2003), as it can be seen in our study, consists of burn patients who check into the emergency department. As for Ahn and Maitz’s (2012) study, it did not consist of emergency service patients but inpatients of the burns unit. This can be one of the authentic properties of our study among other studies within the literature. Our finding may be a reflection of our hospital’s proximity to residential areas and small-sized workplaces.
As the majority of our cases were minor burn inju-ries, the median percent burn area was only 2 %. In the literature, percent burn area has been variably reported (Kowal-Vern et al. 2014; Avsarogullari et al. 2003; Aksoy et al. 2014; Sahin et al. 2011). This suggests that in our patients burn injuries may have occurred in different ways at home, workplace, or many other different set-tings, and thus the range of burn degrees may have been diverse.
Our study demonstrated that second-degree burns were the most common burn degree (78.78 %), a find-ing that was similarly reported by many other studies (DeKoning et al. 2009; Avsarogullari et al. 2003; Burton et al. 2009). Although it may show variability by differ-ent causes of burn injury, it is possible that the second-degree burn injuries were more common in patients with flame or scalding burn injuries.
According to our results, 11.7 % of burn injuries occurred in occupational accidents. Karami Matin et al.
(2012) reported that occupational burn injuries con-stituted 28.5 % of their cases. This finding suggests that recent national measures taken for occupational health and safety have raised workers’ awareness about burn injuries and transformed workplaces to safer environments.
In our study we found that surgical treatment was used in 2.3 % patients with burn injuries. This low number possibly resulted from the mildness of burn injuries in our patients.
Similar to what Sahin et al. (2011) reported, we found that cost of care was not significantly different between various causes of burn injuries. We determined that flame burns were associated with higher cost of care, as Karami Matin et al. (2012) reported.
The cost of care of burn injuries with a percent burn area of less than 10 % was lower than that of burn inju-ries occupying more than 10 % of body surface area. This suggests that cost of care is affected by percent burn area. Ahn and Maitz (2012) also demonstrated that an increase in percent burn area was the primary factor leading to a proportional increase in cost of care. In patients with a greater percent burn area, hospitalization may be pro-longed and complications may develop. Furthermore, increased use of workforce and medical materials lead to increased cost of care (Ahn and Maitz 2012).
We found a significant difference between burn degrees with regard to the cost of care. Burn degree and depth are similarly known to affect patient prognosis. In our study, the cost of care of second-degree burns was greater than third degree burns. Follow-up appoint-ments of second-degree burn injuries are recommended to be spaced more closely to avoid complications. This probably led to a higher cost by increasing the number of procedures performed and medical equipment used at each visit, increasing overall cost in our study. We failed to detect any significant difference between the cost of care of patients managed surgically versus non-surgically (p = 0.206). Jansen et al. (2012), however, reported that early surgery allowed cost saving by decreasing the dura-tion of hospital stay.
Conclusions
The proximity to our hospital to residential areas and small-sized workplaces led to a greater percentage of hot water-scalding injuries that presented to our emergency department. Burn degree and percent burn area were the main determinants of the cost of care of burn injuries. In conclusion, burn injuries are preventable by taking occu-pational measures and raising public awareness about domestic accidents.
Authors’ contributions
TA, CK, and AEK conceived of the study, collected the data and participated in its design and coordination and drafted the manuscript. CA participated in the design of the study and helped to perform the statistical analysis. All authors read and approved the final manuscript.
Author details
1 Department of Emergency, Faculty of Medicine, Baskent University, Fevzi
Cakmak Street No: 45 Bahcelievler, Cankaya, Ankara, Turkey. 2 Department
of General Surgery, Faculty of Medicine, Baskent University, Ankara, Turkey. Competing interests
The authors declare that they have no competing interests. Received: 7 June 2016 Accepted: 19 August 2016
References
Ahn CS, Maitz PK (2012) The true cost of burn. Burns 38:967–974 Aksoy N, Arli S, Yigit O (2014) A retrospective analysis of the burn injury
patients records in the emergency department, an epidemiologic study. Emerg (Tehran) 2:115–120
Alharbi Z, Piatkowski A, Dembinski R, Reckort S, Grieb G, Kauczok J, Pallua N (2012) Treatment of burns in the first 24 hours: simple and practical guide by answering 10 questions in a step-by-step form. World J Emerg Surg 7:13
Avsarogullari L, Sozuer E, Ikizceli I, Kekec Z, Yurumez Y, Ozkan S (2003) Adult burn injuries in an emergency department in Central Anatolia, Turkey: a 5-year analysis. Burns 29:571–577
Burton KR, Sharma VK, Harrop R, Lindsay R (2009) A population-based study of the epidemiology of acute adult burn injuries in the Calgary Health Region and factors associated with mortality and hospital length of stay from 1995 to 2004. Burns 35:572–579
DeKoning EP, Hakenewerth A, Platts-Mills TF, Tintinalli JE (2009) Epidemiology of burn injuries presenting to North Carolina emergency departments in 2006–2007. Burns 35:776–782
Hazar E, Ince AR, Cam S, Karagoz N (2013) Cost analysis of service businesses: the cost analysis of hospitalized patients in Numune Hospital burn unit of Sivas. BMSIJ 1:156–167
Ilhan E, Dal O, Yakan S, Cengiz F (2012) Evaluation of the burn patients presenting to emergency clinic of an education hospital. J Clin Anal Med 3:268–270
Jansen LA, Hynes SL, Macadam SA, Papp A (2012) Reduced length of stay in hospital for burn patients following a change in practice guidelines: financial implications. J Burn Care Res 33:e275–e279
Karami Matin B, Karami Matin R, Ahmadi Joybari T, Ghahvehei N, Haghi M, Ahmadi M, Rezaei S (2012) Epidemiological data, outcome, and costs of burn patients in Kermanshah. Ann Burns Fire Disasters 25:171–177 Kowal-Vern A, Bokhari F, Poulakidas S (2014) Demographic comparison of burn
emergency only visits and admissions in an urban burn center. J Burn Care Res. doi:10.1097/BCR.0000000000000197
Sahin I, Ozturk S, Alhan D, Acikel C, Isik S (2011) Cost analysis of acute burn patients treated in a burn centre: the Gulhane experience. Ann Burns Fire Disasters 24:9–13
Saritas A, Cikman M, Candar M, Kandis H, Baltaci D (2011) Retrospective analy-sis of judicial burn cases admitted to our clinic: 4-year experience. Duzce Med J 13:29–33
Sever C, Kulahci Y, Duman H (2011) Prediction of mortality and causes of death in a burn centre: a retrospective clinical study. J Clin Anal Med 2:24–26 Yolcu S, Beceren NG, Timucin H, Uludag U (2013) Emergency service