© Central Fisheries Research Institute (CFRI) Trabzon, Turkey and Japan International Cooperation Agency (JICA)
The Determination of Technology & Storage Period of Surimi Production
from Anchovy (Engraulis encrasicholus L., 1758)
Introduction
The surimi, which is a fish minced meat that has been leached by washing with water, then mixed with sugar and other additives such as sorbitol, polyphosphaten and protectives (cryoprotectan) and then frozen, was described as moist frozen concentrated myofibrillar protein of the fish meat (Lee, 1984).
The surimi is a production that is being utilized by processing fish or sea products mostly disliked, low priced and inadequate for consumption. It has a great potential as a protein source that may be used rather than animal or vegetable protein. Surimi may also be used as an intermediate product which is processed from the fabricated sea foods such as erublegs or its parts. Economically, it is mostly produced from the white meat Alascan pollack (Theragra chalcoramma). However, sixty different fish such as cod (Gadus morhua), herring (Clupea harengus), whiting (Merlangius merlangus), mackerel (Scomber scombrus), sardine (Sardina pilchardus), anchovy (Engraulis encrasicholus) and goby (Gobius spp.) have been used in surimi production (Lee, 1984).
The anchovy, which is one of the most common fishing species in Turkey, is rather used in oil and flour industry. That is why the new processing possibilities are ought to be studied in human consumption of the highly valuable anchovy. Besides, by processing sea products, a new type of food will be possible in our country in the form of surimi. Thus, the limited processed sea products consumption in our country will be increased. It is almost certain that new types of formulations and productions will emerge in
our traditional cooking style.
Köse and Uzuncan (1999) studied on the quality changes of surimi produced from horse mackerel (Trachurus mediterraneus) during frozen storage at -20°C for 5 months. TBA, TVB-N, histamine and moisture analysis and total bacteria count were carried out in the samples. The result showed that the product was in good quality during frozen storage up to 150 days.
Another investigation was carried out by Lin and Park (1997) in relation to the effective washing conditions and reduced water usage for surimi processing. Increased washing time (WT) did not enhance removal of sarcoplasmic proteins once equilibrium was reached, while the increased washing cycles (WC) continuously removed residual sarcoplasmatic proteins from the mince. No significant loss of myofibrillar proteins occurred at the low water/meat (WM) ratio (2:1 or 1:1) regardless of WC and WT.
In the investigation into the quality changes of surimi produced from whiting (Merlangius merlangus) by the semi manual method during frozen storage by Köse et al., (2000), a simple ordinary meat mincer and a food processor (a kitchen mixer) were used to produce surimi. The yield was found as 32.5 % with the ordinary meat mixer and 25.1% with kitchen mixer. Moisture, total bacteria counts, TBA and TVB-N values showed that the product was in the marketable quality for 5 months in the frozen storage. In the study related to gel strength that was increased in low-grade heat-set surimi with blended phosphates by Nielsen and Pigott (1994), the gel strength of commercial surimi was increased by addition of phosphate blends. Further increases were
Abstract
In this study, the quality changes of the surimi produced from anchovy at - 29°C in five months storage period were investigated. The produced surimi was frozen at – 35°C in air conditioned freezer and stored at – 29°C. The total volatile bases nitrogen (TVB-N), thiobarbituric acid (TBA), moisture and the total aerobic bacteria count in the frozen samples were found in the period of 30 days. On 150th day of storage, it was determined that the total aerobic bacteria count was
4.24logcfu/g, TBA value was 2.015 mg malonaldehyde/kg, TVB-N value was 6.3 mg/100g, moisture value was 74.98 %. In conclusion, it was approved that the surimi could be produced from anchovy and that during 5 months of frozen storage spoilage was low and remained within the limits.
Key Words: Surimi, frozen storage, shelf life, anchovy, chemical and microbiological quality, cryoprotectan
Nilgün Kaba1,*
1Ondokuz Mayıs University, Fisheries Faculty, 57000, Sinop, Turkey.
* Corresponding Author: Tel.: +90. 368 287 6265; Fax: +90. 368 287 6255; E-mail: [email protected]
Received 22 July 2005 Accepted 16 March 2006
obtained by complete replacement of sodium tripolyphosphate with blended phosphates.
Alvarez et al. (1995) studied the effects of salt concentrations, blending, heat treatment and moisture on the sardine gels, and the maximum gel strength (GS) was obtained at the highest salt concentrations and 78% moisture. The highest GS values were found in gels set for 40 min. However, GS decreased after prolonged heating at 90°C for 40 min. but were stable during further heating.
Pacific whiting surimi made from stabilized mince and unstabilized mince and headed and gutted fish kept at –20°C and –50°C was compared with a surimi control made from fresh fillets at 1, 30, 90 and for 180 days. After 6 months, there were no differences (p>0.05) between surimi samples prepared from stabilized mince stored at –20°C and –50°C and the control surimi (relating to torsion, measing shear stress and true strain) (Simpson et al., 1994).
Nowsad et al. (2000) studied quality changes of spent hen surimi by adding 4% sugar, 4% sorbitol and 0.2% sodium tripolyphosphate during storage at –20°C for 6 months. The gel strength of surimi was not increased by adding cryoprotectan but loss of moisture was prevented, and sensory quality was affirmatively affected.
Quality changes of surimi produced from pacific whiting during frozen storage at –18°C for 9 months was studied by Reynolds et al. (2002). They reported that the gel strength and other biochemical properties were protected during storage period.
Materials and Methods
Anchovies were headed, eviscerated, deboned and minced. The mince was washed by hand for 25 min. for four times at 1/5 meat/water proportion with
cooled tap water, and the water was changed every time. Then, it was washed twice with cooled 0.3% salt (NaCl) solution at 1/5 meat/water proportion for 10 min. and was filtered. Dehydration process was realized in a cheese bag by using wood press for 30 min. By adding 4% sugar, 0.2% sodium polyphosphate, 2.5% salt, the dehydrated surimi was mixed for five minutes by a mixer and homogenized. Some parts of the surimi were reserved for the pre-freeze analysis. Rest of it was frozen at –35°C in an air conditioned freezer and stored at –29°C.
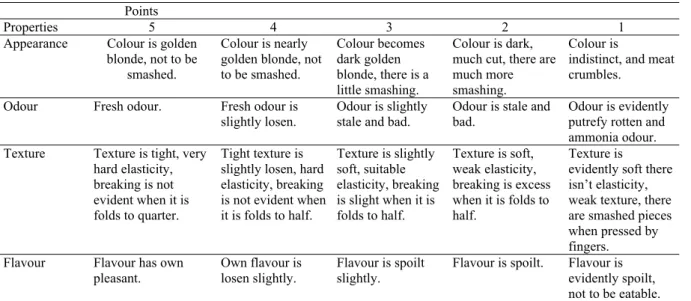
TVB-N, TBA (in meat), moisture contents and total aerobic bacteria counts were determined monthly from frozen samples. Moisture contents, TVB-N, TBA and total aerobic bacteria counts were determined according to Weende analysis method (Akyıldız, 1968); Lucke- Geidel method (Hall, 1992; Varlık et al., 1993); Tarladgis et al. (1960); Roger et al. (1987) and Göktan (1990), respectively. During the storage time, the changes in the TVB-N, TBA, moisture contents and total aerobic bacteria counts were analyzed by simple linear regression (Düzgüneş et al., 1993). The flavor evaluation of surimi was made by dredging them in flour then frying in the frying pan. Seven panelists were chosen for sensory assessment according to Table 1 (Lee, 1984; York and Sereda, 1994; Bett and Dionigi, 1997; Anon., 1998).
Results
The productivity for production stages was presented in Table 2, and the total aerobic bacteria count, TBA, TVB-N, moisture analysis were showed in Table 3. Sensory assessment analysis was showed in Table 4.
It was determined that the productivity was 22.40% in raw surimi, and 24% in cryoprotectan
Table 1. Freshness degree in surimi
Points
Properties 5 4 3 2 1
Appearance Colour is golden blonde, not to be
smashed.
Colour is nearly golden blonde, not to be smashed. Colour becomes dark golden blonde, there is a little smashing. Colour is dark, much cut, there are much more smashing.
Colour is
indistinct, and meat crumbles.
Odour Fresh odour. Fresh odour is slightly losen.
Odour is slightly stale and bad.
Odour is stale and bad.
Odour is evidently putrefy rotten and ammonia odour. Texture Texture is tight, very
hard elasticity, breaking is not evident when it is folds to quarter.
Tight texture is slightly losen, hard elasticity, breaking is not evident when it is folds to half. Texture is slightly soft, suitable elasticity, breaking is slight when it is folds to half. Texture is soft, weak elasticity, breaking is excess when it is folds to half. Texture is evidently soft there isn’t elasticity, weak texture, there are smashed pieces when pressed by fingers. Flavour Flavour has own
pleasant.
Own flavour is losen slightly.
Flavour is spoilt slightly.
Flavour is spoilt. Flavour is evidently spoilt, not to be eatable.
added surimi. In general, the surimi production yield was changing between 22-32% for the commercial production (Lee, 1984).
Results Related to Moisture
During the storage time, regression analysis was used to investigate the changes in the moisture contents. The regression graphics representing the relation between the storage time and the moisture content were shown in Figure 1. It was discovered that there was a very significant (P<0.05) and negative relationship between moisture contents and time. The moisture content in unfrozen surimi was 78.53%.
Results Related to Total Aerobic Bacteria Count
The regression analysis was carried out to find out the storage time and total aerobic bacteria count, and as a result, the regression graphics in Figure 2 was obtained. It was discovered that there was a very significant (P<0.05), directional and negative relationship between bacteria count and storage time.
The total bacteria count in fresh fish was 4.99 logcfu/g. The total bacteria number in unfrozen surimi was 5.13 logcfu/g. The increase in bacteria number might have originated from the contamination during the processing. The highest bacteria count of frozen surimi was 4.74logcfu/g at the 30th day of storage. The highest bacteria number was in unfrozen surimi. It is clear that the total bacteria count decreased during the frozen storage.
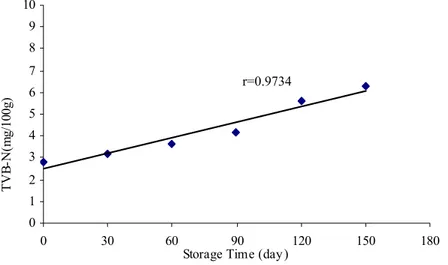
Results Related to TVB-N
Regression analysis was carried out in order to estimate the relationship between TVB-N and time, the test was applied and a very significant, positive and directive relationship was observed between TVB-N and time (P<0.05). The regression graphics was shown in Figure 3.
TVB-N value in fresh fish was measured as 4.2 mg/100g. It was detected as 2.8 mg/100g in unfrozen surimi. The most significant reason of the declining TVB-N values might be the removal of nitrogen containing compounds and water soluble proteins during the washing steps.
Table 2. Yields during surimi production steps
Production Steps Amount (g) (%)
Whole Fish 2234 100.00
Headed, Gutted and Boned Cleaned Fish 1423 63.70
Minced Fish 1382 61.90
Dehydrated Mince (Raw Surimi) 500 22.40
Cryoprotectants Added Mince (Surimi) 534 24.00
Table 3. Total aerobic bacteria count, TBA, TVB-N, moisture contents of the surimi samples which were analyzed before
and after processing, and during frozen storage
Days Total aerobic bacteria
count (logcfu/g) (mgmalonaldehyde/kg) TBA (mg/100g) TVB-N Moisture (%)
Raw material 4.99 1.092±0.003 4.2±0.200 72.75±0.020 0. 5.13 1.010±0.002 2.8±0.100 78.53±0.030 30. 4.74 1.382±0.001 3.2±0.300 76.82±0.010 60. 4.58 1.440±0.002 3.6±0.100 76.53±0.020 90. 4.47 1.482±0.003 4.2±0.200 76.08±0.030 120. 4.36 1.716±0.003 5.6±0.300 75.20±0.020 150. 4.24 2.015±0.001 6.3±0.200 74.98±0.010
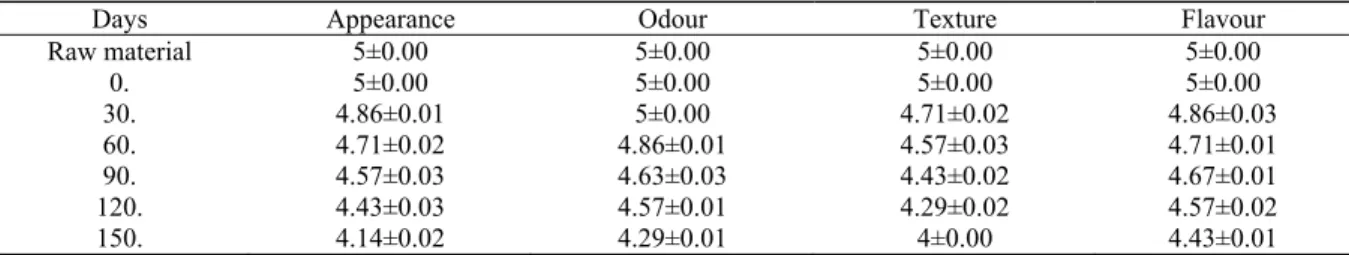
Table 4. Sensory assessments of the surimi samples which were analyzed before and after processing, and during frozen
storage
Days Appearance Odour Texture Flavour
Raw material 5±0.00 5±0.00 5±0.00 5±0.00 0. 5±0.00 5±0.00 5±0.00 5±0.00 30. 4.86±0.01 5±0.00 4.71±0.02 4.86±0.03 60. 4.71±0.02 4.86±0.01 4.57±0.03 4.71±0.01 90. 4.57±0.03 4.63±0.03 4.43±0.02 4.67±0.01 120. 4.43±0.03 4.57±0.01 4.29±0.02 4.57±0.02 150. 4.14±0.02 4.29±0.01 4±0.00 4.43±0.01
r = 0,9579 70 73 76 79 82 0 30 60 90 120 150 180
Storage T ime (day)
M o is tu re Co n te n ts ( %
Figure 1. The regression graphics representing the relation between the storage time and the moisture contents.
r = 0,9597 3,5 4 4,5 5 5,5 0 30 60 90 120 150 180
Storage Time (day)
To ta l A er ob ic B act er ia C ou nt ( lo gc fu /g )
Figure 2. The regression graphics representing the relation between the storage time and the total aerobic bacteria count.
r = 0,9734 0 1 2 3 4 5 6 7 8 9 10 0 30 60 90 120 150 180
Storage Time (day)
T V B -N (m g/ 10 0g)
Figure 3. The regression graphics representing the relation between the storage time and the TVB-N contents.
r=0.9579 r=0.9579 r=0.9734 5.5 4.5 3.5
Results Related to TBA
A regression analysis was carried out in order to understand the possible effects of storage period on TBA values and the results were shown in Figure 4. A very significant, directive and positive relationship between TBA and time was found (P<0.05). In other words, TBA values increased during the storage time. TBA value in fresh fish was determined as 1.092 mg malonaldehyde/kg and this value increased in frozen storage. The highest TBA value was detected as 2.015 mg malonaldehyde/kg on 150 days of storage. This change was below the quality loss limit. The low amount of TBA might be explained with the removal of some part of oil and blood encouraging the lipid oxidation.
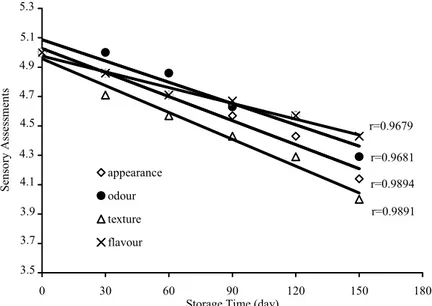
Results Related to Sensory Assessment
There was a very significantly (P<0.05) negative relationship between the sensory assessments and time (Figure 5).
Discussion
Köse et al. (1997) measured the yield of raw surimi from the anchovy as 48.3%; and cryoprotectan added surimi as 53.3%. Köse and Uzuncan (1999) estimated the productivity as 28.3 % for raw surimi from the horse mackerel, 30.5 % for the cryoprotectan added surimi. Köse et al. (2000), in their study with whiting, registered the yield as 29.4 % and 32.5% in the dehydrated mince processed with mincing
r = 0,9612 0 500 1.000 1.500 2.000 2.500 0 30 60 90 120 150
Storage Time (day)
T B A (m gM A/ kg )
Figure 4. The regression graphics representing the relation between the storage time and the TBA contents.
r = 0,9891 r = 0,9679 r = 0,9894 r = 0,9681 3,5 3,7 3,9 4,1 4,3 4,5 4,7 4,9 5,1 5,3 0 30 60 90 120 150 180
Storage Time (day)
Se ns or y A ss es sm ents appearance odour texture flavour
Figure 5. The regression graphics representing the relation between the storage time and the sensory assessments.
r=0.9612 2,500 2,000 1,500 1,000 r=0.9679 r=0.9681 r=0.9894 r=0.9891 5.3 5.1 4.9 4.7 4.5 4.3 4.1 3.9 3.7 3.5
machine and in surimi, respectively, and 23.7% and 25.1% in dehydrated mince processed with kitchen mixer and in surimi, respectively. Vareltsiz et al. (1989), stated the surimi yield from cod as 20%. Simpson et al. (1994), found it as 21-24% in their study with pacific whiting (Merluccius productus).
The water level in raw surimi changed from 80-85% to 75-79% by decreasing 8-9% after mixing with cryoprotectan (Lee, 1984). Reppond and Babbit (1993) found out the water level as 77.8% in their study with pollack. Köse et al. (1997), measured the water level as 76.98% in anchovy surimi, Köse et al. (2000) as 76.71% in whiting surimi, Köse and Uzuncan (1999) as 78.41% in horse mackerel surimi.
According to the Standards of Japanese Surimi Association, the water level in salty surimi varies between 75-78% due to fish type and the surimi quality (Sonu, 1986).
Roussel and Cheftel (1990) found out the water level as 76% in surimi produced from Atlantic sardine (Sardina pilchardus).
Aquilera and Figueroa (1992) reported mesophilic and psychrophilic bacteria counts as 4.60 logcfu/g and 4.40 logcfu/g in stabilized horse mackerel mince. Köse et al. (1997), measured mesophilic and psychrophilic bacteria counts in frozen anchovy surimi as 4.82 logcfu/g and 4.02 logcfu/g, and in unfrozen anchovy surimi as 5.08 logcfu/g and 4.51 logcfu/g. Köse et al. (2000) reported mesophilic and psychrophilic bacteria counts as 5.8 logcfu/g and 5.3 logcfu/g in unfrozen whiting, and 5.1 logcfu/g and 4.2 logcfu/g in frozen samples. Köse and Uzuncan (1999) found out mesophilic and psychrophilic bacteria counts in unfrozen horse mackerel and in frozen samples as 6.66 logcfu/g, 4.67 logcfu/g and 5.14 logcfu/g, 4.70 logcfu/g, respectively.
The permitted limit per gram is 106colony/g for fresh fish products due to the chemical and organoleptic specification. However, it is acceptable until 108 colony/g (Huss, 1988).
In this study; the total bacteria count in fresh fish, in frozen and unfrozen surimi was not below the quality limits.
In the study with the surimi produced from erublegs, it was observed that TVB-N value did not exceed 10mg/100g after processing, while it was 4.5 mg/100g at the beginning (Yoon et al., 1988). Köse et al. (1997) found out TVB-N value as 2.9 mg/100g in anchovy surimi at the end of 120th day of frozen storage. Köse and Uzuncan (1999) reported it as 3.5 mg/100g in the surimi produced from horse mackerel at the 150th day of storage, and Köse et al. (2000) reported it as 2.8 mg/100g in the surimi produced from whiting at the end of 150th day of storage. It was recommended that the total volatile base (TVB-N), which is the most significant criteria for defining the fish quality, should not be over 30-35 mg/100g in fish meat (Huss, 1988). TVB-N value increased during the storage, but stayed within the quality limits. It was found out that increasing TBA value to 3-4 mg
malonaldehyde/kg would lead to souring and quality loss in fish meat (Huss, 1988).
Lin et al. (1996), indicated that washing the mincing had a significant effect on the malonaldehyde level in frozen butterfish (Peprilus buri) mince stored for 6 months, and proposed the washing and removing of the blood species as the decreasing effect of oxidation. Köse and Uzuncan (1999), reported TBA value as 0.422 mg malonaldehyde/kg at the end of 150th day of storage in surimi produced from horse mackerel, Köse et al. (2000), reported it as 0.519 mg malonaldehyde/kg in surimi produced from whiting after five months, Köse et al. (1997) reported it as 0.954 mg malonaldehyde/kg in surimi produced from anchovy at the end of 120th day of storage.
Roussel and Cheftel (1990) studied the quality changes of surimi produced from Atlantic sardine by adding 4% sugar and 4% sorbitol stored at -45°C for 8 months. At the end of the storage period, moisture content, protein content and fat content were 76%, 14% and 1%, respectively.
Moisture content was 79 % in the study related to the effect of washing factors for surimi processing by Medina and Garrote (2002).
TBA content was 1.546 mgMA/kg in beef heart surimi after it was stored at -29°C for 3 months (Wang et al., 1999).
It was determined that, the lowest values of appearance, odor, texture and flavor were 4.14, 4.29, 4 and 4.43, respectively. The present study showed that while the sensory quality values decreased during the storage, they never decreased below the quality limits.
Conclusion
In this study, the quality changes of the surimi produced from anchovy and stored for 5 months at -29°C were investigated. It was found that surimi production could be carried out from anchovy. As for the analysis, it was determined that the spoilage was very low during the 5 months of storage. It was recommended that in order to determine the shelf life of the surimi prepared from anchovy, the longer storage time at different temperatures should be searched. Surimi production and surimi technology have the capacity to add a new aspect in processing Turkey’s sea products. Producing surimi partly from fresh fish in the market place could encourage the consumption throughout the year. The opportunity to utilize the waste in the processing stage as fish oil and flour would emerge.
References
Akyıldız, R. 1968. Yemler Bilgisi Laboratuvar Kılavuzu, Ankara Üniversitesi Ziraat Fakültesi Yayınları, No: 358, Ankara, 214 pp.
Alvarez, C., Couso, I. and Tejada, M. 1995. Sardine surimi gels as affected by salt concentration, blending, heat treatment and moisture. Journal of Food Science,
N. Kaba / Turk. J. Fish. Aquat. Sci. 6: 29-35 (2006) 35
60(3): 622-626.
Anonymous 1998. Torry Taste Panels. Nutrition Food Science, 2-4.
Aquilera, J.M. and Figuora, G. 1992. Combined methods technology in the preservation of pelagic mince. Sea Food Science and Technology, 127-136.
Bett, K.L. and Dionigi, C.P. 1997. Detecting Seafood off- Flavors: Limitations of sensory evaluation. Food Technology, 51( 8): 70-79.
Düzgüneş, O., Kesici, T. and Gürbüz, F. 1993. İstatistik Metodları II., Ankara Üniversitesi Ziraat Fakültesi Yayınları, 1291, Ders Kitabı. 369, Ankara, 218 pp. Göktan, D. 1990. Gıdaların Mikrobiyal Ekolojisi. Ege
Üniversitesi Mühendislik Fakültesi Yayınları, No: 21, İzmir, 292 pp.
Hall, G.M. 1992. Fish Processing Technology. Blackie Academic Professional, New York, 309 pp.
Huss, H. 1988. Fresh Fish Quality and Quality Changes. FAO Fisheries Series: 29 Rome, 132 pp.
Köse, S., Uzuncan, Y. and Ay, S. 1997. Hamsinin alternatif değerlendirme olanakları, Akdeniz Balıkçılık Kongresi, 9-11 Nisan, İzmir-Türkiye.
Köse, S. and Uzuncan, Y. 1999. An investigation into quality changes of surimi produced from horse mackerel (Trachurus mediterraneus L., 1758) during frozen storage at –20°C for five months. Journal of Fisheries and Aquatic Sciences, 16(3-4): 269-279. Köse, S., Uzuncan, Y. and Özer, N.P. 2000. Mezgit
(Merlangius merlangus L., 1758)’ten Yarı Manuel Yöntemle Surimi Eldesi ve Donmuş Depolama Esnasındaki Kalite Değişimleri Üzerine Bir Araştırma. IV. Su Ürünleri Sempozyumu, 28-30 Haziran, Erzurum, Türkiye.
Lee, C.M. 1984. Surimi process technology. Food Technology, 38 (11): 69-80.
Lin, T.M. and Park, J.W. 1995. Effective washing conditions reduce water usage for surimi processing. Journal of Food Science, 60(1): 4-9.
Lin, T.M., Meyers, S.P. and Godber, J.S. 1996. Storage stability of butterfish mince (Peprilus buri) as affected by washing, antioksidants and vacuum packaging. Journal of Aquatic Food Product, 21:5-9.
Nielsen, R.G. and Pigott, G.M. 1994. Gel strength increased in low-grade heat–set surimi with blended phosphates. Journal of Food Science, 59(2): 246-250.
Nowsad, A.A., Huang, W.F., Kanoh, S. and Niwa, E. 2000. Washing and cryoprotectant effect on frozen storage of spent hen surimi. Poultry Science, 79: 913-920. Medina, J.R. and Garrote, R.L. 2002. Determining washing
contitions during the preparation of frozen surimi from surubi (Pseudoplatystome coruscans) using response surface methodology. Journal of Food Science, 67: 1455-1461.
Reppond, K.D. and Babbit, J.K. 1993. Protease inhibitors affect physical properties of arrowtooth flounder and walleye pollack surimi. Journal of Food Science, 58(1): 96-98.
Reynolds, J., Park, J.W. and Choi, Y.J. 2002. Physicochemical properties of Pacific whiting surimi as affected by various freezing and storage conditions. Journal of Food Science, 67(6): 2072-2078.
Roger, S., John, I., Mark, W. and Page, P. 1987. General Microbiology. Fifth edition, published by Macmillan Education Ltd, Houndmills, Basingstoke, Hampshire RG212XS and London, 689 pp.
Roussel, H. and Cheftel, J.C. 1990. Mechanism of gelation of proteins: Influence of thermal processing and of various additives on the texture and protein solubility of kamaboko gels. International Journal of Food Science and Technology, 25: 260-280.
Simpson, R., Kolbe, E., Macdonald, G., Lanier, T. and Morrissey, M.T. 1994. Surimi production from partially processed and frozen pacific whiting (Merluccius productus). Journal of Food Science, 59(2): 272-276.
Simpson, R., Morrissey, M.T., Kolbe, E., Lanier, T.C. and Macdonald, G.A. 1994. Effect of varying sucrose concentrations in Pacific whiting (Merluccius productus) stabilized mince used for surimi production. Journal of Aquatic Food Product Technology, 3(4): 41-52.
Sonu, C.S. 1986. Surimi, National Marine Fisheries Service, NOAA, Terminal Island California. NMFS-SWR-013.
Tarladgis, E.G., Watts, B.M. and Younathan, M.T. 1960. A distillation method for the quantitative determination of malonaldehyde in rancid foods. J. Am. Qil Chemists Soc. 37: 44-48.
Vareltsiz, K., Zetou, F., Soultos, N. and Tsiaras, I. 1989. Use of hake (Merluccius merluccius) surimi in a frankfurter formulation. Int. J. of Food Sci. and Technology, 45: 277-281.
Varlık, C., Uğur, M., Gökoğlu, N. and Gün, H. 1993. Su Ürünlerinde Kalite Kontrol İlke ve Yöntemleri. Gıda Teknolojisi Derneği, Yayın No: 17, İstanbul, 174 pp. Wang, B., Xiong, L.Y. and Moody, G.W. 1999.
Physicochemical and sensory properties of restructured beef steaks containing beef heart surimi. Int. J. of Food Sci. and Technology, 34 : 351.
Yoon, I.H., Mathces, J.R. and Rasco, B. 1988. Microbiological and chemical changes of surimi-based imitation crab during storage. Journal of Food Science, 53(5): 1343- 1346/1426.
York, R.K. and Sereda, L.M. 1994. Sensory assessment of quality in fish and seafoods. In: F. Shahidi and J.R. Botta (Eds.) Seafoods: Chemistry, Processing Technology and Quality, Canada: 232-262.