INTEGRATING VEHICLE ROUTING WITH CROSS DOCK IN SUPPLY
CHAIN
Farshad Farshchi
Department of Industrial Engineering, Parand Branch, Islamic Azad University, Parand, Iran Davood Jafari
Department of Industrial Engineering, Parand Branch, Islamic Azad University, Parand, Iran [email protected]
Shahab Sepehri Moghaddam
Department of Industrial Engineering, Parand Branch, Islamic Azad University, Parand, Iran ABSTRACT
This article provides a unified mathematical model of cross dock with vehicle routing in supply chain and the model is using tabu search. This study, in terms of purpose is applied and the method of data collection is descriptive. In this study, data collection of theses and articles are extracted, including location coordinates of cross dock, suppliers and customers and demand of supplier and customer for each pair. In order to achieve the goal of a mathematical model for the problem to minimize the total distance traveled objectives and maximize customer demand has been answered were presented. Since the problem is NP-Hard, we need to solve the model through methods such as Tabu Search meta-heuristic such as lead; this was done by software Matlab. To realize the accuracy and efficiency of the model, problems with small size (less than 200 seconds solution time) and medium size (solution time between 200 and 1000 seconds) was designed. By solving these problems became clear that the model is the necessary performance. Software issues exact solution able to solve them in less than 200 seconds was among the small issues have been Classification (runtime ≤ 200). According to resolve the issues, growth in complexity and time is required by the software solution to boost car and customers. For an average size of software issues with the exact solution used in this study GAMS IDE / Cplex's ability to solve problems within 1,000 seconds show. The results also showed a considerable scatter in the time needed to resolve these issues so that the time is variable between 289.8 and 998.2 seconds and average amounts to 579.3 seconds. Then Algorithm for consolidated performance in comparison with results from software GAMS IDE /Cplex compared with each other to solve small and medium investigated. According to the results obtained in solving the problems of small and medium-sized meta-heuristic has been shown to have an efficient performance.
Keywords: integration, cross dock, vehicle routing, supply chain, tabu search
INTRODUCTION
Distribution strategies in supply chain management are the most important factors. Generally, two types of distribution strategy is discussed, the items may be sending directly from the supplier or manufacturer to retail outlets or customer. The items may be sending to the final customer via storage points e.g., types
of warehouses or distribution centers pass (Simchi et al., 2009). The routing and scheduling of vehicles is the most important issues that arise in distribution networks. Problem solving routing vehicles, a key factor in transportation management and supply chain coordination is different.
In general, routing and scheduling to solve the problem of vehicles, including a fleet and determine the allocation of orders to write the orders. Minimum objective is the total cost of transportation, including cost of ownership (and depreciation) cost of vehicles traversing the route planner. In addition, the increase in energy consumption associated with transportation and its damaging effects on the environment, more attention to this problem have focused on issues related to the routing vehicles in a distribution network is proposed, the possibility Send specifics of the demand to customers, in the sense that a customer demand is divided between multiple devices and multiple visits are sent to the user. (Shahin Moghadam et al., 2014)
Sometimes, in fact, besides being a customer may demand more than the capacity of the vehicle, dividing time between customers can carry more than a means to reduce the total distance traveled or decrease the number of vehicles is needed to carry. Despite the possibility of routing the vehicles details, limitations classic problem free alignment and makes it possible for a customer to demand to be met by several means postage, thereby reducing (Wakeel, 1989). The computational complexity SDVRP continues to be NP-Hard (Wakeel, 1990).
Dock storage time is one of the most creative strategies, which have the potential ability to control logistics costs, distribution and maintain the level of service to clients (Ene & Öztürk, 2014). Piping that separated the items received from different suppliers and for new shipments of various items, re-together combine to be sent to customers to dock at the same time, say one of the most important things in the dock should Dock and at the same time be a large impact on costs, assessment of the vehicle dock is in the external environment. Automotive shipments from suppliers to collect and bring to the dock, then dock again with the combination of cargo in new packaging, and are sent to customers. Cars can be collected in one direction or if the cargo suppliers of high-volume supply has been sent or are suppliers of high placed individually in one direction.
However, the accounts were raised in this article, vehicle routing problem with regard to the temporary storage medium, it is possible to send details with homogenous vehicles
the main issue raised in this study with previous research in this field, taking into account the vehicle with different capacity and maximum demand answers given to customers. Therefore, another objective mathematical model to maximize response to customers will be added and the limitations of models based on variable duty vehicles be altered. Since the transfer of a significant portion of the total logistic costs include, the aim of this research is to find the vehicles and timing of operations in order to minimize total cost is transportation.
RESEARCH EXPERIMENTAL BACKGROUND
Mousavi et al. (2013) study entitled "hybrid algorithm for mapping and routing of vehicles and Dock" do problem solving algorithm and simulated annealing search was forbidden. Acceptable results in computation time using the hybrid algorithm (quoting Shahin Moghadam et al., 2014). Shahin Moghadam et al. (2014), a study entitled "Considering Dock vehicle routing and scheduling
details" problem was a combination of Ant Colony and Simulated Annealing. The implementation of hybrid algorithm for 200 pairs is in relation to each algorithm. Lee et al. (2006), a study entitled "routing vehicles for the central warehouse in the supply chain" did. Tabu Search was a problem-solving method. The results of a maximum of 50 nodes were compared with the results of complete blood count, which leads to better solutions Tabu Search was Van et al. (2009), a study entitled "vehicle routing and cross dock" and Tabu Search method of problem solving using adaptive memory did. The results of the 5 categories with 200 pairs of nodes showed better performance than the lower limit. Liav et al. (2010) study entitled "Determination of the cars and cross dock" with Tabu Search method of problem solving based on the initial solution was the initial answer did return path. The proposed algorithm optimizes of the number of vehicles as well as better performance than the exact solution of the research results.
Definition of Conceptions:
Cross dock: cross dock distribution strategy is one in which the consolidation of cargo from storage to prevent the long-term output and input to vehicles or temporarily stored until they are finally delivered to the customer. In this approach, warehousing, cargo, usually less than 24 hours remain in stock. (Epteh, 2000)
Vehicle routing problem: an issue where you have a set of directions for the flow of vehicles that are determined based on one or more storage to a set of customers who geographically scattered service of the Santos, et al, (2011).
Shipping cost: The total distance traveled by automobiles in the external environment Dock to say shipping cost.
PROBLEM DESCRIPTION
In this study, the cross dock with a vehicle routing in the supply chain were investigated. This includes the transportation of goods from suppliers to the respective customers with considering cross dock strategy. For modeling, the following assumptions have been considered:
• capacity vehicles is limited. • Vehicles have different capacities. • Customer demand is clear.
• It is possible to all customer needs not answered. • All customers must be met.
• Survival of current conditions is established.
MATHEMATICAL MODEL
For the problem described a mathematical model in throughput. To this end, indices, parameters and variables described and defined constraints with the objective function are presented.
P: set of of pick up nodes P = {1,2, ..., n}
D: set of delivery nodes write D = {n, n + 1, ..., 2n}
(i, i + n): request pair in which i is the pick up node and i + n is the corresponding delivery node O: cross dock denoted by 4 nodes of the set O = {o1, o2, o3, o4}. The first two nodes represent the starting and ending points of pick up routes respectively and the next two nodes represent the starting and ending points of delivery routes respectively
N: the set of all nodes of the network E: set of arcs or edges
K: set of vehicles
B) Parameters
Cij: distance between two nodes i and j [Ai, bi]: The time window for meeting node i
di : Demand quantity of node i, (i≤P) Qk : The capacity of a vehicle k
A: The time to prepare a vehicle for unloading or reloading in cross dock B: The time required for unloading or loading a pallet
C) Variables
: if vehicle k travels from node i to node j is equal to 1, otherwise is equal to 0 : if vehicle k unloads request i in cross dock is equal to 1, otherwise is equal to 0 : if vehicle k reloads request i in cross dock equal to 1, and otherwise is equal to 0 : if vehicle k has to unload at cross dock is equal to 1, otherwise is equal to 0 : if vehicle k has to reload at cross dock is equal to 1, otherwise is equal to 0 : The time at which vehicle k leaves node i
: The time at which the reloading process of vehicle k finishes at cross dock: The time at which the request i is unloaded by its corresponding pick up vehicle at cross dock
: The fraction of request i delivered by vehicle k Also, M is an arbitrary large number.
D) Mathematical Formulation
The mathematical formulation of the problem is described as follows
So that:
In our model, the objective function (1) is the first objective function is to minimize the total distance (time) traveled, also minimizing waste time in the cross dock to load or unload products. Objective function (2) maximize customer demand to be delivered. constraints (3) and (4) denote that for each pick up and delivery vehicle, the load should not exceed the vehicle capacity. constraints (5) states that the pick up route of each vehicle should begin from o1 and delivery routes should begin from the point o3. constraints (6) correspond to the flow conservation constrain. constratits (7) ensure that all the pick up vehicles return to cross dock at point o2 and the delivery vehicles at point o4. Restriction (8) states that may not answered all customer demand. Limitations (9), travel time between two consecutive nodes are measures. Constraint (10) ensure that each node is visited within its specified time window. Constraints (11), ensure that the customer’s demand is delivered only if a vehicle travels to that customer (It should be noted that this constraints with the constraints (12) ensure that every customer is met at least once).
Constraints (13), (14) and (15) and also the second part of the objective function(1) will result in the appropriate values of the and in below conditions: if vehicle k picks up request i but does not deliver it to node i + n, it has to unload request i at cross dock; if vehicle k has not picked up request i but should deliver it to node i + n, then it has to reload the request at cross dock; if vehicle k has neither picked up nor delivered the request i, it should not unload or reload any product at cross dock; if vehicle k picks up request i and should deliver the whole request to node i + n, it should not unload or reload any product at cross dock and if vehicle k picks up request i and should deliver some of its request to node i +
n, it should unload some of the request at cross dock.
Constraints (16) to (22) denote the work flows inside the cross dock and timing of vehicles at cross dock. constraints (16) makes , 1 if the vehicle k needs to unload at cross dock. Constraints (17) state that the unloading time of vehicle k consists of a fixed preparation time (A) and the time needed to unload the products (which is the time needed to unload a pallet (B) multiplied by the number of pallets that should be unloaded). Constraints (18) and (19) ensure that the reloading process of a vehicle would not begin until its unloading process has not finished and all the other requests have not been prepared for reloading. Constraints (20), shows preparation time of products for customer i. Constraints (21) and (22) are defined for reloading operation. Constraints (23), (24) and (25) to determine the allowable range defined variables.
METHODOLOGY
This study in terms of purpose, is applied to the face to provide a unified mathematical model of cross dock with vehicle routing solution in the supply chain model using tabu search was carried out. In terms of data collection is descriptive. In order to develop a library of literature and literature survey method used. In this study, data collection of theses, articles are extracted, including location coordinates of cross dock, suppliers and customers and demand of supplier and customer for each pair. The time window for each supplier and customer specified. This paper presents a mathematical model for the problem to minimize the total distance traveled objectives and maximize customer demand has been answered were presented. In order to design a network with the desired maximum performance, it was decided, in addition to determining the number of system parameters are optimal policies at the macro level are getting smaller levels, especially in the field of travel planning and integrated be designed with the proper functioning. Finally it comes to formulating appropriate operations research model to find the optimal solution using the methods and the software solution seems accurate. So, in order to validate the model, operations research, code in the software GAMS IDE /Cplex exact model it is necessary to resolve the issues as diverse sample sizes are smart and randomly generated. Since the problem is NP-Hard, we need to solve the model through methods such as such as Tabu Search meta-heuristic is this is done by software Matlab and simulation in the following manufacturing process for random investigated. According to the objective of the proposed model is required to use multi-criteria decision-making methods used to solve it.
THE PROPOSED ALGORITHM TO SOLVE PROBLEM:
Elitist tabu search is the method used in this study. The purpose of this algorithm is to produce feasible solution which is in appropriate level of utility. The structure of this algorithm is as figure(1). It has to mention that ideal point is the virtual point which it's coordinates optimized by optimal solution of each objective function separately. It is difficult to obtain ideal point. Therefore dynamic point is introduced that it's coordinated contained from local optimum solution approximately. It is intelligent approach at the end of each iteration.
Figure (1) - The complete structure Tabu Search of elicits-orientation
RESEARCH FINDINGS THE MODEL VALIDATION
In this part of the objective to check the validity and accuracy of the proposed model, 14 different aspects of the problem with the 7 issue of small and medium-sized 7 problems are resolved. It should be noted that to solve the dual objective of the proposed method has been used in the previous section.
MODELS IN SMALL SIZES
Start Determination dynamic ideal point Production of basic feasible solution Apply the approach to the current answer now Produced admission requirement
for Czech
answer now
Is the solution accepted? Add solution to the set of solutions and forbid moving and update ideal spot Yes No Is the algorithm repeated N iteration? Yes Output Report ranking and answers now End No Put the accepted solution in the present solutionDimensions issues produced in small sizes in Table 1 are shown. The first column of issue number, the second column on the number of cars and the third column is the number of customers.
Table (1): Dimensions of problems to validate the proposed model
Dimensions Problems Customer no. Vehicle no. 5 3 P01 7 3 P02 10 4 P03 12 4 P04 12 5 P05 14 5 P06 20 6 P07
Chart (1): Change index to show that the problem of small sizes. As can be seen in this graph problems
have been produced in a manner that is becoming gradually larger problems.
The results of using GAMS software solutions in the table (2) are provided.
Table (2) Results solve the problems presented
Solver Proble m GAMS 1
f
− 1f
∗ 1f
+ 2f
− 2f
∗ 2f
+ Z runtime P01 20133792 17405490 17246488 4258 4588 4644 0.100557 3.7243 P02 21182764 17803336 17075440 5780 6096 6561 0.386236 5.2673 P03 23983599 21130014 20770476 7995 8921 9620 0.271164 11.7262 P04 29321956 26140667 23549199 9761 11603 11846 0.282743 39.377 P05 31518935 26661670 24251842 10222 11814 11840 0.173697 55.95525 P06 39955467 32197556 31082517 12404 12828 13295 0.324915 114.8578 P07 44004739 38272036 36717575 17106 19039 19750 0.241056 198.6234 Min 20133792 17405490 17075440 4258 4588 4644 0.100557 3.7243 Mean 30014465 25658681 24384791 9646 10670 11079 0.254338 61.3616 Max 44004739 38272036 36717575 17106 19039 19750 0.386236 198.6234Index values, the present and the obtained value for the objective functions are shown in the table-are production issues. About changes in values and the average of the last three lines are for small things. Software solutions can solve the problems detailed in less than 200 seconds in the form of small issues have been considered.
MEDIUM-SIZED MODELS
According to the results of solving the problems of small sizes, can be found on the accuracy and efficiency of the model are presented. Real-world problems are usually large dimensions. In this regard, sought to increase with increasing size model, we evaluate the complexity of the issues. Results related to solving problems in Table 3 are average size. Index changes for 7 with an average size are shown in Figure 2. The dimensions of these problems are shown in Table 3.
Table 3: Problems to validate the proposed model Dimensions Problem Customer no. vehicle no. 22 7 P01 25 8 P02 28 8 P03 30 9 P04 35 10 P05 40 11 P06 45 12 P07
Figure 2. Change index to show the problem with an average size. As can be seen in this graph problems
have been produced in a manner that is becoming gradually larger problems.
Figure (2) Change index to the average
Table (4) Results solve the problems presented Solver Problem GAMS 1
f
− 1f
∗ 1f
+ 2f
− 2f
∗ 2f
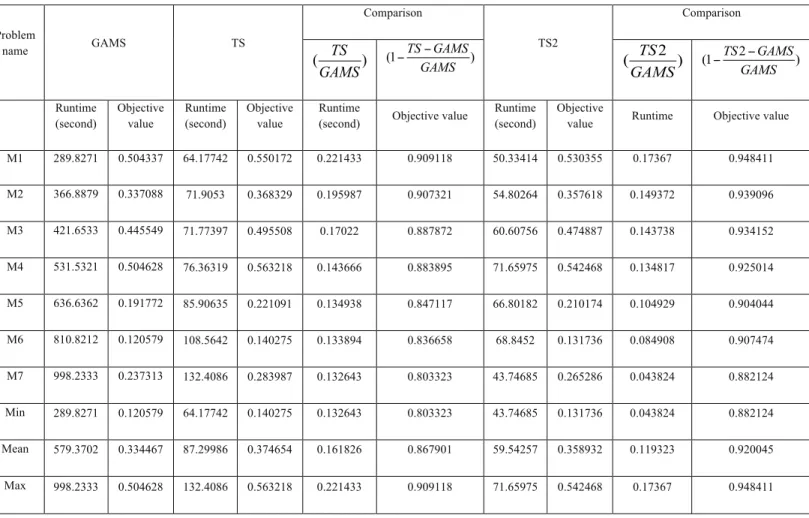
+ Z Runtime P01 53401558 45261842 41134446 19649 20197 21322 0.504337 289.8271 P02 66806951 61629376 58002559 22134 22803 23040 0.337088 366.8879 P03 70511131 64141781 59553178 24038 26381 28479 0.445549 421.6533 P04 82955537 79050726 73108230 26543 27788 28639 0.504628 531.5321 P05 93444538 85694690 83724604 29162 33170 34056 0.191772 636.6362 P06 97976029 88990951 88824197 34541 39277 40636 0.120579 810.8212 P07 120805607 1.04E+08 98139526 37062 43850 45918 0.237313 998.2333 Min 53401558 45261842 41134446 19648.53 20197.1 21322.08 0.120579 289.8271 Mean 83700193 75482025 71783820 27589.65 30495.27 31727.11 0.334467 579.3702 Max 120805607 1.04E+08 98139526 37061.86 43850.11 45918.07 0.504628 998.2333The table above includes specifications of 7 medium size and exact solution results. Growth of medium size issues in all its dimensions are easily understood as compare to small size in Tables 2 and 4. The The software used in this study is GAMS IDE / Cplex's which hast the ability to solve problems within 1000 seconds. Considerable scatter seen in the runtime of these problems so that the time varies between 289.8 and 998.2 second and average time is 579.3 seconds.
VALIDATION META-HEURISTIC ALGORITHMS
SOLVES PROBLEMS USING META-HEURISTIC ALGORITHMS PROPOSED AND COMPARISON WITH THE EXACT SOLUTION IN SMALL SIZES
Given the complexity of the optimization problem in this study, the use of meta-heuristic algorithms to reduce the complexity and time required to solve. It is necessary before attempting to solve problems of realistic large-scale banned by search algorithms (TS) and tabu search elitist (TS2) provided in the study of the reliability and performance of meta-heuristic to solve sample problems with small and medium-sized ensured. Moreover, the results of problem solving meta-heuristic presented with a small size in comparison with the exact solution results are presented in two axes and run-time efficiency.
Table (5) The results of meta-heuristic algorithms to solve the problems small sample size and
comparison with the exact solution results
Comparison TS2 Comparison TS GAMS Problem name 2 (1 TS GAMS) GAMS − − 2 ( TS ) GAMS (1 TS GAMS) GAMS − − ( TS ) GAMS Objective value Runtime Objective value Runtime (second) Objective value Runtime (second) Objective value Runtime (second) Objective value Runtime (second) 1.0000 0.4055 0.1006 1.5101 1.0000 0.3983 0.1006 1.4834 0.100557 3.7243 S1 1.0000 0.3964 0.3862 2.0881 1.0000 0.3433 0.3862 1.8083 0.386236 5.2673 S2 1.0000 0.3553 0.2712 4.1661 1.0000 0.3387 0.2712 3.9717 0.271164 11.726 S3 0.9899 0.2827 0.2856 11.1338 0.9772 0.3292 0.2892 12.9629 0.282743 39.377 S4 1.0000 0.2255 0.1737 12.6154 0.9682 0.2988 0.1792 16.7194 0.173697 55.955 S5 0.9672 0.1927 0.3356 22.1366 0.9297 0.2636 0.3477 30.2765 0.324915 114.857 S6 0.9610 0.1828 0.2505 36.3181 0.9222 0.2436 0.2598 48.3847 0.241056 198.623 S7 0.9610 0.1828 0.1006 1.5101 0.9222 0.2436 0.1006 1.4834 0.100557 3.7243 Min 0.9883 0.2916 0.2576 12.8526 0.9710 0.3165 0.2620 16.5153 0.254338 61.3616 Mean 1.0000 0.4055 0.3862 36.3181 1.0000 0.3983 0.3862 48.3847 0.386236 198.6234 Max
The relative performance meta-heuristic to solve small issues compared to the exact solution based on two pillars of efficiency and runtime compared to Table 5 and then for TS2 is a first for TS. It can be seen that Algorithm for TS able to solve small issues an average of more than 97% of efficiency achieved in 31% of the time the exact solution. It is clear from the above table that in three of the seven issues above example, the final answer is sent Algorithm for TS on solving exact matches. TS2 has managed Algorithm In this section, an average of more than 98% of efficiency achieved in 30% of the time the exact solution. It is clear from the above table that in four of the seven issues above example, the final answer is sent Algorithm for TS on solving exact matches. After a look at these two meta-heuristic algorithms, in most cases better than TS TS2 algorithm operated can be found.
SOLVING PROBLEMS USING HEURISTIC ALGORITHM AND COMPARISON WITH THE EXACT SOLUTION IN MEDIUM SIZE
Now, in order to better and more comprehensive performance hybrid algorithm with exact solution, the results of the medium size are compared by both the software described above. It is necessary before attempting to solve problems of realistic large scale by meta-heuristic algorithms TS and TS2 presented in this study, the reliability and performance of meta-heuristic mentioned in solving the problems of the small and medium sized ensured. Moreover, the results to solve problems of medium sized with meta-heuristic and comparison with the exact solution based on two optimality and run time is given.
Table 6. Results of solving sample problems with the medium size by meta-heuristic and comparison
with the exact solution
Comparison TS2 Comparison TS GAMS Problem name 2 (1 TS GAMS) GAMS − − 2 ( TS ) GAMS (1 TS GAMS) GAMS − − ( TS ) GAMS Objective value Runtime Objective value Runtime (second) Objective value Runtime (second) Objective value Runtime (second) Objective value Runtime (second) 0.948411 0.17367 0.530355 50.33414 0.909118 0.221433 0.550172 64.17742 0.504337 289.8271 M1 0.939096 0.149372 0.357618 54.80264 0.907321 0.195987 0.368329 71.9053 0.337088 366.8879 M2 0.934152 0.143738 0.474887 60.60756 0.887872 0.17022 0.495508 71.77397 0.445549 421.6533 M3 0.925014 0.134817 0.542468 71.65975 0.883895 0.143666 0.563218 76.36319 0.504628 531.5321 M4 0.904044 0.104929 0.210174 66.80182 0.847117 0.134938 0.221091 85.90635 0.191772 636.6362 M5 0.907474 0.084908 0.131736 68.8452 0.836658 0.133894 0.140275 108.5642 0.120579 810.8212 M6 0.882124 0.043824 0.265286 43.74685 0.803323 0.132643 0.283987 132.4086 0.237313 998.2333 M7 0.882124 0.043824 0.131736 43.74685 0.803323 0.132643 0.140275 64.17742 0.120579 289.8271 Min 0.920045 0.119323 0.358932 59.54257 0.867901 0.161826 0.374654 87.29986 0.334467 579.3702 Mean 0.948411 0.17367 0.542468 71.65975 0.909118 0.221433 0.563218 132.4086 0.504628 998.2333 Max
Submit Date: 10.05.2016, Acceptance Date: 25.06.2016, DOI NO: 10.7456/1060JSE/001
It is observed that Algorithm for TS able to solve problems mean average of approximately 87% of optimality in only 16% of the time achieves the exact solution. Slightly hesitant realized a 15% reduction in the average time of Algorithm for Solving TS compared with the exact solution (from 31 to 16%) in exchange for a 10% reduction in mean relative efficiency of the two algorithms answer (from 97 to 87%) as a result of examples of issues we increase the scale of small to medium size. TS2 also Algorithm for be able to solve problems mean average of approximately 92% of optimality in only 12% of the time achieve the exact solution. This section also noticed a reduction of 18% in average time of Algorithm for Solving TS2 compared with the exact solution (from 30 to 12%) in exchange for a reduction of 6% on average relative efficiency of the two algorithms answer (from 98 to 92%) in thus increasing the size of our sample problems of small to medium size. It is quite sensible that TS2 algorithm has better performance than TS algorithm in large dimensions.
CONCLUSIONS:
Here is a summary of the research findings are presented: to realize the accuracy and efficiency of the model, problems with small (less than 200 seconds solution time and average solution time between 200 and 1000 seconds) was designed. By solving these problems became clear that the model is the necessary performance.
The problem is also solved exponentially with increasing size that this reflects the complexity of the problem is investigated. For this purpose, meta-heuristic algorithms for solving the large-scale provided. Software issues exact solution able to solve them in less than 200 seconds was among the small issues have been Classification (runtime ≤ 200). It was observed that the precise software solution to solve these issues in a time of 61.36 seconds on average needs and optimal response to these issues ranged from 3.72 to 198.62 seconds earned. According to resolve the issues, growth in complexity and time required by the software solution to boost car and customers In order to compare the effectiveness of different the complexity and more time solving large-scale problems solved. For an average size of software issues with the exact solution used in this study GAMS IDE / Cplex's ability to solve problems within 1,000 seconds show. Considerable scatter in the time needed to resolve these issues is seen as the time between 289.8 and 998.2-second variable and average value of 579.3 seconds-is taken. After seeing the exact solution tested and validated quality and performance Algorithm for compilation in comparison with results from software GAMS IDE /Cplex discussed. In this regard, the performance of these two methods is compared with each other to solve small and medium investigated. According to the results obtained in solving the problems of small and medium-sized meta-heuristic has been shown to have an efficient performance.
REFERENCES
Simchi-Levi, D.,Kaminsky,P., Simchi-Levi,E, (2009); Designing And Mnageing The Supply Chain: Concepts, Strategies, and Case Studies, 3rd Edition,International edtion, McGraw-Hill/Irwin.
Apte, U. M., & Viswanathan, (2000); S, "Effective cross docking for improving distribution efficiencies". International Journal of Logistics Research and Applications 3(3) 291-302.
Dror, M., Trudeau, P. (1989); "Savings by split delivery routing", Transportation Science 23,141-145,. Dror M., Trudeau, P. (1990); "Split delivery routing", Nav. Res. Logist, 37(3) 383-402.
Wen, M., Larsen, J.,Clausen, J., Cordeau, J., and Laporte, G. (2009) ; "vehicle routing with cross-docking", Journal of the Operational Research Society 60(12) 1708-1718.
Lee, Y. H., Jung, J. W., & Lee, K,M. (2006), "Vehicle routing scheduling for cross-docking in the supply chain", Computers & Industrial Engineering, 51(2), 247-256.
Liao, C. J., Lin, Y., Clausen, J., Coredeau, J., and Laporte, (2010), G. ; "Vehicle routing with cross-docking in the supply chain". Expert Systems with Applications, 37(10),6868-6873.
Santos, F.A., Mateus, G.R., & Salles da Cunha, A.( 2011) ; "A Branch-and-priice algorithm for a Vehicle Routing Problem with Cross-Docking". Electronic Notes in Discerete Mathematics, 37, 249-249254. Shahin Moghadam, S., Fatemi Ghomi; S.M.T, (2014), Vehicle routing scheduling problem with cross docking and split deliveries, computers and chemical Engineering, Elsevier, PP, 98-107.
Ene, S., & Öztürk, N. (2014). Open loop reverse supply chain network design. Procedia-Social and Behavioral Sciences, 109,1110-111.