115
IMPACT OF SUSTAINABILITY PERFORMANCE OF COMPANY ON ITS FINANCIAL PERFORMANCE: AN EMPIRICAL STUDY ON BORSA ISTANBUL
(BIST)
Şerife ÖNDER
Abstract
The aim of this study is to investigate the effect of institutional sustainability, the reflection of cyclical economy concept at the macro level on business organizations, on profitability through the organizations in Turkey. For this reason, Multiple Linear Regression Analysis was applied with the data of 33 business organizations preparing sustainability report according to Global Reporting Initiative (GRI) and located in Istanbul stock exchange (BIST). In this study, in which business organization profitability was measured by Return on Assets (ROA), sustainability was measured with five different variables including both Overall Sustainability Rating and Community Employees, Environmental and Governance Performance Rating which are subtitles. In this study, two different models were used considering sustainability measurement (from bot h main topics and subtopics). After the analysis, it was found out that sustainability applications in Turkey affected profitability statistically significant and positive way. It was found out that this effect of sustainability resulted from the environmental applications of the business organization and environmental factors positively affected business organization profitability.
Keywords: Corporate sustainability, sustainability reporting, business profitability
Jel Classifications: M41, Q56
İŞLETMELERİN SÜRDÜRÜLEBİLİRLİKLERİNİN İŞLETME PERFORMANSI ÜZERİNDEKİ ETKİSİ: BIST ÜZERİNE AMPİRİK BİR ÇALIŞMA
Öz
Bu çalışmanın amacı, Türkiye’de işletmelerin sürdürülebilir olmasının işletmenin karlılığına etkisinin olup olmadığının araştırılmasıdır. Bu nedenle 2015 yılında Global Reporting Initiative (GRI)’ye göre sürdürülebilirlik raporu bulunan ve Borsa İstanbul’da (BİST) yer alan işletmelerin 33 işletmenin verileri kullanılarak çoklu doğrusal regresyon analizi yapılmıştır. İşletme karlılığının Return on Assest (ROA) tarafından ölçüldüğü çalışmada sürdürülebilirliğin genel puanı ve alt başlıklarını kullanan iki farklı model kullanılmıştır. Yapılan analiz sonucunda işletmelerin sürdürülebilirliğinin karlılık üzerinde istatistiksel olarak anlamlı fakat düşük oranda etkilediği sonucuna ulaşılmıştır. Ayrıca sürdürülebilirliğin alt başlıklarında karlılık üzerinde çevre skorunun önemli bir etki yarattığı görülmüştür.
Anahtar Kelimeler: Kurumsal sürdürülebilirlik, sürdürülebilir raporlama, işletme karlılığı JEL Kodları: M41, Q56
Dr. Öğr. Üyesi, Dumlupınar Üniversitesi Kütahya Sosyal Bilimler Meslek Yüksekokulu Muhasebe Ve Vergi
116
1. Introduction
The term Circular economy (CE) was first used formally by Pearce and Turner (1990) in economy politics. Writers, depending on the principle “everything is an input to everything else”, have critically studied traditional linear economy which is based on consumption since the early Industrial Revolution. In the end, they developed a new economy model called circular economy (Rizos et al, 2017). Today circular economy grounding on ecology with a circular system challenges traditional economy approach based on a linear model of resource exploitation (Vildasen et al, 2017).
CE a is a concept which national governments of many countries prompted by UN like China, Japan, France, England, Canada, Holland, Sweden and Finland and many global businesses interested in. Traditional linear extract-produce-use-dump material and energy flow model of the modern economic system is unsustainable. CE provides the economic system with an alternative flow model. Accordingly CE approach emphasizes product, component and material reuse, remanufacturing, refurbishment, repair, cascading and upgrading as well as solar, wind, biomass and waste-derived energy utilization throughout the product value chain and cradle-to-cradle life cycle (Korhonen et al, 2018).
Sustainability and circular economy are mutually complementary and they together create synergy. Using recycled or recyclable materials and the number of organizations trying to develop new ways so as to contribute to circular economy are increasing (Santos et al, 2017). Because sustainable organizations have positive image in public opinion, they are expected to have less cost and more profitable. However, international literature has not clearly proved this relationship. Because there are studies finding that sustainability have positive effect on profitability although there are studies finding that sustainability has negative effect on profitability or there are studies finding no relation between sustainability and profitability. 2. Corporate Sustainability on Turkey
A successful circular economy contributes three aspects of sustainable development which are economic, social and environmental. Figure no 1 shows win-win-win potential of circular economy. (Korhonen et al, 2018).
That sustainable development concept used for macro level societies is realized by a business is called institutional sustainability. Institutional sustainability like sustainable development contains three interrelated basic foundation which are economic, social and environmental (Ebner and Baumgartner, 2006). Sustainability is being tried to dominate business world by carrying out attempts to provide this interaction in Turke
117
Fig. 1. Circular Economy for Sustainable Development
Source: (Korhonen, et al., 2018, p. 40)
One of the most important information resources with regard to Sustainability in Turkey is Business World and Sustainable Development Association (SDA). Business World and Sustainable Development Association founded in 2004 by businesses aiming to spread sustainable development is the only business partner and representative of World Business Council of Sustainable Development (WBCSD) in Turkey. SDA Turkey has four main aims; To introduce the concept of Sustainable Development to business world and public opinion,
To promote archetypal applications with regard to Sustainable Development, to introduce to business world and public opinion,
To contribute to create policies about Sustainable Development
To develop capacity about Sustainable Development with proper tools and channels. SDA Turkey carries out all the work in collaboration with business world, public enterprises, universities, nongovernmental organizations, municipalities and local administrations in order to achieve these aims (TCEA, 2016).
The turning point in measuring sustainability of businesses in Turkey is the measurement of the Sustainability Index in Istanbul stock exchange (BİST) in 2014. Before the measurement of this index, big sized enterprises used to register their sustainability reports to Global Reporting Initiative (GRI) and recorded them. Institutionalized businesses still publish sustainability reports according to both GRI, globally the most accepted, and BIST Sustainability Index.
Capital market indexes which are the most significant indicator of institutional sustainability started to be calculated with XUSRD in Turkey as Istanbul stock exchange (BİST) Sustainability Index as 2014. BİST Sustainability Index calculation is carried out by EIRIS (Ethical Investment Research Services Limited), which is a global institution, carrying out environmental, social and administrative investigations and independent analysis. EIRIS makes its calculation according to international sustainability criteria and uses only the
118
“publicly available” information of the businesses. For this index, in the year 2014 the businesses in BİST 30 Index and in the year 2015 the businesses in BİST 50 Index were included in the evaluation. As of 2016, in addition to the businesses in BİST 50 Index, the volunteered businesses from BIST 100 Index were included (BİST, 2017). Currently 44 businesses are dealt in Sustainability Index.
According to a report released in 2016, the rate of reporting of nonfinancial data in Turkey is 25, 5 %. 38 % of the businesses releasing report give the data in operating report. In addition to this, nearly 43% of the businesses release Sustainability Report. The report release date of nearly 65% of the businesses releasing report is 2009 and after 2009. Accordingly, it could be said that the consciousness about releasing nonfinancial data and sustainability reports in Turkey has been formed within the last years (TCEA, 2016).
By year 2015, 7.547 establishments released 24.405 sustainability report between 1999 and 2015 and 18.743 of these reports are GRI reports (GRI, 2015). In Turkey 72 establishments released 181 reports between 2005 and 2014. 130 of these reports used GRI reporting guide as base. As it is clearly understood from these figures, the numbers of sustainability reports have been increasing and the concept of sustainability has been taken in consideration by more establishments.
The followings could be argued as the reasons for preference GRI as the sustainability report kind; being a guide for both multinational establishments and small and medium sized enterprises, translated into different languages, accepted by stakeholders like state and investors, prepared by taking into consideration the other reporting environments and easy to use (Önce et al., 2015).
3. Corporate Sustainability and Financial Performance Theory
As an extension of finance report, sustainability reports reflect the economic performance of the business as well as its environmental and social performance. With the increase of social responsibility consciousness, businesses are more interested in sustainability reports that report the social responsibility performance of them. Accordingly, reporting both financial and social performances of businesses is on the increase. Businesses often put these two reports together in one activity report (Başar, 2014).
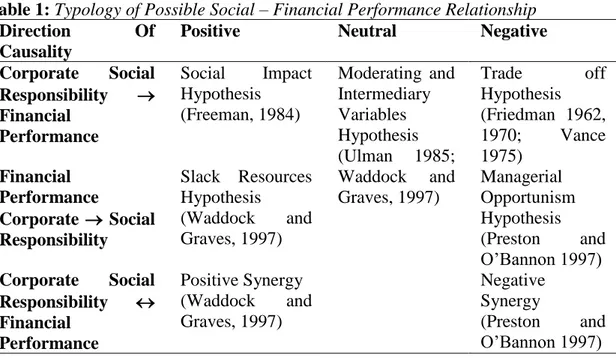
There is a discussion about two different issues as to the relationship between social and financial performances of businesses. One of them is the direction of the relation, according to this, social and financial performance may have positive, negative or neutral relation with one another. The other is about the relation between social and financial performances. The question is whether social performance affects financial performance or financial performance affects social performance or synergistic relationship occurs. Table no 1 shows these relations and related theories about these relations (Preston and O'Bannon, 1997).
119
Table 1: Typology of Possible Social – Financial Performance Relationship
Direction Of
Causality
Positive Neutral Negative
Corporate Social Responsibility Financial Performance Social Impact Hypothesis (Freeman, 1984) Moderating and Intermediary Variables Hypothesis (Ulman 1985; Waddock and Graves, 1997) Trade off Hypothesis (Friedman 1962, 1970; Vance 1975) Financial Performance Corporate Social Responsibility Slack Resources Hypothesis (Waddock and Graves, 1997) Managerial Opportunism Hypothesis (Preston and O’Bannon 1997) Corporate Social Responsibility Financial Performance Positive Synergy (Waddock and Graves, 1997) Negative Synergy (Preston and O’Bannon 1997) Source: (Hirigoyen and Poulain-Rehm, 2015, p. 26)
Researches thinking that social performances of businesses affect financial performances argue that socially responsible businesses are more profitable. Because socially responsible businesses will have more dignity and having more dignity will increase their financial performance. Another view claims the opposite of this idea, that is, financial performances of businesses affect social performance. Accordingly, researchers claim that only when the businesses are financially better they can built social responsibility. They, therefore, financial performance come before social performance (Liangrong, 2009). Finally, some researchers claim that social performance affects financial performance and similarly, financial performance affects social performance.
The fact that social performance affects financial performance in businesses is called social effect hypothesis and this hypothesis is based on stakeholder theory (Freeman, 1984; Donaldson and Preston, 1995). According to this theory, meeting the demands and expectations of many different shareholders (employees, customers, suppliers, environment, society etc.) helps to develop financial performance of businesses. Because high satisfaction of shareholders will increase the dignity of business. This situation has a positive effect on the financial performance of the business (Hirigoyen and Poulain, 2015).
The fact that social performance negatively affects financial performance in businesses is called Trade Off Hypothesis. That social responsibility investments cause additional costs for businesses is shown as the reason why social performance negatively affects financial performance (Garcia-Castro, 2016).
In the literature that claims financial performance of business affects social performance, this situation is explained with two different theories called Slack Resource Theory (Available Funding Hypothesis) and Good Management Theory (Opportunism Hypothesis, Managerial Opportunism Hypothesis). The Available Fund Hypothesis supposes that low risk businesses can better dealt with the social responsibility activities than other businesses. Because low risk businesses can invest in social activities due to their certain stable model.
Managerial Opportunism Hypothesis claims that executives will try to maintain their advantage despite shareholders and other stakeholders. According to this theory, when the financial performance is good, executives decrease social expenditures in order to increase
120
their short term incomes. When the financial performance of business decreases, they try to compensate their disappointing results by getting involved in ostentatious social activities (Hirigoyen and Poulain-Rehm, 2015).
Simultaneous and interactive positive relationship between CSP and FP is called Positive Synergy Hypothesis. According to Waddock ve Graves (1997), this relationship between CSP and FP forms “virtuous circle” for businesses (Simpson and Kohers, 2002). A high social performance can lead to a better financial performance (social impact hypothesis) and this situation can lead to a better social performance (Slack Resources Hypothesis) (Allouche and Laroche, 2005). In the contrary case, that is, simultaneous and interactive negative relationship between social responsibility and financial performance forms “vicious circle” for businesses. Negative Synergy Hypothesis claims that a high level institutional social responsibility causes a weak financial performance (Hirigoyen and Poulain-Rehm, 2015). Finally, Moderating and Intermediary Variables Hypothesis claims that there is not either a positive or a negative relationship between social and financial performance. According to this hypothesis, there are many intervening variables between social and financial performance and a relationship between these two concepts should not be expected (Waddock 1997).
4. Literature on Corporate Sustainability and Financial Performance
As it was mentioned in the theoretical section, it is clearly seen that many different studies examining the relationship between institutional sustainability (Social Performance) and business profitability (Financial Performance) found very different results. In this section, the studies having measured the sustainability according to the GRI Sustainability Report and having used the ROA variable in measuring profitability relation will be examined.
One of the first studies to measure profitability through ROA variable while examining institutional social responsibility and profitability relation is the one carried out by Aupperle vd. (1984). In this study, it was determined that there is no relationship between sustainability and profitability.
Buys et al. (2011) examined whether there was a difference between the financial performances of the businesses that released and did not released sustainability report. The importance of the study results from the examination of the sustainability and financial performance relationship in a developing economy for the first time. For this reason, two groups were formed from the public companies from 2002 to 2009in South Africa, one released sustainability reports according to GRI and the other one did not released sustainability reports. The financial performances of these groups were measured with ROA and ROE. At the end of the study, although it was shown that the businesses releasing sustainability reports could produce better financial performances, it could not been determined a certain positive relation between statistical analysis sustainability report and economic performance.
Burhan N. and Rahmanti (2012), analyzed the data belonging to 32 businesses in Indonesia stock market in 2006-2009 period. Sustainability Reporting Guidelines from Global Reporting Initiative (GRI) was used in measuring sustainability. Two different models were used in the study in which business performance was measured with ROA variable. As in this study, while the sustainability of the businesses were evaluated as a general score in the first model, in the second model sustainability was calculated as economic sustainability, environmental sustainability and social sustainability all which are the subtitles of sustainability. While single linear regression analysis was used in the first model, multiple regression analysis method was used in the second model. At the end of the study, a statistically significant and positive relationship was found only between social sustainability
121
and business performance.
Aggarwall (2013) has been used Five Accounting-based measures, namely, Return on Assets (ROA), Return on Equity (ROE), Return on Capital Employed (ROCE), Profit before Tax (PBT), and a growth variable - Growth in Total Assets (GTA ) as proxies for financial performance. Sustainability was measured with reports prepared according to GRI guide of the businesses. Overall Sustainability Rating (OSR), Community Performance Rating (COM), Employees Performance Rating (EMP), Environmental Performance Rating (ENV) and Governance Performance Rating (GOV) have been used as proxies for sustainability performance of company. As a result of the regression analysis done in the study, it was determined that institutional sustainability did not have a significant effect on financial performance. In addition, while sustainability positively affect some financial measurements (ROA, PBT and GTA), it negatively affect the others (ROE and ROCE). In the study, it was determined that sustainability did not have a significant relationship with firm performance and it did not have an important effect in short term.
Rodriguez-Fernandez (2016) carried out a two way examination of the relationship between institutional social responsibility and financial performance of the businesses registered to Madrid Stock Exchange. Two different model were used in the study in which 121 businesses were sample. In the study, in which institutional social responsibility were measured with 4 different variables, one of the variables was sustainability report score according to GRI. Financial performance was measured with ROA, ROE and Tobin Q variables. While the effect of financial performance on social performance was examined in the first model, effect of social performance on financial performance was examined in the second model. Positive significant relationships on both ways were determined from the analysis result. As a result, it was determined that social businesses are more profitable and profitable businesses are more social.
There are few studies in Turkey examining the effect of sustainability on financial performance. Since there is not enough data for measuring sustainability. That calculation of sustainability index is new and that there are very few businesses in the index and that there are few businesses releasing sustainability reports before this index have caused in sufficient studies.
Soytaş vd. (2017) examined the effect of sustainability of 214 businesses in Turkey on financial performance. In the study, financial performance was measured with Return On Assets (ROA), Return On Equity (ROE) and Tobin Q rate. In the model, whether or not the businesses take part in CSR Hub database or BIST (İstanbul Stock market) Sustainability Index was evaluated as independent variable. Furthermore, the size of business, having foreign partner and sector variable were added as control variable. In the study, the effect of sustainability on financial performance was estimated with Regression Analysis by using Ordinary Least Squares (OLS) method. It was determined from the analyses that sustainability had a positive effect on financial performance. Fettahoğlu (2016) investigated the relationship between financial performance and social responsibility performance of 16 businesses releasing sustainability report between the years 2009 and 2011 in İstanbul Stock Market. In the study, the financial performance of dependent variable business with ROE, ROA, Leverage, asset turnover, earnings per share and stock return. The social responsibility performance which was the independent variable in the model was evaluated under 4 titles which were relationships with employees, relationships with the environment, relationships with society and products liability. At the end of the analysis carried out by using Multiple Regression Analysis, it was found out that there was statistically significant and negative way relationship between leverage ratio and social responsibility components. Moreover, it was found out that there was statistically significant relationship between asset turnovers and social responsibility components, however, there was not a significant relationship with regard to the other variables.
122
Başar (2014) examined the reporting levels of businesses taking place in BİST Chemistry, Petrol and Plastic Index in 2010-2012 according to the responsibility criteria determined by GRI Global Reporting Initiative). He also analyzed the effect of the social performance of the business on financial performance. In the study, 6 dimension sustainability performances taking place in GRI sustainability reports which are Economic, Environment, Workforce applications, Human rights, Society and products liability were determined. The financial performance of the business was measured with earning per share. Correlation analysis was carried out in order to determine the direction and power of the relationship between social responsibility activities and financial performance. Inverse relationship was found between social responsibility explanations and earning per share.
As it is clearly seen, in the restricted studies carried out in Turkey like the ones in the world, different results were found between sustainability and profitability. While positive relationships were found in some studies, negative relationships were found in others.
5. Data and Methodology
This study aimed to test whether institutional sustainability affected profitability of the businesses traded in BİST and releasing sustainability reports according to Global Reporting Initiative (GRI). Total 33 businesses releasing sustainability reports according to GRI in 2015 were taken as a sample.
In the study, the profitability of the businesses were measured with ROA variable and their institutional sustainability were measured with the sustainability reports they formed according to GRI. The first model was created by evaluating sustainability general scores. In the second model, sustainability was measured with employees, environment, governance and society subtitles. Business size and leverage ratio were used as control variables in the study. The relationship between institutional sustainability and financial performance will be analyzed by means of Eviews 9.1 program. Multiple Regression Analysis will be used as analysis method. The study carried out by Aggarwal (2013) was taken as a base. 2 different model used in the mentioned study was determined by reviewing it for Turkey (Aggarwal, 2013).
𝑅𝑂𝐴 = 𝛽0+ 𝛽1𝑂𝑆𝑅 + 𝛽2𝑆𝐼𝑍𝐸 + 𝛽3𝐿𝐸𝑉 + 𝜀 (1)
𝑅𝑂𝐴 = 𝛽0+ 𝛽1𝐸𝑀𝑃 + 𝛽2𝐸𝑁𝑉 + 𝛽3𝐺𝑂𝑉 + 𝛽4𝐶𝑂𝑀 + 𝛽5𝑆𝐼𝑍𝐸 + 𝛽6𝐿𝐸𝑉 + 𝜀 (2)
Where,
ROA, Return on Assets, have been used as proxies for financial performance. OSR, Overall Sustainability Rating,
COM, Community Performance Rating, EMP, Employees Performance Rating,
ENV, Environmental Performance Rating and
GOV, Governance Performance Rating (GOV) have been used as proxies for sustainability performance of company.
SIZE, Firm size and
LEV, Leverage ratio control variables.
The financial data has been obtained from company’s website, audited financial statements and annual reports. Corporate Sustainability (overall rating GR4), governance (from G4-34 to G4-55),
123
community (from G4-SO1 to G4SO11), employee (from G4-LA1 to G4-LA16) and environment (from G4-EN1 to G4-EN34) ratings data have been obtained from in firm GRI Sustainability Report (Global Reporting Initiative, tarih yok, pp. 21-23). Further, the model size variable (SIZE) and leverage ratio (LEV) variable are used as the control variables. we use natural log of total assets as proxy for firm size.
After the validity of the hypothesis used for Multiple Regression Models is investigated, coefficients will be estimated. Because if the hypothesis are violated, the estimated coefficients will not be coherent and significant. Multiple Linear Regression hypothesis can be listed as normal distribution, absence of heteroscedasticity problem, multicollinearity and lack of autocorrelation. 6. Result and Discussions
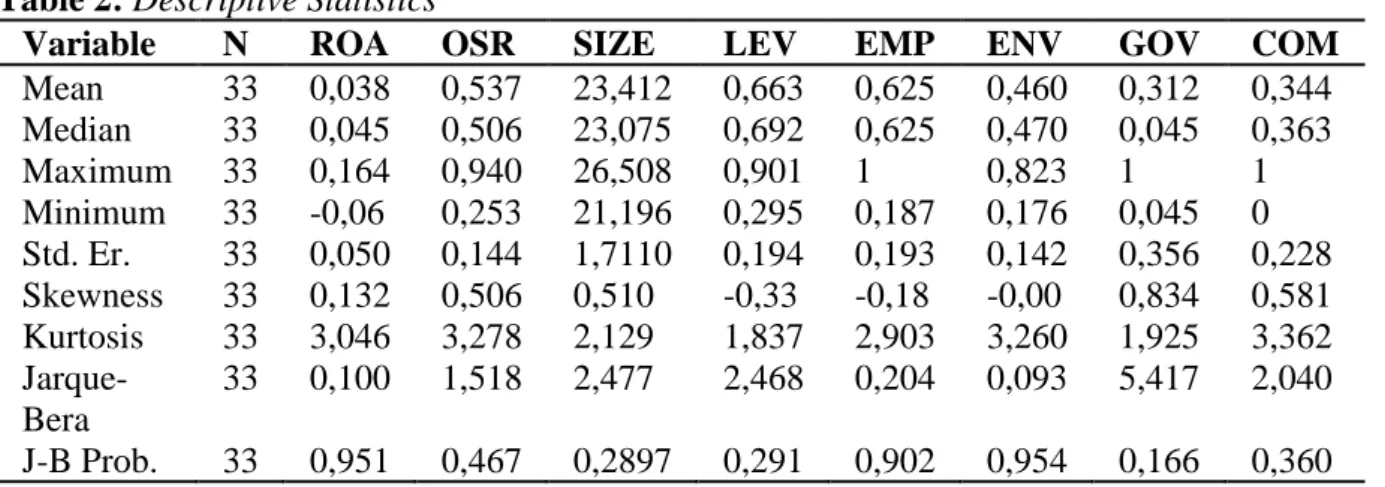
Descriptive statistics and test of normality results of dependent variable ROA and independent variables OSR, EMP, ENV, GOV, COM, SIZE and LEV in equation 1 and equation 2 are shown at table no. 1 and table no. 2. There are mean, highest, lowest and standard error values of all variables at table no 2. Moreover, there are data as to whether the variables in the same model fit to normal distribution at this table. Jarque – Bera test analyses whether data fit to normal distribution. One of the main assumptions of regression analysis is that the normal distribution is not significant at 10% of the probability value of the J-B statistic provided for all the variables in the data set.
Table 2: Descriptive Statistics
Variable N ROA OSR SIZE LEV EMP ENV GOV COM
Mean 33 0,038 0,537 23,412 0,663 0,625 0,460 0,312 0,344 Median 33 0,045 0,506 23,075 0,692 0,625 0,470 0,045 0,363 Maximum 33 0,164 0,940 26,508 0,901 1 0,823 1 1 Minimum 33 -0,06 0,253 21,196 0,295 0,187 0,176 0,045 0 Std. Er. 33 0,050 0,144 1,7110 0,194 0,193 0,142 0,356 0,228 Skewness 33 0,132 0,506 0,510 -0,33 -0,18 -0,00 0,834 0,581 Kurtosis 33 3,046 3,278 2,129 1,837 2,903 3,260 1,925 3,362 Jarque-Bera 33 0,100 1,518 2,477 2,468 0,204 0,093 5,417 2,040 J-B Prob. 33 0,951 0,467 0,2897 0,291 0,902 0,954 0,166 0,360
Another of the assumptions of Regression Analysis is that there is no multiple linear connection problem. The problem of multiple linear connections may indicate that R2 is high and very few of the independent variables are insignificant. Variance Inflation Factor (VIF) can be used to check whether there is a Multiple Linear Link Problem. In table no 3, the value of the Centered VIF between 1 and 5 is regarded as an indication that there is no multi-linear connection problem (Nishishiba et al., 2013).
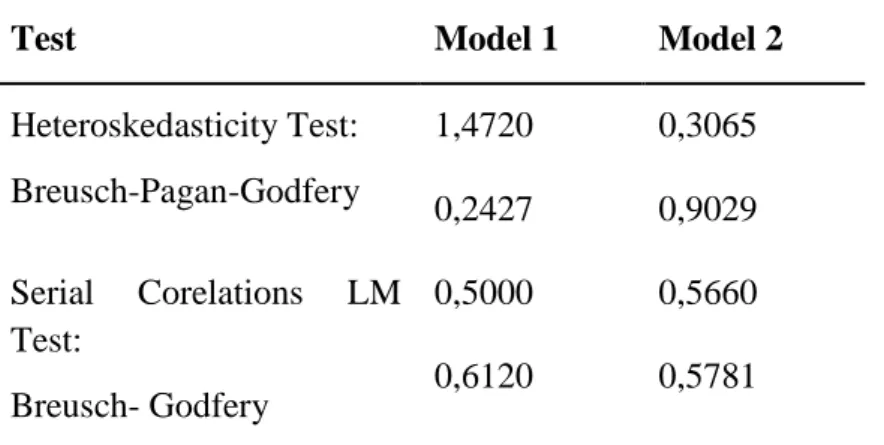
Whether the multiple linear regression models shown in Equation 1 and Equation 2 have serial correlations and heteroscedasticity problems were investigated by using Beusch-Godfrey serial correlation test and Beusch-Pagan-Godfrey Heteroscedasticity.
124
Table 3 : Variance Inflation Factor Results
Model 1 Model2 Variables Uncentered VIF Centered VIF Uncentered VIF Centered VIF OSR 19,8214 1,2983 SIZE 288,35 1,4856 368,20 1,1016 LEV GOV 2,8928 1,8827 ENV 14,607 1,6042 EMP 28,151 2,3823 COM 4,9756 1,9219 C 221,34 NA 355,43 NA
For models established in equation 1 and equation 2, since the probability Chi-Square values are higher than the significance level 5% statistic, it shows that there is no serial correlations and heteroscedasticity problem. After the regression models in equation 1 and equation 2 are determined by the tests that provide the stabilization conditions, analysis of the corresponding models can be performed.
Table 4 Test of Heteroscedasticity and Serial Correlations
Test Model 1 Model 2
Heteroskedasticity Test: Breusch-Pagan-Godfery 1,4720 0,3065 0,2427 0,9029 Serial Corelations LM Test: Breusch- Godfery 0,5000 0,5660 0,6120 0,5781
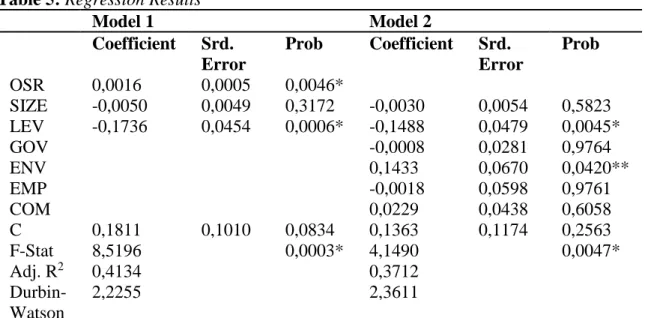
The ordinary least square method is used in the analyses. The probability values of the F statistics of Model 1(equation1) and Model 2 (equation 2) show statistically significant in both models in general. The R2 values of Model 1 and Model 2 indicate how much variation can be explained by independent variables in a change that can occur in the dependent variable. In the first model, 41% of the variance of the independent variables can be explained by the dependent variable and the independent variables in the second model can explain the variation of the dependent variable by 37%. These rates represent a sufficient ratio for social sciences.
In Model 1, the LEV variance of the control variables SIZE and LEV and the OSR variance indicate the presence of a statistically significant relationship. An increase in the OSR variable affects the ROA variable in the positive direction while an increase in the LEV variable affects the ROA variable in the negative direction. A change in one unit in the OSR variable is 0.0016 in the same direction, and a unit change in the LEV variable affects the ROA variable in the opposite direction 0.1736 units.
125
Table 5: Regression Results
Model 1 Model 2 Coefficient Srd. Error Prob Coefficient Srd. Error Prob OSR 0,0016 0,0005 0,0046* SIZE -0,0050 0,0049 0,3172 -0,0030 0,0054 0,5823 LEV -0,1736 0,0454 0,0006* -0,1488 0,0479 0,0045* GOV -0,0008 0,0281 0,9764 ENV 0,1433 0,0670 0,0420** EMP -0,0018 0,0598 0,9761 COM 0,0229 0,0438 0,6058 C 0,1811 0,1010 0,0834 0,1363 0,1174 0,2563 F-Stat 8,5196 0,0003* 4,1490 0,0047* Adj. R2 0,4134 0,3712 Durbin-Watson 2,2255 2,3611
Note: *statistical significance level of 1%, **statistical significance level of 5%
From the variables in Model 2, only the LEV variable and the ENV variables have a statistically significant relationship on the ROA variance. A unit change in the LEV variable will again affect the ROA variable in the opposite direction. A unit change in the ENV variable affects the ROA variable by 0.067 units in the same direction. The effect of the LEV variables in Model 1 and Model 2 on the ROA variable is very close to each other. When the effect of the OSR and ENV variables on the ROA variable is compared, the effect of the ENV variables on the ROA variable is about 42 times higher than that of the OSR variable.
7. Conclusions
This study aims to investigate the corporate sustainability which is a reflection of macroeconomic cyclic economy concept in business, its effect on business profitability, by using BIST example with multiple linear regression analysis.
In the study, firstly, the relationship between the general scores of sustainability and profitability is examined. Subsequently, sustainability was examined in terms of employee, environment, government and community sub-headings of sustainability, and it was examined which sub-head is more effective in the impact of sustainability on the profitability of enterprises.
As a result of analysis, the impact of overall sustainability scores of businesses in Turkey on profitability was found to be statistically significant and positive. These results shows that Social Impact Hypothesis that assumes social performance affects positively financial performance and that is based on Stakeholder theory is valid in the businesses located in Turkey. According to this hypothesis, the adoption of sustainability applications by businesses in Turkey increases institutional dignity of business and therefore decreases the cost of businesses and increases their profitability.
In the second model, which identifies which subcategory leads to sustainability, the only statistically significant variable was the environment variable. Thus the subtitle of sustainability influencing the profitability of enterprises in Turkey was found to be environmental factors. Finally, it was determined that employee sustainability, government and community variables, which are the subtitles used in the measurement of sustainability, did not have statistically significant effect on the profitability of the businesses in Turkey.
126
References
Aggarwal, P., (2013). “Impact of sustainability performance of company on its financial performance: a study of listed Indian companies”. Global Journal of Management and Business Research Finance, 13(11), pp. 60-70.
Allouche, J. & Laroche, P., 2005. “A Meta-analytical investigation of the relationship between corporate social and financial performance”. Revue de Gestion des Ressources Humaines, 57(1), pp. 18-48.
Aupperle, E. K., Carroll, B. A. & Hatfield, D. J., (1984). “An empirical examination of the relationship between corporate social responsibility and profitability”. Research In Corporate Social Performance And Policy, 6(1), pp. 27-54.
Başar, B., (2014). “Kurumsal sosyal sorumluluk raporlaması ve finansal performans arasındaki ilişki: Borsa İstanbul’da işlem gören kimya-petrol-plastik sektörü şirketleri üzerine bir araştırma”. Yönetim ve Ekonomi Dergisi, 21(2), pp. 59-72.
Buys, P., Oberholzer, M. & Andrikopoulos, P., (2011). “An investigation of the economic performance of sustainability reporting companies versus non-reporting companies: A South African Perspective”. Journal of Social Sciences, 29(2), pp. 151-158.
Ebner, D. & Baumgartner, R. J., (2006). The Relation between sustainable development and corporate social responsibility. paper presented at the Corporate Responsibility Research Conference, Trinity College, Dublin, www.crrconference.org [17 September 2007]. pp. 1-17.
Fettahoğlu, S., (2013). “İşletmelerde sosyal sorumluluk ile finansal performans arasındaki ilişki: İMKB’ye yönelik bir uygulama”. Sosyal ve Beşeri Bilimler Dergisi, 5(2), pp. 515-524. García-Castro, R., (2012). A Configurational approach to corporate social responsibility-financial
performance empirical research. In: A. Lindgreen, P. Kotler, F. Maon and J. Vanhamme (eds.). A Stakeholder Approach to Corporate Social Responsibility: Pressures, Conflicts, Reconciliation. Farnham: Gower Publishing Ltd., 2012. pp 1 - 1
GRI. (2015). Global Reporting Initiative, G4 Sustainability Reporting Guide. Amsterdam.
Hirigoyen, G. & Poulain-Rehm, T., (2015). “Relationships between corporate social responsibility and financial performance: What is the causality?. Journal of Business And Management”, 4(1), pp. 18-43.
Korhonen, J., Honkasalo, A. & Seppälä, J., (2018). “Circular economy: The Concept and its Limitations”. Ecological Economics, 143(1), pp. 37-46.
Liangrong, Z., (2009). Corporate Social Responsibility, Corporate Restructuring and Firm's Performance. Berlin: Springer.
Burhan, N. Annisa Hayatun & Rahmanti, W., (2012). “The Impact of sustainability reporting on company performance”. Journal of Economics, Business, and Accountancy Ventura, 15(2), pp. 257-272.
Nishishiba, M., Jones, M., & Kraner, M. (2013). Research Methods and Statistics for Public and Nonprofit Administrators: A Practical Guide. USA: Sage Publications.
Önce, S., Onay, A. & Yeşilçeleb, 2015. “Corporate sustainability reporting and situation in Turkey”. Journal of Economics, Finance and Accounting, 2(2), pp. 230-252.
Preston, E. L. & O'Bannon, P. D., (1997). “The Corporate social-financial performance relationship”. Business and Society, 36(4), pp. 419-429.
127
Rizos, V., Tuokko, K. & Behrens, A., (2017). The Circular Economy: A Review of Definitions, Processes and Impacts. CEPS Research Report No 2017/8.
Rodriguez-Fernandez, M., (2016). “Social responsibility and financial performance: the role of good corporate governance”. Q Business Research Quarterly, 19(1), pp. 137-151.
Santos, B., Azevedo Garriedo, S. & Matias, C. J., (2017). The Relation Between Corporate Sustainability and a Circular Economy. Newyork: Nova Publishers.
Simpson, W. G. & Kohers, T., (2002). “The Link between corporate social and financial performance: evidence from the banking industry”. Journal of Business Ethics, 35(2), pp. 97-109.
Soytaş, M. A., Denizel, M., Uşar, D. D. & Ersoy, İ., (2017). “Sürdürülebilirlik yatırımlarının finansal performansa etkisi: Türkiye örneği”. Yönetim ve Ekonomi Araştırmaları Dergisi, 15(2), pp. 140-162.
TCEA, (2016). Türkiye İşveren Sendikaları Konfederasyonu (TİSK) Herkes İçin Kurumsal Sosyal Sorumluluk Projesi Türkiye Sürdürülebilirlik Raporlaması Ulusal İnceleme Raporu, Ankara: TİSK Proje Ofisi.
Vildasen, S. S., Keitsch, M. & Fet, M. A., (2017). “Clarifying the epistemology of corporate sustainability”. Ecological Economics, 138(1), pp. 40-46.
Waddock, S. A. & Grave, S. B., (1997). “The Corporate social performance financial performance link”. Strategic Management Journal, 18(4), pp. 303-319.