Investigation on the formation of Cu–Fe nano crystalline super-saturated solid
solution developed by mechanical alloying
M. Mojtahedi
a,⇑, M. Goodarzi
a, M.R. Aboutalebi
a, M. Ghaffari
b, V. Soleimanian
ca
School of Materials Science and Engineering, Iran University of Science and Technology, Narmak, Tehran 16846-13114, Iran
b
Department of Electrical and Electronics Engineering, UNAM-Institute of Materials Science and Nanotechnology, Bilkent University, Ankara 06800, Turkey
c
Department of Physics, Faculty of Science, Shahrekord University, P.O. Box 115, Shahrekord, Iran
a r t i c l e
i n f o
Article history:
Received 7 September 2012
Received in revised form 19 October 2012 Accepted 22 October 2012
Available online 1 November 2012 Keywords:
Mechanical alloying Solid solubility extension XDA
Rietveld refinement HRTEM
HAADF
a b s t r a c t
In this study, the formation of super saturated solid solution in the binary Cu–Fe system was investigated. Three powder blends with 30, 50 and 70 wt.% of Fe were milled for different times to 96 h. The variations of lattice parameter and inter-planar spacing were calculated and analyzed using X-ray diffraction anal-ysis (XDA). The anisotropy of lattice deformation in the FCC phase was studied and the obtained results were compared to milled pure Cu powder. Furthermore, crystallite size was calculated using Scherer for-mula in comparison with Rietveld full profile refinement method. Considering the previous studies about the formation of non-equilibrium FCC and BCC phases, the phase evolution has been discussed and the proportion of each phase was calculated using Rietveld refinement method. Supplementary studies on the evolution of microstructure and formation of solid solution were carried out using high resolution transmission electron microscopy (HRTEM). Finally, high angle annular dark field (HAADF) imaging was utilized to find out the level of homogeneity in the resulting phases. While true alloying takes place in each phase, the final structure consists of both FCC and BCC nano-crystallites.
Ó 2012 Elsevier B.V. All rights reserved.
1. Introduction
Mechanical alloying has been an attractive method for synthesis of super-saturated metallic solutions. Copper base alloys have been the subject of numerous studies in this field. Several important engineering metals have limited solubility in copper, such as Fe, Cr, Co, Mo, Mg, V and Ti. Production of super-saturated alloys, amor-phous phases or intermetallic compounds in binary systems of Cu with BCC metals like Nb[1–2], Cr[3,4], Li[5], Mo[6,7], V[8]and W[9,10], have been widely investigated using mechanical alloying. There are also studies on binary systems of Cu with FCC metals such as Al[11], HCP metals like Co[12,13]and Zn[14], in addition to non-metallic elements like carbon[15]. Studies on systems with three or more constituents have been conducted as well[16–21].
Relatively more studies have been focused on the Cu–Fe alloying system. Some researches just considered the equiatomic composition [22–26], while others scrutinized wider ranges
[16,27–35]. Moreover, explorations have been done on the copper
rich [36] or the iron rich alloys [37]. The solubility limits can change significantly in the mechanically alloyed systems. The crys-tal structures obtained in various compositions by former researchers are summarized inFig. 1.
To the best of the author’s knowledge, the majority of research on the formation of this non-equilibrium solution utilized X-ray diffraction method, but the analysis of XRD patterns are conducted using different methods which can cause a difference in the final results. Not many used just XRD[26,40], but more preferred to make use of Mossbauer spectroscopy beside XRD to study the homogeneity and atomic level mixing of elements[16,25,41–43]. Transmission electron microscopy is also a powerful technique for inspection of microstructural transformation which has been used alongside XRD for this system[28,32,33,37]. Furthermore, neutron diffraction analysis was also used to study the mechani-cally alloyed Cu–Fe admixtures[42,44].
In spite of the extensive scientific study, there are different viewpoints in the literature about whether a single phase solid solution with anatomically homogeneous structure is obtained or not. Therefore, the aim of this work is to study the micro-structural changes and phase formation in the Cu–Fe system with the aid of satisfactory XRD analysis methods and high resolution TEM in addition to high angle annular dark field scanning tunneling elec-tron microscopy (HAADF STEM) to obtain reassuring proof about the XDA results.
2. Materials and methods
The elemental Cu and Fe powders were mixed before milling to achieve equiatomic, Cu rich and Fe rich compositions. The milling is conducted under argon atmosphere using a planetary ball mill with ball to powder ratio of 20:1 and 0925-8388/$ - see front matter Ó 2012 Elsevier B.V. All rights reserved.
http://dx.doi.org/10.1016/j.jallcom.2012.10.112
⇑Corresponding author. Tel.: +98 21 77240500; fax: +98 21 77240599. E-mail address:[email protected](M. Mojtahedi).
Journal of Alloys and Compounds 550 (2013) 380–388
Contents lists available atSciVerse ScienceDirect
Journal of Alloys and Compounds
j o u r n a l h o m e p a g e : w w w . e l s e v i e r . c o m / l o c a t e / j a l c o mrotation speed of 370 rpm. After each 45 min of milling, the operation was stopped for 15 min to avoid rising temperature. One weight percentage of Stearic acid was used as lubricant to prevent too much adhesion of the milled powder to the vial and balls. The applied compositions and milling times are shown in (Table 1).
The resultant powders were analyzed using XRD technique. The level of back-ground is relatively high when specimens containing iron are exposed to copper Karadiation; therefore, an instrument with Cobalt Karadiation (1.78901 Å) is used
(PHILIPS-Xpert) to provide a better separation of the shape of short peaks from the background data. The 2h step was set at 0.02° and the counting time per step was 4 s. The instrumental broadening was calculated using Caglioti equation[45]:
FWHM2¼ U tan2ðhÞ þ V tanðhÞ þ W ð1Þ
In which h is diffraction angle, FWHM is full width at half maximum of any peak and U, V and W are indices which are determined using a standard specimen with large grains and no internal strain. Therefore, a pure alumina sample was prepared as standard specimen in this work.
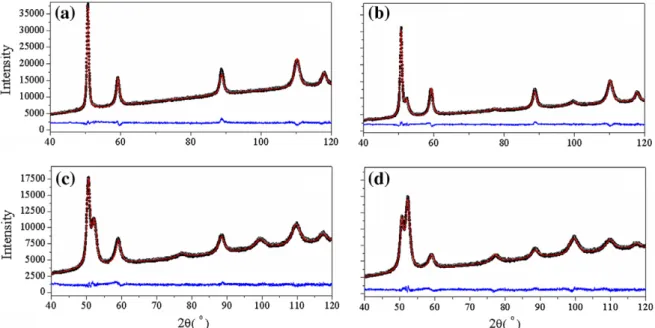
The X-ray profiles were studied using Scherer equation[46]in addition to Riet-veld full profile analysis method[47]to determine crystallographic characteristics of the milled powder. After fitting the Caglioti equation and calculation of instru-mental broadening for diffraction angels of the Cu–Fe powder, the true broadening data for the Scherer equation was extracted by the subtraction of the square of two broadenings[48]. The relative amount of the FCC and BCC phases in each sample was determined by comparing related peaks using Rietveld method and Fullprof software.Fig. 2shows the profiles obtained from experiment and the profiles
calculated using Rietveld refinement, for samples 0-48, 3-6, 5-12 and 7-12. As is seen, a fairly good agreement between the experimental and calculated profiles can be observed.
High resolution TEM imaging was conducted to investigate the formation of milled structure at the scale of nano crystallites, using a Tecnai G2 F30 instrument with 300 kV. The powder was dispersed in acetone by ultrasonic vibration for 2 min. Then two drops were instilled on a TEM carbon grid. HAADF technique was also performed in order to evaluate the homogeneity of the alloying elements in the resultant powders.
3. Results and discussion 3.1. X-ray diffraction analysis (XDA) 3.1.1. Phase evolution
X-ray profiles of the powder mixture samples with 70 wt.% Fe which are mechanically alloyed for different times are compared inFig. 3. As can be seen, by increment of the milling time, the Cu and Fe peaks shift to lower angles, which is an indication of an increase in the distance between lattice planes. The intensities of all peaks are reduced as a result of more milling time, up to 48 h. After 48 h of mechanical alloying, it seems that the peaks of the
Fig. 1. Illustration of the non-equilibrium ranges of FCC and BCC lattice structures in experienced compositions by some previous researches on the Cu–Fe system, prepared by mechanical alloying. (see above mentioned references for further information.)
Table 1
Different milling conditions beside lattice parameter and Crystallite size (Rietveld method) towards the directions of X-ray diffraction from FCC and BCC structures. Sample code Composition Milling time (h) FCC Lattice parameter (ÅA 0 ) Average FCC crystallite size (nm)
FCC crystallite size (ÅA0) BCC lattice parameter (ÅA 0 ) Average BCC crystallite size (nm) BCC crystallite size (ÅA0) Cu (wt.%) Fe (wt.%) 1 1 1 2 0 0 2 2 0 3 1 1 2 2 2 1 1 0 2 0 0 2 1 1 0-48 100 0 48 3.6181 10.74 135 76 95 96 135 – – – – – 3-6 70 30 6 3.6200 11.74 142 90 105 108 142 2.8693 6.13 61 58 65 3-12 70 30 12 3.6266 10.64 129 82 94 98 129 2.8714 8.47 75 86 93 3-24 70 30 24 3.6338 9.34 116 69 81 85 116 2.8743 4.23 49 40 38 3-48 70 30 48 3.6468 7.78 102 55 61 69 102 – – – – – 3-96 70 30 96 3.6466 6.26 79 47 51 57 79 – – – – – 5-6 50 50 6 3.6211 9.08 112 64 97 69 112 2.8703 4.8 65 35 44 5-12 50 50 12 3.6290 6.74 83 48 63 60 83 2.8724 4.67 60 34 46 5-24 50 50 24 3.6572 5.28 69 38 42 47 68 2.8759 4.93 47 36 65 5-48 50 50 48 3.6667 5 67 33 40 43 67 – – – – – 5-96 50 50 96 3.6609 5.26 69 38 41 46 69 – – – – – 7-6 30 70 6 3.6286 7.38 91 52 69 66 91 2.8709 5.83 78 44 53 7-12 30 70 12 3.6318 4.22 70 39 41 39 69 2.8719 6.53 68 57 71 7-24 30 70 24 3.6738 3.6 56 20 23 25 56 2.8746 2.03 22 25 14 7-48 30 70 48 3.6792 5.16 48 56 51 53 50 – – – – – 7-96 30 70 96 3.6645 4.38 61 29 29 39 61 – – – – –
BCC phase disappear and a completely FCC solid solution is formed. However, the asymmetric shape of the right tail of the Cu(1 1 1) peak points out an overlap with the Fe(1 1 0) peak. If the time of exposing the sample to X-ray radiation is not sufficient or the noise and background are high, the small peaks may be indistinguish-able, while the diffraction peak of Fe(1 1 0) is distinguishable as a shoulder to the Cu(1 1 1) peak, in all of the XRD profiles. By further milling up to 96 h, the intensity of the Fe(1 1 0) peak continues the trend of reduction while the FCC peaks show a slight amplification. Extension of solubility limit to more than 50% by mechanical alloying, have been seen in few metallic binary systems. 60% of Al in Ti[49]and 86% of Al in W[50]can be addressed as examples. The Fe–Cu system is somehow an unique case. The difference in
atomic radius is just 1.5% and the electro-negativities are close together (1.9 for Cu and 1.8 for Fe) but the equilibrium solubility is near zero at room temperature. On the other hand, mechanical alloying is the only non-equilibrium technique that can extend the solubility limit of Fe in Cu to more than equiatomic composi-tion. By comparing the free energy curves of FCC and BCC phase in the Cu–Fe system, it is claimed that addition of enthalpy of defects to the free energy curves, shift the crossing of FCC and BCC plots towards Fe reach concentrations[43]. However, our re-sults show that the solubility limit of Fe in Cu is lower than the amounts illustrated inFig. 1, which are all more than 50%. It is in agreement with another work which is reported the remaining of Fe peaks in a powder with 40% Fe content, using high intensity XRD peaks[51].
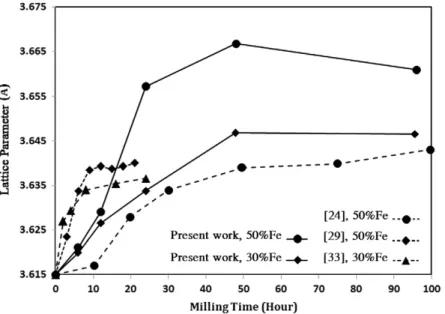
As can be seen inTable 1andFig. 4, by an increase in the Fe con-tent of the samples an extra increment in lattice parameter is obtained. It should be noticed that the rate of increment of lattice parameter before reaching the steady state level, can be different in publications. This is related to the milling parameters and energy transfer in the vial.
The difference between the amounts of increment of the lattice parameter in the sample of pure copper milled for 48 h (0-48) com-pared with samples 3-48, 5-48 and 7-48, is significant. The higher order of changes proves the entrance of alloying element in the lat-tice of the FCC phase. This trend is in agreement with previous studies[29–30,33], while the amount of increase in the present conditions of mechanical alloying is greater. In the specimens with 70 wt.% iron, by increasing the milling time the FCC phase is still dominant and the peaks show a relatively severe displacement.
The changes in the lattice parameter of the FCC phase do not show an uniform behavior in different series of specimens. As illus-trated inFig. 5, in series 5 and 7 there is a major increase in lattice parameter between 12 and 24 h of milling. This predicates that alloying mainly takes place in this period of time. But in series 3, the changes are more uniform while the increase in lattice constant between 6 and 12 h is slightly higher, which can confirm that more Fe content postpones the trend of the alloying process.
In case of mechanical alloying of ductile metallic powders, it is not unusual to see a slight decrease in the lattice strain, after the sharp initial increase. The smaller the crystallite size, the genera-tion of new dislocagenera-tions is harder[52]. When the crystallite size
Fig. 3. The effect of milling time on XRD pattern of samples with 70% Fe.
Fig. 2. The experimental and calculated XRD patterns for the Cu–Fe samples (a) 0-48 (b) 3-6 (c) 5-12 and (d) 7-12. The difference between two patterns can be seen under each profile.
and dislocation density reach a saturation value, the existing dislo-cations rearrange and some may be annihilated. Therefore the lat-tice strain decreases, the XRD peaks become sharper and the peak position may change in reverse order. This trend can be seen in samples with 50% Fe content. But in case of 70% Fe, we see a rela-tively severe change in the sharpness of FCC peaks. The shape of the XRD profile of the sample 7-48, implies that an amorphous phase may be formed. Therefore, the change of profile shape in the 48–96 h interval could be due to re-crystallization of amor-phous regions in the powder containing 70% of Fe.
There is some disagreement over complete and atomic level dis-solution in the mechanically alloyed Cu–Fe powder in the litera-ture. According to the XRD peaks of Cu and Fe, it is stated that the output of mechanical alloying is a single FCC or BCC phase in the related compositions[25,27,32,33]. However, there are some difficulties in X-ray diffraction analysis of such powders. The pres-ence of highly deformed crystallites in the size of a few nano meters makes the peaks short and broadened, and sometimes hard to identify. Moreover, by the decrease in the crystallite size, the minimum necessary amount of a phase to be detected by XRD
increases[53]. These should be added to the fact that there can be a very slight difference between a solid solution and a nano structured mixture.
Therefore, previous researchers have implemented other X-ray diffraction analysis methods. By the aid of extended X-ray absorp-tion fine structure (EXAFS) technique, it has been stated that Cu and Fe make an atomic level solution [22]. Although it is men-tioned that this is not a general conclusion, the usage of EXAFS in the analysis of Ag–Fe powder mixture showed that an atomic solu-tion did not form in mechanical alloying of this system[54], which also has a positive heath of mixing. On the other hand, by usage of EXAFS it is reported[34]that in mixtures with more than 60% cop-per, the environment around Fe atoms changes from a BCC to an FCC structure. As a matter of fact, it creates a mixture of FCC phase with high Cu concentration beside another FCC phase with high Fe concentration, rather than an uniform solid solution. The atomic environment around Fe and Cu atoms is also investigated using X-ray absorption near edge structure (XANES) technique [35]. It is expressed that in a powder blend with 40% Fe, the probability of the presence of a homogenous FCC structure is more than a mix-ture of FCC and BCC clusters, while for 60% Fe it is more likely to have a mixture.
Mossbauer spectroscopy is another way that is applied to study the environment around Fe and Cu atoms. It is mentioned in[55]
that true alloying between Cu and Fe can be confirmed by means of Mossbauer spectroscopy, while there are dissimilar reports in some other published papers. The presence of
c
-Fe with an FCC structure that could not be detected via XRD analysis has been reported[42]. It is noted in[24] that the FCC and BCC iron are both present while the resultant solid solution is said to be homogenous.Considering the above-mentioned disagreement, in this work the amount of the FCC and BCC phases is determined using high quality XRD profiles and Rietveld analysis. The results can be seen inFig. 6. It is obvious that the BCC phase does not diminish com-pletely, even after 96 h of milling. Although the starting percentage of the FCC and BCC phases are from a wide region, by increasing milling time the final amounts converge to about 85% of the FCC and 15% of the BCC phases.
To the best of our knowledge, 200 h is the maximum time of milling in this system; the XRD profiles are printed in the literature
[56]. In that time, still the (1 1 0) peak of the BCC phase can be
Fig. 4. The effect of milling time on FCC lattice parameter of Cu + Fe mixture with different Cu contents. (A comparison between the present work and previous studies)
Fig. 5. Variation of the lattice parameter of the FCC phase per hour of milling time.
detected as an asymmetry in the (1 1 1) peak of FCC. Therefore, it was concluded that the super saturated FCC and BCC phases would be homogeneous to an atomic level solution, while the overall powder does not consist of a single homogeneous phase, due to
the residual nano crystallites with BCC structure in all samples. To obtain a mixture of about 85% FCC and 15% BCC phases as the semi-equilibrium state in the whole mentioned range of composi-tions, it will be necessary to have variable solubility limits of Fe and Cu. To fulfill the lever rule for the FCC and BCC phases, the solubility limit of Fe in Cu should be higher for the higher Fe contents and vice versa.
3.1.2. Anisotropy of deformation
The breadth of the peaks is increased up to 48 h of milling, which is due to the convolution of the effects of crystallite size, strain and lattice defects. However, the intensity of deformation is not isotropic through different lattice directions.Fig. 7shows the variation of interplanar distance in the direction perpendicular
Fig. 6. The proportional amount of the FCC and BCC phases as a function of milling time for the powder mixture samples with 30% Fe (Series 3), 50% Fe (Series 5) and 70% Fe (Series 7).
Fig. 7. Variations of the distance between diffraction planes of the FCC phase in pure copper and samples with 30% to 70% of iron, all milled for 48 h.
Table 2
Variations of interplanar distances for 48 h milled samples. The data are normalized to the variation in the h1 1 1 direction for each sample.
Sample 200/111 220/111 311/111 222/111
0-48 1.809 0.666 0.887 0.736
3-48 1.195 0.893 0.988 0.891
5-48 1.307 0.909 1.125 0.994
7-48 2.173 1.037 1.700 1.049
to each of the diffracted planes of the FCC lattice for the samples that are milled for 48 h. In all cases, the extension of interplanar distance in the h2 0 0i direction is more remarkable. However, it should be noticed that this anisotropy can also be seen in the milled pure copper. As can be seen in (Table 2), the intensity of the anisotropy in h2 0 0i and h2 2 2i directions decrease by incre-ment of Fe content. But the interplanar spacing in the h3 1 1i direction shows a continuous increasing trend by the addition of super-saturated iron atoms, which can be one reason for the tendency of iron atoms to place in this direction.
A common method to separate the broadening effect due to crystallite size from strain, is the Williamson–Hall (WH) method
[57]. It should be noticed that the WH method is not proper for all kinds of powders. The variations of FWHM with diffraction vec-tor (g) for five FCC peaks is shown inFig. 8. As is seen, the FWHM is not a monotonous function of g, indicating the progress of the data
with g is strongly anisotropic, therefore the WH method cannot offer precise enough results in this case, and its results show bigger crystallites for highly deformed metallic samples[58,59].
Fig. 9illustrates the changes in crystallite size versus milling time. The results obtained from Scherer and Rietveld method in this work are compared with some previously available results which are obtained from the Scherer and Williamson–Hall meth-ods. The differences between the results in published studies can be related to the differences in milling conditions such as the energy of milling or usage of lubricants, but it should be noted that the method of crystallite size calculation is also effective. The Scherer equation does not separate the effects of lattice strain and crystallite size in line broadening; therefore its results will contain serious error in case of highly deformed metallic powders like products of mechanical alloying. The Rietveld method uses the intensity of all diffraction points; therefore in case of materials
Fig. 8. Variations of FWHM with g, for samples which are milled for 48 h.
Fig. 9. Variation of FCC crystallite size versus milling time for samples with different Fe content, in comparison with previous studies. The solid lines refer to the result of this work and dash lines are related to the prior results.[25]and[27]used the Scherer method and[33]used the WH method.
with overlapped peaks, such as the main peaks of Fe and Cu, this method has another advantage over conventional methods, like Scherer and Williamson–Hall.
De-convolution of crystallite size effect using Rietveld full pro-file fitting, results in somehow smaller crystallite size. On the other hand, line broadening is dissimilar for different FCC peaks. As can be seen in (Table 1), crystallites mostly have the maximum size in h1 1 1i direction and the minimum is towards h2 0 0i. Therefore, considering a wider diffraction range which includes more peaks will result in a more accurate crystallite size in the Cu–Fe system. Anomalous peak broadening in FCC metals can be due to formation of stacking faults in (1 1 1) plane[60]. There is, however, a similarity between directions with high interplanar distance increment and directions which display smaller crystallite sizes in the milled powder.
As can be predicted, continuation of milling results in reaching a steady state level of crystallite size. However, in series 7 there is a slight increase in the size of FCC crystallites in period of 48–96 h. This can support the idea of re-crystallization of amorphous phase in samples with 70% Fe content.
As the Fe proportion increased from 30% to 70%, the FCC crystal-lites became smaller. This is in agreement with previous results
[27]. It is also considerable that with the progress of milling, the BCC crystallite size becomes smaller than that of FCC. This circum-stance is the same as in the literature[26,43]. The BCC crystallite size is not reported here for samples which are subjected to 48 and 96 h of milling, due to inadequate quality of fits to small and broadened BCC peaks. Moreover, It is mentioned in the literature that the Fe crystallite size in the BCC range of compositions reduces by an increase in Cu proportion as well[33]. This can be due to reduction of ductility because of solid solution hardening in a super saturated alloy. However, it is reported that in the range of
4 6 Cu 6 12 percent, the crystallite size is independent of compo-sition[36].
3.1.3. TEM observations
In order to achieve a better understanding about the formation of the non-equilibrium phases, samples 5-12, 5-48 and 5-96 were
Fig. 10. (a) Lattice planes in sample 5-12 (b) Nano-crystallites in sample 5-48 (c) an SAD pattern with Fe(2 0 0) diffractions from sample 5-96. (d) Non-dissolved nano particles in sample 5-48.
Fig. 11. Non-dissolved particles inside two grains of sample 5-48. 386 M. Mojtahedi et al. / Journal of Alloys and Compounds 550 (2013) 380–388
investigated using high resolution TEM. The mixed up crystallites of Fe and Cu can be detected in all specimens, as illustrated in
Fig. 10(a) for the sample milled for 12 h. The interplanar distances in this Figure are in close proximity to Cu(1 1 1) and Fe(1 1 0). The minor inaccuracy can be due to slight errors in calculation or scale bars of the images.
As an example of lattice defects, two crystallites with mirror symmetry can be seen inFig. 10(b), which can be an indication of a twin boundary in the FCC lattice. Around the crystallite at the top of the image, there is no apparent order between visible dots. This pattern can implicate the formation of amorphous re-gions, as mentioned in[28].
Fig. 10(c) shows a SAD pattern for crystallites of sample 5-96. The points which are marked with arrows are related to the Fe(2 0 0) plane. Therefore, the BCC Fe crystallites are still present after 96 h of milling. Moreover, dispersed equiaxed nanocrystal-lites that are not dissolved in the background phase can be obvi-ously seen inFig. 10(d) and Fig. 11. This is in good agreement with the XRD results on formation of a dual phase structure. It has been shown by STEM Z-contrast imaging that an uniform structure is formed up to 25% Fe content[51]Now, it can be seen that a complete single phase solid solution could not form in high-er concentrations.
Z-contrast imaging is also utilized in order to better investigate the dispersion of solute and solvent material, and the presence of clusters with non-uniform composition. High angle annular dark field (HAADF) STEM is a powerful method for such purposes.
Fig. 12shows two HAADF images of samples 5-48 and 5-96. The
element with lower atomic number (iron) can be identified by brighter regions.Fig. 12(a) shows a quite uniform dispersion. But this does not represent the formation of a single phase solid solu-tion. The presence of bright particles is obvious inFig. 12(b). Smal-ler white spots are also visible inside gray zones. These prove the formation of a dual phase structure, alongside with a quite uniform solid solution inside each phase.
4. Conclusion
The development of non-equilibrium solid solution by mechan-ical alloying of Cu–Fe powder mixture has been investigated. The deformation in the super-saturated FCC structure is not isotropic in various directions. The distances between lattice planes have a greater increase towards h2 0 0i and h3 1 1i directions. The Rietveld
full profile analysis shows a more reliable crystallite size than the Scherer and Williamson–Hall methods for the resulting powder and the obtained crystallites sizes by Rietveld refinement are smal-ler. The anisotropic behavior can also be detectable in the crystal-lite size variation. Therefore, it is important to mention that the reported information may exhibit an average number.
FCC phase is the dominant structure in our conditions of milling for up to 70 wt.% of iron, but BCC phase with crystallite size less than 10 nm still exists. Analysis of XRD profiles confirms the for-mation of a dual phase mixture with about 85% of FCC and 15% of BCC phase in all the experimented compositions. Existence of a dual phase structure is also confirmed by the aid of high resolu-tion TEM observaresolu-tions. HAADF Z-contrast imaging verifies the presence of Fe rich regions inside the super saturated Cu rich solid solution. While the resultant powder is not a single phase solution, each of the FCC and BCC phases are homogenous solid solutions.
References
[1] S. Mula, H. Bahmanpour, S. Mal, P.C. Kang, M. Atwater, W. Jian, R.O. Scattergood, C.C. Koch, Mater. Sci. Eng. A 539 (2012) 330–336.
[2] E. Botcharova, J. Freudenberger, L. Schultz, J. Alloys Comp. 365 (2004) 157–163. [3] X. Cui, L. Wang, M. Qi, J. Mater. Sci. Technol. 17 (2001) S89–S92.
[4] C. Aguilar, J. Marín, S. Ordóñez, D. Celentano, F. Castro, V. Martínez, Revista de Metalurgia 42 (2006) 334–344.
[5] P.A. Rojas, A. Peñaloza, C.H. Wörner, R. Fernández, A. Zúñiga, J. Alloys Comp. 425 (2006) 334–338.
[6] C. Aguilar, F. Castro, V. Martínez, D. Guzmán, F. de las Cuevas, L. Lozada, N. Vielma, Mater. Sci. Eng. A 548 (2012) 189–194.
[7] V.D.P. Martínez, C. Aguilar, J. Marín, S. Ordoñez, F. Castro, Mater. Lett. 61 (2007) 929–933.
[8] K. Sakurai, C.H. Lee, N. Kuroda, T. Fukunaga, U. Mizutani, J. Appl. Phys. 75 (1994) 7752–7755.
[9] S.N. Alam, Mater. Sci. Eng. A 433 (2006) 161–168.
[10] M.H. Maneshian, A. Simchi, Z.R. Hesabi, Mater. Sci. Eng. A 445–446 (2007) 86– 93.
[11] D.Y. Ying, D.L. Zhang, J. Alloys Comp. 311 (2000) 275–282.
[12] C. Gente, M. Oehring, R. Bormann, Phys. Rev. B 48 (1993) 13244–13252. [13] G. García-Pacheco, G. Cabañas, C.S. Santiago López-Cajún, A. Herrera, V.
Castaño, Mater. Res. Innovat. 3 (2000) 332–339. [14] M. Azimi, G.H. Akbari, J. Alloys Comp. 509 (2011) 27–32.
[15] X.R. Liu, Y.B. Liu, Z.Y. Cao, X. Ran, X.Y. Guo, Cailiao Rechuli Xuebao Trans. Mater. Heat Treat. 27 (2006) 31–33.
[16] N.S. Cohen, E. Ahlswede, J.D. Wicks, Q.A. Pankhurst, J. Phys.: Condens. Matter 9 (1997) 3259–3276.
[17] M. López, V. Núñez, R. Koduri, M.E. Gómez, J. Jiménez, D. Reyes, Powder Metall. 55 (2012) 148–153.
[18] M.R. Rezvani, A. Shokuhfar, Mater. Sci. Eng. A 532 (2012) 282–286. [19] A.I. Pashkov, S.P. Gerasimov, Russ. J. Non-Ferr. Met. 50 (2009) 610–611. Fig. 12. HAADF images showing Z-contrast in samples (a) 5-48 and (b) 5-96.
[20] Y.L. Chen, Y.H. Hu, C.W. Tsai, C.A. Hsieh, S.W. Kao, J.W. Yeh, T.S. Chin, S.K. Chen, J. Alloys Comp. 477 (2009) 696–705.
[21] J. Bhatt, G.K. Dey, B.S. Murty, Metall. Mater. Trans. A: Phys. Metall. Mater. Sci. 39 (2008) 1543–1551.
[22] P.J. Schilling, J.H. He, J. Cheng, E. Ma, Appl. Phys. Lett. 68 (1996) 767–769. [23] J.Z. Jiang, F.T. Chen, J. Phys.: Condens. Matter 6 (1994) L343–L348. [24] J.Z. Jiang, C. Gente, R. Bormann, Mater. Sci. Eng. A 242 (1998) 268–277. [25] J.Z. Jiang, U. Gonser, C. Gente, R. Bormann, Appl. Phys. Lett. 63 (1993) 2768–
2770.
[26] J.Z. Jiang, J.S. Olsen, L. Gerward, S. Mørup, Nanostruct. Mater. 12 (1999) 847– 850.
[27] J.Y. Huang, A.Q. He, Y.K. Wu, Nanostruct. Mater. 4 (1994) 1–10.
[28] J.Y. Huang, A.Q. He, Y.K. Wu, H.Q. Ye, D.X. Li, J. Mater. Sci. 31 (1996) 4165– 4169.
[29] X. Huang, T. Mashimo, J. Alloys Comp. 288 (1999) 299–305. [30] E. Gaffet, M. Harmelin, F. Faudot, J. Alloys Comp. 194 (1993) 23–30. [31] E. Ma, M. Atzmon, F.E. Pinkerton, J. Appl. Phys. 74 (1993) 955–962. [32] J. Eckert, J.C. Holzer, W.L. Johnson, J. Appl. Phys. 73 (1993) 131–141. [33] J. Eckert, J.C. Holzer, C.E. Krill, W.L. Johnson, J. Appl. Phys. 73 (1993) 2794–
2802.
[34] S. Wei, W. Yan, Y. Li, W. Liu, J. Fan, X. Zhang, Phys. B: Condens. Matter 305 (2001) 135–142.
[35] A.N. Kravtsova, G.E. Yalovega, A.V. Soldatov, W.S. Yan, S.Q. Wei, J. Alloys Comp. 469 (2009) 42–49.
[36] R.A. Dunlap, D.A. Eelman, G.R. Mackay, J. Mater. Sci. Lett. 17 (1998) 437–439. [37] C.G. Wille, T. Al-Kassab, R. Kirchheim, Ultramicroscopy 111 (2011) 730–737. [38] A. Yousif, K. Bouziane, M.E. Elzain, X. Ren, F.J. Berry, H.M. Widatallah, A. Al
Rawas, A. Gismelseed, I.A. Al-Omari, Hyperfine Interact. 156–157 (2004) 213– 221.
[39] Y. Yang, X. Ma, Y. Dong, Acta Metall. Sinica-Chin. Ed. 28 (1992) 403.
[40] F. Faudot, E. Gaffet, M. Harmelin, J. Mater. Sci. 28 (1993) 2669–2676. [41] V.V. Cherdyntsev, S.D. Kaloshkin, Phys. Met. Metall. 109 (2010) 492–504. [42] P.P. Macrí, P. Rose, R. Frattini, S. Enzo, G. Principi, W.X. Hu, N. Cowlam, J. Appl.
Phys. 76 (1994) 4061–4067.
[43] L.B. Hong, B. Fultz, Acta Mater. 46 (1998) 2937–2946.
[44] P. Gorria, D. Martínez-Blanco, J.A. Blanco, M.J. Pérez, M.A. González, J. Campo, Phys. B 384 (2006) 336–340.
[45] G. Caglioti, A. Paoletti, F.P. Ricci, Nucl. Instrum. 3 (1958) 223–228. [46] J.I. Langford, A.J.C. Wilson, J. Appl. Crystallogr. 11 (1978) 102–113. [47] H.M. Rietveld, Acta Crystallogr. A 22 (1967) 151–152.
[48] Y. Waseda, E. Matsubara, K. Shinoda, X-ray Diffraction Crystallography, Introduction, Examples and Solved Problems, Springer-Verlag, Berlin, Heidelberg, 2011.
[49] M. Oehring, R. Bormann, Mater. Sci. Eng. A 134 (1991) 1330–1333. [50] H.G. Tang, X.F. Ma, W. Zhao, X.W. Yan, R.J. Hong, J. Alloys Comp. 347 (2002)
228–230.
[51] J.C. Crivello, T. Nobuki, T. Kuji, Mater. Trans. 49 (2008) 527–531. [52] T.G. Nieh, J. Wadsworth, Scr. Metall. Mater. 25 (1991) 955–958.
[53] C. Suryanarayana, Mechanical Alloying and Milling, Marcel Dekker, New York, 2004.
[54] E. Ma, J.H. He, P.J. Schilling, Phys. Rev. B: Condens Matter Mater. Phys. 55 (1997) 5542–5545.
[55] N.S. Cohen, M. Odlyha, D.H. Ucko, Q.A. Pankhurst, J. Therm. Anal. Calorim. 56 (1999) 239–245.
[56] A.R. Yavari, P.J. Desré, T. Benameur, Phys. Rev. Lett. 68 (1992) 2235–2238. [57] G.K. Williamson, W.H. Hall, Acta Metall. 1 (1953) 22–31.
[58] T. Ungár, Á. Révész, A. Borbély, J. Appl. Crystallogr. 31 (1998) 554–558. [59] I.C. Dragomir, T. Ungár, J. Appl. Crystallogr. 35 (2002) 556–564.
[60] V.I. Fadeeva, A.V. Leonov, E. Szewczak, H. Matyja, Mater. Sci. Eng. A 242 (1998) 230–234.