1Abstract—In this study, a novel computer-aided detection (CAD) method is introduced to detect pulmonary embolism (PE) in computed tomography angiography (CTA) images. This method consists of lung vessel segmentation, PE candidate detection, feature extraction, feature selection and classification of PE. PE candidates are determined in lung vessel tree. Then, feature extraction is carried out based on morphological properties of PEs. Stepwise feature selection method is used to find the best set of the features. Artificial neural network (ANN), k-nearest neighbours (KNN) and support vector machines (SVM) are used as classifiers. The CAD system is evaluated for 33 CTA datasets with 10 fold cross-validation. The sensitivities of these classifiers are obtained as 98.3 %, 57.3 % and 73 % at 10.2, 5.7 and 8.2 false positives per dataset respectively.
Index Terms—Artificial neural network, k-nearest neighbours, pulmonary embolism, support vector machines.
I. INTRODUCTION
PE is a circulatory system problem and arises from the occlusion of the lung vessels by clot of blood. Furthermore, the diagnosis of PE is difficult and early treatment can save lives [1]. In most institutions, for the detection of PE, contrast-enhanced pulmonary multi detector CTA is chosen as an imaging method [2]–[5].
Lung segmentation is routinely used as the first step to detect PEs. CAD systems are important part of the radiologist’s assessment of CTA images. However CAD systems for PE detection have some limitations. Designing a CAD system for a specific PE pattern, such as peripheral PE, results in insufficient performance for other types of PEs [6]. Also evaluation of a CAD system which is proposed without motion artifacts shows worse efforts with the realistic datasets expect representatives [7], [8]. There is high degree uncertainty of generalization of systems with detecting a low number of emboli [9], [10] and the studies
Manuscript received 15 April, 2016; accepted 12 September, 2016.
have reported poor sensitivity and false positives with large realistic datasets [11]–[13].
Usually image processing methods, such as thresholding, region growing, tracking and edge detection algorithms are used to segment lung vessels that are disconnected due to PEs. They discriminate PEs based on their intensity and presumed shape. Techniques dependent on volume, intensity and length to classify PEs and false positives are prone to yield [6]–[15]. In our earlier study, a new CAD method was introduced to detect PEs in CTA images. We segmented lung [16], lung vessel [17], aorta [18] and obtained accurate lung vessel segmentation and recognize discontinuities of vessels due to PEs by determining the starting region of PEs and some reference points according to the anatomical structures. To distinguish PE; intensity, volume and shape properties of the PEs were utilized [19].
In this paper, same dataset was used with our earlier studies but a new CAD system was proposed to analyze 33 datasets with 450 PEs. We demonstrate a new technique to segment lung and lung vessels. Adaptive threshold was used, and lungs were segmented with their vessels. A tracking algorithm was applied to fix the vessels which are not bound to each other because of PE. After lung vessel segmentation, PE candidates were obtained using Connected Component Labeling (CCL) and intensity thresholding. Then, the features of PEs based on morphological properties were computed for each candidate. Also feature selection criteria were applied. Lastly, the machine learning algorithms such as; ANN, KNN and SVM, were implemented and the obtained results were compared to each other. We have finally discussed our results and compared to the published literature.
II. MATERIALS ANDMETHODS
CTA images were obtained from Dr. Siyami Ersek thoracic and cardiovascular surgery training and research hospital. To perform pulmonary CTA exams, 16 detectors
Automatic Detection of Pulmonary Embolism in
CTA Images Using Machine Learning
Haydar Ozkan
1,2, Gokalp Tulum
3, Onur Osman
4, Sinan Sahin
51
Department of Electrical Engineering, Faculty of Engineering, University of California Los
Angeles, Los Angeles, California, USA
2
Department of Biomedical Engineering, Faculty of Engineering, Fatih Sultan Mehmet Vakıf
University, Istanbul, Turkey
3
Department of Electrical and Electronics Engineering, Faculty of Engineering and Architecture,
Yeni Yuzyil University, Istanbul, Turkey
4
Department of Electrical and Electronics Engineering, Faculty of Engineering and Architecture,
Arel University, Istanbul, Turkey
5
Department of Radiology, Dr. Siyami Ersek Thoracic and Cardiovascular Surgery Training and
Research Hospital, Istanbul, Turkey
CT (Somatom Sensation 16, Siemens, AG, Erlangen, Germany) equipment was used. Exams were performed in the case of 120 kV, 80 mA–120 mA, 1 mm slice thickness and 1.0-1.2 pitch. Each exam consists of 400–500 images with 512 x 512 voxels and 0.8 mm resolution. Data sets belonging to 33 patients are used. 15 of them are female, their ages change between 31 and 80. 18 of them are male, their ages are between 40 and 79.
In this study, detection of pulmonary embolism was achieved in three steps. Firstly, lung and lung vessel segmentation were performed. Secondly, PE candidates were detected from the lung vessels. Lastly processes of PE detection were fulfilled with feature extraction, feature selection and classification. The detailed flow chart of this method is shown in Fig. 1.
Fig. 1. Flow chart of the proposed method.
III. LUNG& LUNGVESSELSEGMENTATION In CTA images, left and right lungs were segmented using automatic threshold named Otsu method (Fig. 2(c)) for each 2D image. Then, the region between the lungs was determined as Mediastinum Region (MR). Lung vessel segmentation processes were realized by beginning from the pulmonary trunk to subsegmental vessels. First, in the MR; pulmonary trunk, arteries and lobar vessels with superior vena cava, descending and ascending aorta were segmented using adaptive threshold. If some of them touched each other, they would be separated through erode process. Healthy vessels without emboli reach out to the lungs without any interruption from the pulmonary trunk forward to the pulmonary arteries, lobar and segmental vessels. However, if the vessels have PEs, the vessel structure does not regularly reach out to the lungs. To mitigate this problem, at the second step, segmental and subsegmental vessels in the lungs were segmented then the lobar vessels in the MR which have PE were concatenated with segmental
vessels using tracking algorithm.
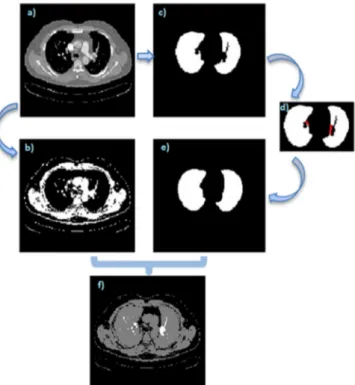
To segment the vessels in the lungs, automatic threshold was used for each 2D image (Fig. 2(b)). As it can be seen in Fig. 2(c), the borders of lungs should be smooth but because of vessels, they do not appear smooth. We unified the uneven area which is shown red lines in Fig. 2(d). The x axis values of the uneven borders at the left side of the right lung and at the right side of the left lung were analysed as 1 dimension signal. The signal has two peaks at the points where vessels reach inside the lungs. Getting derivative of the x value of the borders (dxdy), the two peaks were detected. The area between these two peaks points were concatenated using tracking algorithm. Then, Fig. 2(e) was achieved by filling up the holes. Figure 2(e), which is segmented exact mask of lungs, and Fig. 2(b), which is threshold image, were gathered and Fig. 2(f) was obtained. Since Fig. 2(b) and 2(e) are binary images, the segmental and subsegmental vessels in the lungs parenchyma are seen in different colour and they have different label (Fig. 2(f)). Using that label, segmental and subsegmental vessels were segmented.
Fig. 2. Segmental and subsegmental vessel segmentation: (a) – the original 2D image; (b) – threshold image by taking vessels; (c) – segmented 2D lungs without their vessels; (d) – adding vessels on the lungs; (e) – segmented lung with their vessels; (f) – segmented segmental and subsegmental vessels.
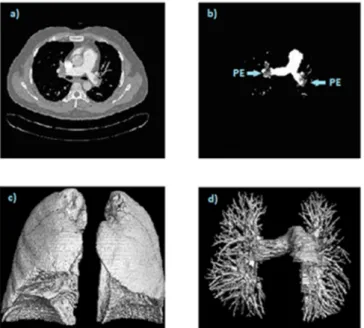
If there are any PE in the pulmonary artery or lobar vessels, those vessels are not linked with segmental vessels in the lungs. To mitigate this problem; pulmonary trunk, arteries and lobar vessels which were detected at the first step and segmental vessels which were detected at the second step were concatenated with each other using tracking algorithm. We used the peak points which are detected at the second step for segmental vessel detection on the lungs and lobar vessels corner for concatenating. As a result, all branches of the lung vessels were segmented. In Fig. 3(a), 2D image which belongs to one patient and in
Fig. 3(b), segmented 2D vessels with PEs are seen. Segmented 2D lungs and lung vessels were rendered to build 3D images (Fig. 3(c)–Fig. 3(d)).
Fig. 3. The original 2D image (a); Segmented 2D lung vessels with PEs (b); Segmented 3D lung (c); Segmented 3D lung vessels with all branches (d).
IV. PE CANDIDATEDETECTION
CTA data sets of 33 patients were analysed by three chest radiologists, having 3, 7 and 10 years of experience. At least two radiologists had to agree to designate a PE candidate as PE otherwise it was designated as non-PE. All 3 radiologists agreed on 422 PEs and 2 radiologists agreed about 23 PEs. 17 PE candidates were designated non-PE because of two disagreements. According to results of the designed CAD system, 5 of 17 non-PEs, were re-designated as PEs by the radiologists. As a result, the initial designation as 445 PEs was changed to 450 after using CAD system.
The obtained 3D vessel tree (containing the PEs) was labelled using 3D CCL algorithm and unconnected components were removed. An automatic threshold was applied, after which, very small components were assumed as noise (because of partial-volume effect) and removed using 3 x 3 median filtering. After the process, the remaining components were designated as PE candidates.
V. FEATUREEXTRACTION& SELECTION
To enhance the success of the system, distinctive features between PEs and non-PEs were calculated from PE candidates. We focused on the features based on volume, size in dimensions and the ratios of the features for each candidate. Total of 14 features were determined. The first subset of the features comprises maximum and mean values of the candidate length in all dimensions. With the help of these features, noise artefacts can be determined as non-PEs since most of the non-PEs have very small lengths in both 2-3 dimensions. Also number of voxels was computed for each candidate. This feature was used to remove small non-PEs. The second feature subset consists of possible largest area in transverse cross section and volume of each candidate. The largest length values of each candidate in all dimensions were used as the edges of the 2D and 3D shapes.
These features indicate the area and the volume of the candidates that could fill the maximum rectangular 2D and prismatic 3D spaces. The third feature subset was calculated based on the first and the second feature subsets. The ratios for each candidate are obtained; the number of voxels in the possible largest area in transverse cross section and volume, the number of voxels in the sum of the largest sizes in all dimensions and the number of voxels in the diagonal of the prismatic 3D space of candidate.
A stepwise feature selection method was used to find the best set of the features. This feature selection method depends on the T-score value of the features derived from the standard t-test. For a given feature X, t-score is calculated as following
2 1 2
2 1 1 2 2 1 2 ( ) , / ( ) t X n n n n (1)where μiis the mean of X, σiis the standard deviation of X
and ni is the number of the instances in the ith class
respectively. Once the t-scores were calculated, the best features that have t-scores greater than a predefined threshold were selected.
Eight best features, based on the stepwise feature selection method, are as follows; maximum value of each candidate length in all dimensions (3 features), possible largest area in transverse cross section and volume of each candidate, and their diagonals (3 features) and the ratios of the number of voxels in the possible largest area and the volume (2 features).
VI. CLASSIFICATIONMETHODS ANDRESULTS Two obtained new sets of variations from feature extraction and selection processes were used in three different classifiers. SVM, ANN and KNN algorithms were tested as classifiers to compare their performances. For evaluating the proposed CAD system, 33 datasets with 450 PE were used with 10-fold cross validation. Multi-Layer Perceptron (MLP) was applied as an ANN having two hidden layers with 14 and 7 neurons respectively. Scaled Conjugate Gradient (SCG) algorithm was used as a training algorithm [20]. Momentum constant and learning rate were chosen as 0.2 and 0.02 respectively. For a KNN, K value was selected as 30 which were found through trial and error to reach the best result. Additionally, Gaussian Radial Basis Function (RBF) kernel with a scaling factor was implemented as for SVM.
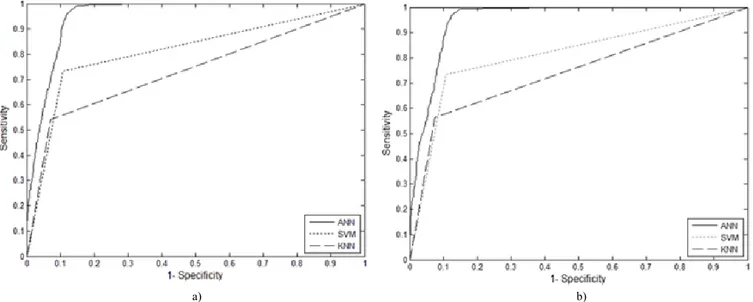
ROC curves of ANN, SVM and KNN classifiers which belong to all features and selected features are shown in Fig. 4(a)–Fig. 4(b) respectively. According to the Fig. 4(a)– Fig. 4(b), ANN classifier gives the best results for sensitivity both with all features and selected features. Accuracy, sensitivity and false positive ratio values of inflection points are given in Table I.
TABLE I. COMPARISION OF THE CLASSIFIERS.
Extracted Features Selected Features Accuracy Sensitivity FP/ds Accuracy Sensitivity FP/ds
ANN 95.10 % 97.1 % 10.4 95 % 98.3 % 10.2
KNN 87.52 % 56 % 5.7 87.7 % 57.3 % 5.9
a) b) Fig. 4. ROC curve of classifiers with: (a) 14 features; (b) 8 features.
VII. DISCUSSION
Previous works and our results can be seen in Table II. To summarize the results, Das et al. has a good sensitivity and FP/ds rate [6]. However, their CAD system was evaluated only for the peripheral vessels. Therefore, there is an uncertainty about how their system performs in all locations of lung vessel tree. The system performance of Digumarthy et al. is high quality in the case of no motion artefacts and no suboptimal opacification in their datasets [7]. But, in this study, we used the datasets of patients having heart diseases and disordered tissues due to different lung disease except PE. Nevertheless, the sensitivity of our proposed method is higher than that of their reports. Our CAD system yielded higher sensitivity and better FP/ds rates than study reported by Maizlin et al., which had low number of PEs [8]. Masutani et al. obtained a very high sensitivity but their number of datasets and PEs were very low [9]. Pichon et al. used low number of PEs from only three patients [10] but it was observed that sensitivity in their study is lower than that of our CAD system. Based on ROC curves given in Fig. 4(a)–Fig. 4(b) our proposed system has better sensitivity than the system proposed by Buhman et al. [11], Zhou et al. [12], Kiraly et al. [13] and Bouma et al. [14].
TABLE II. THE RESULTS OF PREVIOUS STUDIES AND OUR STUDY.
Reference PE Dataset Sensitivity FP/ds
Proposed Method 450 33 98.3 % 10.2 Ozkan [19] 450 33 95 % 14.4 Das [6] 120 33 78 % 4 Digumarthy [7] 270 39 92 % 2.8 Maizlin [8] 45 8 58 % 6.4 Masutani [9] 21 11 100 % 7.7 Pichon [10] 22 3 86 % 6.3 Buhmann [11] 352 40 47 % 3.9 Zhou [12] 225 14 52 % 11.4 Kiraly [13] 69 8 50 % -Bouma [14] 116 19 73 % 15
It is expected that FP/ds should be high due to the low number of PEs. For example, two patients in our datasets
have 3 and 4 PEs respectively. The results of FP for these patients are 15 and 17 respectively. As mentioned by Araoz et al. in a panel discussion, to diagnose PEs, the use of CTAs is rapidly increasing but the percentage of positive scans is decreasing [21]. So, the rate of positive pulmonary CTAs is in the range of 5 %–10 % in most studies. Therefore, a high FP rate is related in the event of having less number of PEs or absence of PE.
In our previous study, PEs were detected by segmenting lung vessel tree through some reference points. To decrease FP rate, different volume thresholds were applied. The results were achieved that the sensitivity values were high. On the other hand the FP/ds values were high, too [19]. In this new proposed method, we used same dataset with our earlier study but different vessel segmentation techniques and machine learning to classify PEs. The sensitivity was increased and FP/ds value was reduced.
VIII. CONCLUSIONS
In this study, CAD based a new method is demonstrated to detect PE in CTA images. The steps of the study are lung vessel segmentation, PE candidate detection from vessels, feature extraction based on morphological properties, feature selection and classification of PE. Using ANN classifier with selected features, we obtained higher sensitivity as 98.3 % and lower FP/ds as 10.2 than our previous study and some of the earlier study in the literature. As a result, according to the radiologists, our proposed CAD system is a useful tool as a second reader.
ACKNOWLEDGEMENT
This work is supported by Dr. Siyami Ersek Thoracic and Cardiovascular Surgery Training and Research Hospital, Istanbul, Turkey. The authors wish to thank chief of staff in the hospital, Prof. Dr. Ibrahim Yekeler. We declare that there is no conflict of interest.
REFERENCES
[1] R. Wittenberg, J. F. Peters, J. J. Sonnemans, M. Prokop, C. M. Schaefer-Prokop, “Computer-assisted detection of pulmonary
embolism: evaluation of pulmonary CT angiograms performed in an on-call setting”, Eur. Radiol., vol. 20, no. 4, pp. 801–806, 2010. [Online]. Available: http://dx.doi.org/10.1007/s00330-009-1628-7 [2] J. M. Remy, J. Remy, D. Artaud, F. Deschildre, A. Duhamel,
“Peripheral pulmonary arteries: optimization of the spiral CT acquisition protocol”, Radiology, vol. 204, pp. 157–163, 1997. [Online]. Available: http://dx.doi.org/http://dx.doi.org/10.1148/ radiology.204.1.9205239
[3] U. J. Schoepf, P. Costello, “CT angiography for diagnosis of pulmonary embolism: state of the art”, Radiology, vol. 230, pp. 329– 337, 2004. http://dx.doi.org/http://dx.doi.org/10.1148/ radiol.2302021489
[4] B. Ghaye, D. Szapiro, I. Mastora, V. Delannoy, A. Duhamel, J. Remy,
et al., “Peripheral pulmonary arteries: how far in the lung does multi-detector row spiral CT allow analysis?”, Radiology, vol. 219, pp. 629–636, 2001. [Online]. Available: http://dx.doi.org/ 10.1148/radiology.219.3.r01jn32629
[5] E. Coche, S. Pawlak, S. Dechambre, B. Maldague, “Peripheral pulmonary arteries: identification at multi-slice spiral CT with 3D reconstruction”, Eur. Radiol., vol. 13, pp. 815–822, 2003. [Online]. Available: http://dx.doi.org/10.1007/s00330-002-1734-2
[6] M. Das, A. Schneider, U. Schoepf, J. Cheema, S. Wood, P. Costello,
et al., “Computer-aided diagnosis of peripheral pulmonary emboli”,
Radiological Society of North America Scientific Assembly and Annual Meeting, 2003, Chicago IL. [Online]. Available: http://archive.rsna.org/2003/3102033.html
[7] S. R. Digumarthy, C. R. Kagay, A. C. Legasto, V. V. Muse, C. Wittram, J. O. Shepard, Computer-aided detection (CAD) of acute
pulmonary emboli: Evaluation in patients without significant pulmonary disease. Chicago IL, 2006.
[8] Z. Maizlin, P. Vos, M. Gody, P. Cooperberg, “Computer-aided detection of pulmonary embolism on CT angiography: Initial experience”, J Thorac Imaging, vol. 22, no. 4, pp. 324–329, 2007. [Online]. Available: https://doi.org/10.1097/RTI.0b013e31815b89ca [9] Y. Masutani, H. MacMahon, K. Doi, “Computerized detection of
pulmonary embolism in spiral CT angiography based on volumetric image analysis”, IEEE Trans. Med. Imag, vol. 21, pp. 1517–1523, 2002. [Online]. Available: http://dx.doi.org/10.1109/ TMI.2002.806586
[10] E. Pichon, C. L. Novak, A. P. Kiraly, D. P. Naidich, “A novel method for pulmonary emboli visualization from high-resolution CT images”, in Proc. SPIE Med. Imag., vol. 5367, pp. 161–170, 2004. [Online]. Available: http://dx.doi.org/10.1117/12.532892
[11] S. Buhmann, P. Herzog, J. Stoeckel, M. Salganicoff, M. Wolf, M. F. Reiser, et al., “Clinical evaluation of a CAD prototype for the detection of pulmonary embolism”, in European Congress of
Radiology,2006.
[12] C. Zhou, H. P. Chan, S. Patel, P. N. Cascade, B. Sahiner, L. M. Hadjiiski, et al., “Preliminary investigation of computer-aided detection of pulmonary embolism in 3-D CT pulmonary angiography”, Academic Radiology, vol. 12, no. 6, pp. 782–792, 2005. [Online]. Available: https://doi.org/10.1016/j.acra.2005.01.014 [13] A. P. Kiraly, C. L. Novak, D. P. Naidich, I. Vlahos, J. P. Ko,
G. T. Brusca-Augello, “A comparison of 2D and 3D evaluation methods for pulmonary embolism detection in CT images, Medical Imaging. Image perception, observer performance, and technology assessment”, in Proc. SPIE - Int'l. Society for Optical Engineering,
pp. 132–140, 2006. [Online]. Available:
http://dx.doi.org/10.1117/12.652430
[14] H. Bouma, J. J. Sonnemans, A. Vilanova, F. A. Gerritsen, “Automatic detection of pulmonary embolism in CTA images”, IEEE Trans.
Medical Imaging, vol. 28, no. 8, pp. 1223–1230, 2009. [Online]. Available: http://dx.doi.org/10.1109/TMI.2009.2013618
[15] C. Zhou, L. M. Hadjiiski, B. Sahiner, H. P. Chan, S. Patel, P. N. Cascade, et al., “Computerized detection of pulmonary embolism in 3-D CT images: Vessel tracking and segmentation techniques”, in Proc. SPIE Med. Imag., vol. 5032, pp. 1613–1620, 2003.
[16] H. Ozkan, O. Osman, S. Sahin, M. M. Atasoy, H. Barutca, A. F. Boz A. Olsun, “Lung Segmentation algorithm for CAD system in CTA images”, World Academy of science Engineering end Technology
(ICBCBBE 2011), 2011, vol. 53, pp. 306–309. [Online]. Available: scholar.waset.org/1999.9/15507
[17] H. Ozkan, “Lung vessel segmentation in computed tomography angiography images”, Istanbul University–Journal of Electrical &
Electronics Engineering, vol. 12, no. 1, pp. 1437–1443, 2012. [Online]. Available: http://www.journals.istanbul.edu.tr/iujeee/article/ view/1023021616
[18] H. Ozkan, “Segmentation of ascending and descending aorta in CTA images”, World Academy of science Engineering and Technology
(ICBCBBE 2012), 2012, vol. 65, pp. 451–453. [Online]. Available: scholar.waset.org/1999.9/313
[19] H. Ozkan, O. Osman, S. Sahin, A. F. Boz, “A novel method for pulmonary embolism detection in CTA images”, Computer Methods
and Programs in Biomedicine, vol. 113, no. 3, pp. 757–766, 2014. [Online]. Available: http://dx.doi.org/10.1016/j.cmpb.2013.12.014 [20] M. Moller, “A scale conjugate gradient algorithm for fast supervised
learning”, Neural Networks, vol. 6, pp. 525–533, 1993. [Online]. Available: http://dx.doi.org/10.1016/S0893-6080(05)80056-5 [21] P. A. Araoz, L. B. Haramati, J. R. Mayo, E. J. Jr. Barbosa,
F. J. Rybicki, et al., “Panel discussion: pulmonary embolism imaging and outcomes”, AJR Am J Roentgenol., vol. 198, no. 6, pp. 1313– 1319, 2012. [Online]. Available: http://dx.doi.org/ 10.2214/AJR.11.8461