Printed in the Republic of Korea
http://dx.doi.org/10.5012/jkcs.2013.57.2.204
Raman Frequencies Calculated at Various Pressures in Phase I of Benzene
Ozlem Tari and Hamit Yurtseven†,*Department of Mathematics and Computer Science, Istanbul Arel University, 34537 Istanbul-Turkey
†Department of Physics, Middle East Technical University, 06531 Ankara-Turkey. *E-mail: [email protected]
(Received May 23, 2012; Accepted January 21, 2013)
ABSTRACT. We calculate in this study the pressure dependence of the frequencies for the Raman modes of A (Ag), B (Ag, B2g) and C (B1g, B3g) at constant temperatures of 274 and 294K (room temperature) for the solid phase I of benzene. Using the
mode Grüneisen parameter of each lattice mode, which correlates the pressure dependence of the crystal volume and the quency, the Raman frequencies of those modes are computed for phase I of benzene. Our results show that the Raman fre-quencies of the three lattice modes (A, B and C) increase as the pressure increases, as expected. The temperature effect on the Raman frequencies is not significant, which can be explained by the experimental measurements.
Key words: Raman frequency, Lattice modes, Solid phase I, Benzene INTRODUCTION
Benzene is one of the most studied organic compounds. Various thermodynamic and spectroscopic properties have been investigated, in particular, for the solid phases of I and II as functions of temperature and pressure. Its heat capacity was measured as a function of temperature many years ago.1 Later, the temperature and pressure depen-dences of the heat capacity and the thermal conductivity have been investigated experimentally in some detail for the solid phases of I and II.2 Thermal coefficients along the crystal axes in benzene have been obtained.3 Thermal expansivity has been measured at various pressures prior to melting in benzene.4 Also, solid−liquid phase equilibria of the benzene + cyclohexane system have been studied experimentally.5 Measurements of the molar volume as functions of temperature and pressure have been reported with the molar volume discontinuities at melting in ben-zene.6 Using the experimental data,4,6 we have calculated the molar volume as a function of temperature7 and pressure8 close to the melting line in benzene in our earlier studies. Regarding the temperature - pressure properties of var-ious phases of benzene, thermodynamic and spectroscopic measurements have yielded the T−P phase diagrams of this molecular crystal. Brigman obtained the experimental P−T phase diagram of benzene to 200oC and 50 kbar.9 Approx-imate T−P phase diagram up to 600oC and 4GPa10 by X-ray and phase diagram of benzene to 35 kbar11 have been obtained by differential thermal analysis (DTA). A complete T−P phase diagram of benzene has been investigated up to 550oC and 30GPa by Raman scattering.12 Recently, we
have calculated T−P phase diagram of benzene13,14 by the mean field theory using the experimental data,12 as given in Fig. 1. As we calculated the phase diagram of benzene, the mean field theory can be used to calculate the phase diagrams (T−P or T−X) of various physical systems. Accord-ing to the mean field theory (Landau phenomenological model), the free energy is expanded in terms of the order parameters and also including the coupling terms between the order parameters. By minimizing the free energy (deriv-ative of the free energy with respect to the order parameter equals zero), the order parameter(s) can be determined in terms of the coefficients given in the expansion of the free energy. By assuming the temperature (pressure or concentra-tion) dependence of the coefficients in the free energy expan-sion (mainly the temperature dependence of the coefficient of the quadratic (a2Ψ2, Ψ is the order parameter, a2=α(T− Tc) where Tc is the critical temperature), the temperature or
pressure (concentration) dependence of the order param-eter(s) and the thermodynamic quantities such as thermal expansion, isothermal compressibility, specific heat etc. can be predicted close to the phase transitions. For a first order phase transition, the free energies of the two phases are equated, which corresponds to a4<0 for the a4Ψ4 term according to the Landau phenomenological model. Cor-respondingly, for a second order and tricritical phase tran-sitions, a4>0 and a4=0, respectively.
On the basis of the nature of the phase transition (first order, second order or tricritical), phase line equations (correlations between the free energies of the two phases in terms of the coefficients) are derived from the mean field theory, which give T−P or T−X phase diagrams and
they are compared with the experimental phase diagrams. Volume dependence of the Raman frequencies through the Grüneisen parameters (anharmonicity) in benzene has been the subject of a number of studies, in particular, on the solid benzene I.15−18 Very recently, we have also cal-culated the Raman frequencies using the volume data18 on the basis of the experimental vibrational modes19 and we obtained the pressure dependence of the isothermal compressibility20 in phase II of benzene.
In molecular crystals which exhibit anharmonic prop-erties, the vibrational frequencies depend on the crystal volume. This dependence defines the mode Grüneisen parameter which then measures the anharmonicity of a molecular crystalline system. So, the frequency shifts can be related to the volume change with the temperature and pressure through the mode Grüneisen parameter. As low-ering the temperature, pressure can change the molecular orientations and the ordering of the molecules can increase. This in fact occurs in benzene, in particular benzene I and new pressure-induced Raman bands appear, as observed experimentally.18 The pressure frequency shifts exhibit curvature (in the ν−P curves) which corresponds to the transition from one phase to another and also a new trans-formation can be obtained in the pressure range in ben-zene. In fact, the I−II phase transition has been detected by a change in the slopes of the ν−P curves of the lattice modes at about 4GPa.18 The frequency shifts are non-lin-ear with the pressure for the lattice modes of phase I in
benzene which is directly related to the large initial com-pressibility of benzene.18 Thus, calculating the Raman fre-quencies from the crystal volume through the mode Grüneisen parameter, gives insight into the thermodynamic proper-ties of molecular crystals such as benzene. So, the pres-sure (or temperature) dependence of the thermodynamic quantities such as the thermal expansion, isothermal com-pressibility and the specific heat, can be predicted from the Raman frequency shifts in benzene. Also, values of the mode Grüneisen parameter determined from the volume depen-dence of the frequency, provides a good deal of information about the structures of molecular crystals such as ben-zene, anthracene and naphthalene which can be classified as showing similar behaviour. This is the motivation of our study given here, which makes it interesting.
In this study, we calculate the Raman frequencies of the lattice modes Ag, (Ag, Bg) and (B1g, B3g) as a function of
pressure in phase I of benzene using the volume data18 through the mode Grüneisen parameter of the Raman modes studied. The Raman frequencies of the studied modes are calculated at constant temperatures of 274 and 294 K (room temperature) in benzene.
In section 2, we give our calculated Raman frequencies of the lattice modes. We discuss our results and conclu-sions in sections 3 and 4, respectively.
CALCULATIONS AND RESULTS Volume dependence of the frequency can be determined in a crystalline system and from this dependence the fre-quency can be calculated as functions of temperature and pressure. At constant temperatures, from the pressure depen-dence of both the crystal volume and the frequency, the isothermal mode Grüneisen parameter can be defined as (1) In Eq. (1), the pressure dependence of the crystal volume and the frequency can be considered as quadratic relations given by
(2) and
(3) respectively. In Eqs. (2) and (3), a0, a1 and a2, b0, b1 and b2
are constants.
In this study, we calculated the Raman frequencies of γT=–V---ν(∂ν/∂P)T / ∂V/∂P( )T
V a= 0+a1P a+ 2P2
ν b= 0+b1P b+ 2P2 Fig. 1. T−P phase diagram calculated from the mean field theory
for benzene.14 Solid lines represent the calculated phase lines. The experimental data points are also shown here for the observed T−P phase diagram of benzene.12T1, T2 and T3 are the
triple points. A denotes the decomposition point and the chemical transformation line is defined by the points A, B, C and D.12
the lattice modes of Ag, (Ag, Bg) and (B1g, B3g) abbreviated as A, B and C, respectively, as a function of pressure at constant temperatures (T=294 K, and 274 K) in the solid phase I of benzene. The volume data was used and through the values of the mode Grüneisen parameters,18 the Raman frequencies of those lattice modes were calculated.
We first analyzed the pressure dependence of the observed volume18 in phase I of benzene according to Eq. (2) and the coefficients a0, a1 and a2 were determined, as given in
Table 1. We then determined the functional form of the pressure dependence of the Raman frequency for the lat-tice modes of A, B and C using the observed Raman frequency data18 at T=294 K according to Eq. (3). The coefficients (b0, b1 and b2) determined are given in Table 2. In this
table, we also give the experimental values18 of the isother-mal mode Grüneisen parameter γT for the lattice modes
studied here.
In order to calculate the pressure dependence of the lat-tice modes of A, B and C, we also needed the extrapolated values of the volume at the temperatures of T=274 K and 300 K for zero pressure (P=0) in the solid phase I of ben-zene. These volume values were extracted from the volume data18 at various temperatures (P=0) using the quadratic relation
(4)
where a, b and c are constants. The extracted values of the volume and the coefficients a, b and c are tabulated in Table 3. Correspondingly, we used some observed values18
for the Raman frequencies of the lattice modes (A, B and C) as the initial data (Table 4) to predict the pressure depen-dence of the Raman frequencies for the lattice modes studied here. Using the observed values of the volume at various pressures at room temperature18 and the values of the mode Grüneisen parameter γT for the lattice modes of
A, B and C (Table 2), the Raman frequencies of those modes were predicted according to the relation
(5) where the temperature-dependent term is given by
(6) with the constants c0 and c1. In Eq. (5), ν1 is the value of the lattice modes (A, B and C) at T=294 K (P=0) and V1
represents the volume value at T1=300 K (P=0), as given
in Tables 2 and 3, respectively. We obtained Eq. (5) by solving Eq. (1) for the pressure dependence of the Raman frequencies of the lattice modes (A, B and C) with the additional A(T) term. This term was added to predict the Raman frequency as a function of pressure at constant temperatures of T=294 and 274 K in the solid phase I of benzene. Thus, using the volume data and the initial fre-quency data18 for the lattice modes of A, B and C, the coef-ficients c0 and c1 were determined (Eq. 5), as tabulated in
Table 4 for the solid phase I of benzene. Finally, using the volume data at various pressures at room temperature,18 values of γT and ν1 (Table 2), V1 value (Table 3) and, the
V a bT cT= + + 2
νT( ) A TP = ( ) ν+ 1exp[–γTln(VT( )/VP 1)]
A T( ) c= 0+c1(T1–T) Table 1. Values of the coefficients according to Eq. (2) for the
phase I of benzene
a0 (cm3) a1 (cm3/GPa) a2 (cm3/GPa2)
75.63 −9.19 1.56
Table 2. Values of the coefficients according to Eq. (3) for the Raman bands indicated. Values of the isothermal mode Grüneisen parameter γT and the values of the Raman frequency ν1 at P=0 (T=294 K) for the lattice modes are also given here for the phase I of benzene
Raman bands b0 (cm−1) b1 (cm−1/GPa) −b2 (cm−1/GPa2) γT ν1 (cm−1)
Ag 44.94 20.54 2.48 3.0 44.94
(Ag, B2g) 64.35 27.19 3.50 2.5 64.35
(B1g, B3g) 105.45 49.49 6.33 3.0 105.45
Table 3. Values of the coefficients according to Eq. (4) for the phase I of benzene. The values of the molar volume extrapolated (Eq. 4) are also given here
a (cm3) −b (cm3/K) c×10−4 (cm3/K2) V
274K (P=0) (cm3) V294K (P=0) (cm3) V1 (cm3) at T=300 K (P=0)
69.38 0.015 1.42 76.0 77.3 77.7
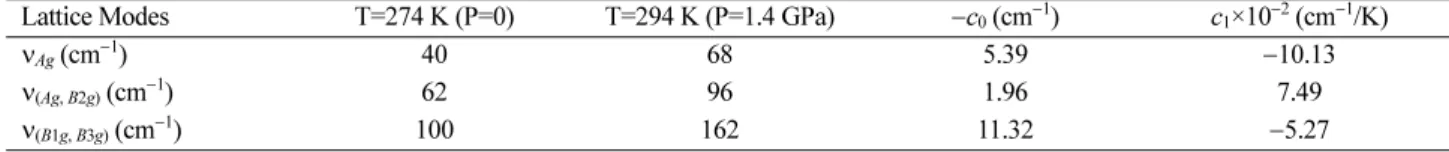
Table 4. Observed values of the Raman frequencies18
for the lattice modes in the phase I of benzene. Values of the coefficients c0 and c1
according to Eq. (6) are also given here
Lattice Modes T=274 K (P=0) T=294 K (P=1.4 GPa) −c0 (cm−1) c1×10−2 (cm−1/K)
νAg (cm−1) 40 68 5.39 −10.13
ν(Ag, B2g) (cm−1) 62 96 1.96 7.49
values of the coefficients c0 and c1 (Table 4), the Raman frequencies of the lattice modes (A, B and C) were cal-culated as a function of pressure through Eq. (5) for the solid phase I of benzene. The Raman frequencies of the lattice modes were calculated at various pressures for con-stant temperatures of T=294 and 274 K for the phase I of benzene. We plot our calculated frequencies of the Raman modes A, B and C in Figs. 2−4, respectively.
DISCUSSION
The Raman frequencies of the lattice modes (A, B and C) were calculated using Eq. (5) with a constant mode Grüneisen parameter γT for each mode in the solid phase I
of benzene (Figs. 2−4). As shown in these figures, our cal-culated frequencies which increase with increasing pressure, as expected, are nearly the same at constant temperatures of 274 and 294 K. It looks that the Raman frequencies cal-culated for the lattice modes A (Fig. 2) and B (Fig. 3) at T=274 K are very close to those at 294 K, whereas our cal-culated frequencies of mode C coincide at the constant temperatures of T=274 and 294 K (Fig. 4). For our cal-culation of the Raman frequencies (A, B and C) through Eq. (5), we assumed that the A(T) term was linearly dependent on the temperature with respect to the room temperature (Eq. 6). An increase of the Raman frequencies for the lat-tice modes A, B and C with the pressure closely for T=274 and 294 K (Figs. 2−4), shows that our assumption of a lin-ear dependence of A(T) on the temperature is reasonable. Also, a constant mode Grüneisen parameter γT of each
lat-tice mode for the solid phase I, which was taken in Eq. (5) is adequate.
Linearity of the A(T) term as a function of temperature (Eq. 6) when we calculated the Raman frequency at var-ious pressures for modes A, B and C (Figs. 2−4) is due to the fact that constant temperatures of 274 K and 294 K are very close to each other so that the temperature effect is very small. Considering the range of pressure (0−3.5 GPa) which is also limited, small change of the Raman frequency ν at two constant temperatures (274 K and 294 K) is expected. Thus, a linear variation of the A(T) term with the temperature is adequate within this pressure range at tem-peratures of 274 K and 294 K being too close. However, if the temperatures are widely different a non-linear depen-dence of the A(T) term on the temperature might be needed also within a wide range of pressure. At a large variety of Fig. 2. The Raman frequencies calculated as a function of
pres-sure at constant temperatures of 274 and 294K for the lattice mode Ag according to Eq. (5) for the phase I of benzene.
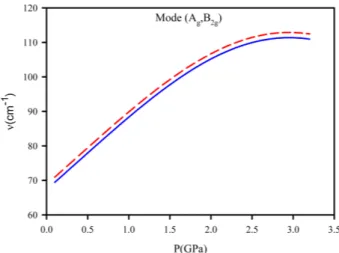
Fig. 3. The Raman frequencies calculated as a function of pres-sure at constant temperatures of 274 and 294K for the lattice mode (Ag, B2g) according to Eq. (5) for the phase I of benzene.
Fig. 4. The Raman frequencies calculated as a function of pres-sure at constant temperatures of 274 and 294K for the lattice mode (B1g, B3g) according to Eq. (5) for the phase I of benzene.
constant temperatures (0, 300, 700, 1000 K), variations of volume, bulk modulus, Grüneisen parameter and thermal expansion with the pressure (0−50GPa) have been stud-ied for monocarbide (ThC) very recently.21 Also, at a large variety of constant pressures (0, 15, 30, 50GPa) variations of those thermodynamic quantities including the specific heat CV with the temperature have been calculated for
ThC.21 They obtained that from the variations of volume, bulk modulus, Grüneisen parameter and thermal expan-sion with pressure at constant temperatures, the effect of the temperature is relatively small.21 On the contrary, vari-ations of volume, bulk modulus, Grüneisen parameter, ther-mal expansion and specific heat (CV) with temperature at constant pressures are considerably large. This variation is almost linear for volume, bulk modulus and Grüneisen parameter, whereas a drastic change occurs for thermal expansion and specific heat (CV) for ThC.21 This shows
that the pressure effect is dominant for variations of those thermodynamic quantities with the temperature at con-stant pressures for this material (ThC). In the case of ben-zene we studied here, our calculated Raman frequencies follow the same trend as a function of pressure at constant temperatures (T=274 and 294 K) for the lattice modes of A, B and C (Figs. 2−4). Thus, as expected the temperature is not effecting considerably when the Raman frequency was calculated at various pressures for constant temper-atures.
As we studied here, our approach of calculating the Raman frequencies for the lattice modes (A, B and C) is empir-ical. The Raman frequencies of those modes can be pre-dicted at various pressures by means of quantum chemical calculations. Using perturbation theory, Matsushita22 cal-culated the phonon frequency and damping constant in his microscopic model which was an extension of the Yamada et al. model23 for ammonium halides (NH4Cl, NH4Br). By
considering interactions between pseudospins and phonons in an Ising model, from the eigenstates of a pseudo-Ising spin due to the two orientations of an ammonium ion, Matsushita22 predicted the temperature dependence of the Raman frequency and the damping constant of the optical phonon modes in ammonium halides. Yamada et al.23 also predicted the temperature dependence of the lattice param-eter in their Ising spin-phonon coupled model for NH4Br.
Thus, on the basis of the microscopic models such as an Ising spin-phonon coupled model, the temperature (or pressure) dependence of the phonon frequencies and the lattice param-eter (crystal volume) can be correlated by means of mode Grüneisen parameter and this approach can be applied to benzene.
The Raman frequencies can also be calculated using the anharmonic self-energy where cubic and quadric anhar-monic terms are added to the potential24 and the total energy is then calculated in second-order perturbation.25 The real part of the self energy gives the phonon frequency and the imaginary part gives the full width at half-intensity of the Raman line. This model has been applied to the Raman spectrum of solid nitrogen at high pressures and low tem-peratures.25 We have also used the anharmonic self-energy model to investigate the temperature dependence of the Raman modes in solid nitrogen26,27 and in quartz.28
Also, physical properties of thorium monocarbide have been investigated21 using the first-principles plane wave pseudopotential approach to the density-functional theory (DFT).29 And, the thermodynamic properties of thorium monocarbide have been studied by means of the quasi-harmonic Debye model.21
In benzene I besides in the lattice regions, the pressure dependence of the other Raman active modes, namely, ν6,
ν5, ν1, ν9, ν6 in Fermi resonance with ν1+ν6, ν7 and ν2
modes have been obtained experimentally at 294 K.18 When pressure increases on benzene I, as the lattice modes (A, B and C) studied here, those Raman lines shift towards the higher frequencies which vary linearly with the pres-sure, as observed experimentally.18 So, Eq. (3) is not val-idated for the analysis of the other Raman modes stated above because of the linear variation of the Raman fre-quency with the pressure in benzene I. Thus, the slope of the ν−P curves of those Raman modes becomes constant (b1), independent of pressure (b2=0 in Eq. 3). This,
how-ever, does not match the nonlinear variation of the crystal volume with the pressure (Eq. 2) to determine the mode Grüneisen parameter according to Eq. (1). Considering the lattice modes (A, B and C) studied here, change in the slopes of the ν−P curves is significant (Figs. 2-4), whereas these changes are less apparent for the other Raman modes. There exist two more lattice modes labelled as Y and Z whose Raman frequencies are between the lattice modes of B and C, also vary nonlinearly with the pressure, as observed experimentally above 0.7GPa at T=294 K.18 The ν−P curves of these modes (Y and Z) are similar to those of the lattice modes, A, B and C. So, they can be analyzed using Eq. (3). By determining values of the mode Grü-neisen parameter γT of those modes (Y and Z) using Eq. (1) through Eq. (2), the Raman frequencies of those modes can be predicted as a function of pressure at constant tem-peratures of 274 K and 294 K as the lattice modes A, B and C studied here. This then gives the temperature effect on the Raman frequencies of those modes at various
pres-sures in benzene I. Most likely, the temperature effect due to the lattice modes Y and Z would be the same as the modes A, B and C given in this study.
CONCLUSIONS
The Raman frequencies of the lattice modes Ag, (Ag, B2g)
and (B1g, B3g) were calculated as a function of pressure for constant temperatures of 274 and 294 K in the solid phase I of benzene. It was obtained that the Raman frequencies increase with increasing pressure, as expected. Those fre-quencies calculated for the lattice mode (B1g, B3g) are the
same at the temperatures of 274 and 294 K in phase I of benzene, whereas for the lattice modes of Ag and (Ag, B2g)
the calculated Raman frequencies which follow the same trend, are relatively temperature dependent.
Our calculated frequencies can be compared with the experimental measurements for the lattice modes (A, B and C) in the solid phase I of benzene.
Acknowledgments. The publication cost of this paper was supported by the Korean Chemical Society.
REFERENCES
1. Oliver, G. D.; Eaton, M.; Huffman, H. M. J. Chem. Phys. 1948, 70, 1502.
2. Ross, R. G.; Andersson, P.; Backström, G. Mol. Phys. 1979, 38, 377.
3. Bacon, G. E.; Curry, N. A.; Wilson, S. A. Proc. Roy. Soc. 1964, A279, 98.
4. Pruzan, Ph.; Liebenberg, D. H.; Mills, R. L. J. Phys. Chem. Solids 1986, 47, 949.
5. Nagaoka, K.; Makita, T. Int. J. Thermophysics 1987, 8, 415.
6. Figuiere, P.; Fucks, A. H.; Ghelfenstein, M.; Szwarc, H.
J. Phys. Chem. Solids 1978, 39, 19.
7. Yurtseven, H.; Ünsal, T. High Temp. Mater. Processes 2007, 26, 365.
8. Yurtseven, H.; Ünsal, T. Tsinghua Sci. Tech. 2007, 12, 624. 9. Bridgman, P. W. Proc. Amer. Acad. Arts Sci. 1949, 77, 129. 10. Block, S.; Weir, C. E.; Piermarini, G. J. Science 1970,
169, 586.
11. Akella, J.; Kennedy, G. C. J. Chem. Phys. 1971, 55, 793. 12. Cansell, F.; Fabre, D.; Petitet, J. P. J. Chem. Phys. 1993,
99, 7300.
13. Sen, S.; Yurtseven, H. J. Optoelectronics Adv. Mater. Symposia 2009, 1(3), 517.
14. Sen, S.; Yurtseven, H. Int. J. Trans. Phenomena 2011, 12, 319.
15. Ito, M.; Shigeoka, T. Spectrochim. Acta 1966, 22, 1029. 16. Bonadeo, H.; Marzoccki, M. P.; Castellucci, E.; Califano,
S. J. Chem. Phys. 1972, 57, 4299.
17. Elliott, G. R.; Leroi, G. E. J. Chem. Phys. 1973, 58, 1253. 18. Thiery, M. M.; Leger, J. M. J. Chem. Phys. 1988, 89, 4255. 19. Ciabini, L.; Gorelli, F. A.; Santoro, M.; Bini, R.; Schet-tino, V.; Mezovar, M. Phys. Rev. B 2005, 72, 094108. 20. Yurtseven, H.; Ra ito lu, B.; Kilit, E. J. Mol. Struc. 2011,
993, 428.
21. Aydin, S.; Tatar, A.; Ciftci, Y. O. J. Nuc. Mater. 2012, 429, 55.
22. Matsushita, M. J. Chem. Phys. 1976, 65, 23.
23. Yamada, Y.; Mori, M.; Noda, Y. J. Phys. Soc. Jpn. 1972, 32, 1565.
24. Wallace, D. C. Thermodynamics of Crystals; Wiley: New York, 1972.
25. Medina, F. D.; Daniels, W. B. J. Chem. Phys. 1976, 64, 150.
26. Yurtseven, H.; Tunay, T. Int. J. Mod. Phys. B 2010, 24, 6069.
27. Kurt, M.; Yurtseven, H. Int. J. Mod. Phys. B 2011, 25, 3679.
28. Kurt, M.; Yurtseven, H. Balkan Phys. Lett. 191042 2011, 19, 362.
29. Hohenberg, P.; Kuhn, W. Phys. Rev. B 1964, 136, 864. s¸ gˇ