KADIR HAS UNIVERSITY
GRADUATE SCHOOL OF SCIENCE AND ENGINEERING
ELECTRICITY DEMAND AND SUPPLY SCENARIO ANALYSIS FOR NIGERIA USING LONG RANGE ENERGY ALTERNATIVES PLANNING
GRADUATE THESIS
HANIF AUWAL IBRAHIM
Ha nif A uw al Ibr ahim M.S c. The sis 2017
ELECTRICITY DEMAND AND SUPPLY SCENARIO ANALYSIS FOR NIGERIA USING LONG RANGE ENERGY ALTERNATIVES PLANNING
HANIF AUWAL IBRAHIM
Submitted to the Graduate School of Science and Engineering in partial fulfillment of the requirements for the degree of
Master of Science in
INDUSTRIAL ENGINEERING
KADIR HAS UNIVERSITY JULY, 2017
ii
“I, HANIF AUWAL IBRAHIM, confirm that the work presented in this thesis is my own. Where information has been derived from other sources, I confirm that this has been indicated in the thesis.”
_______________________ HANIF AUWAL IBRAHIM
iii
ELECTRICITY DEMAND AND SUPPLY SCENARIO ANALYSIS FOR NIGERIA USING LONG RANGE ENERGY ALTERNATIVES PLANNING
ABSTRACT
Electricity demand and supply forecasts are very important tools for determining solutions to the problems in the electricity sector such as power outages. The Long Range Energy Alternatives Planning (LEAP) energy model was used for this study because of its low data requirements. The forecast for electricity demand and supply for Nigeria was carried out from 2010-2040. Three scenarios were generated which include Business as Usual (BAU), Energy Conservation (EC) and Renewable Energy (REN). The three scenarios were analyzed based on their electricity demand and supplies, environmental impact and costs. The BAU scenario assumed that trends in the future will follow past trends. The EC scenario was generated based on efficient usage of electricity and reduction of transmission and distribution losses. In the EC scenario, efficient electrical appliances will phase out the non-efficient ones, which reduced the electricity demand significantly. On the other hand, the REN scenario is based on the concept of harnessing renewable energy resources such as wind, solar, hydro, and biomass for electricity generation. Results of the cost analysis of the three scenarios shows that the most competitive scenario in terms of cost is the EC scenario, which has the least capital cost (44.2 billion USD less than the BAU scenario) and fixed costs (15 billion USD less than the BAU scenario) of the three scenarios but has the second largest quantity of Green House Gas (GHG) emissions of 1,004.8 million tons of CO2eq. The REN scenario has the least GHG emissions among the three scenarios at 114.79 million tons of CO2eq but is the most expensive scenario to implement because of its high capital (56.3 billion USD more the BAU) and fixed costs (4.1 billion USD more than the BAU scenario). The EC scenario has 28.96 % less carbon emissions than the BAU scenario (1,414.5 million tons of CO2eq) and has the least cost among the three scenarios. As a result of the current economic challenge faced by Nigeria and a growing electricity demand, the EC scenario is the most realistic and suitable scenario to be implemented among the scenarios that were generated.
Keywords: LEAP model, energy conservation, renewable energy, greenhouse gas emissions, cost analysis, energy modelling, scenario analysis.
iv
ELECTRICITY DEMAND AND SUPPLY SCENARIO ANALYSIS FOR NIGERIA USING LONG RANGE ENERGY ALTERNATIVES PLANNING
ÖZET
Elektrik arz ve talebi tahmini, elektrik kesintileri gibi elektrik sektöründeki sorunların çözümünde çok önemli bir araçtır. Bu çalışmada düşük veri gereksinimleri nedeniyle uzun vadeli enerji planlama sistemi olan LEAP modeli ile Nijerya için 2010-2040 yılları arasında elektrik arz ve talep tahminleri gerçekleştirilmiştir. Normal Gelişim (BAU), Enerji Korunumu (EC) ve Yenilenebilir Enerji (REN) olacak şekilde üç senaryo incelendi. Bu üç senaryo, elektrik arz ve talebi, çevreye olan etkileri ve maliyetleri açısından incelendi. BAU senaryosu, gelecekteki eğilimlerin geçmişteki eğilimleri izleyeceğini varsaymıştır. EC senaryosu, elektriğin verimli kullanılması ve iletim ve dağıtım kayıplarının azaltılması üzerine kurulmuştur. EC senaryosunda, verimli elektrik aletleri verimsizlerin yerine geçerek elektrik talebini önemli ölçüde azaltacaklardır. Diğer tarafran, REN senaryosu rüzgar, güneş, hidro ve biyoenerji gibi yenilenebilir enerji kaynaklarındaki çeşitliliğe bağlı elektrik üretimi üzerine kurulmuştur. Bu üç senaryonun sonuçları analiz edildiğinde, maliyetler açısından en rekabetçi senaryo, en düşük yatırım maliyetine (BAU senaryosundan 44.2 milyar dolar daha düşük) ve sabit gidere (BAU seneryosundan 15 milyar dolar daha düşük) sahip olan EC senaryosudur. EC senaryosu aynı zamanda 1004.8 milyon ton eşdeğer CO2 ile en çok sera gazı emisyonuna (GHG) sahip ikinci senaryodur. REN senaryosu, üç senaryo arasından 134.62 milyon ton eşdeğer CO2 ile en az GHG emisyonu miktarına sahip ama yüksek yatırım maliyeti (BAU senaryosundan 56.3 milyar dolar daha yüksek) ve yüksek sabit gideri (BAU senaryosundan 4.1 milyar dolar daha yüksek) ile en pahalı olan senaryodur. EC senaryosu, BAU senaryosuna göre yüzde 28.96 daha az karbon emisyonuna sahip (1,414.5 milyon ton eşdeğer CO2), üç senaryo arasında en düşük maliyetli senaryodur. Nijerya'nın karşı karşıya bulunduğu ekonomik büyüme ve artmakta olan elektrik talebi gözönüne alındığında, EC senaryosu üretilen senaryolar arasında en gerçekçi ve uygulaması en uygun senaryo olarak gözükmektedir.
Anahtar Kelimeler: LEAP modeli, enerji tasarrufu, yenilenebilir enerji, sera gazı emisyonları, maliyet analizi, enerji modellemesi, senaryo analizi
v
Acknowledgement
First of all, I would like to express my sincere gratitude to my advisor Asst. Prof. Gokhan Kirkil for the continuous support of my M.Sc. study and research, for his patience, motivation, enthusiasm, and immense knowledge. His guidance helped me in all the time of research and writing of this thesis. I could not have imagined having a better advisor and mentor for my M.Sc. study.
I would also like to express my utmost gratitude to my family especially my father Honorable Justice Auwal Ibrahim (Ph.D) and mother Hajiya Fatima Ibrahim for their moral and financial support during my entire studies.
I would also like to thank my great friends, Umar Faruq Dahiru, Usman Said Sufi, Muhammed Gaddafi Ya’u, Abdullahi Muhammed Kabir, and Alqasim Ahmad for their moral support during my studies.
vi Table of Contents ABSTRACT ... iii ÖZET... iv Acknowledgement... v Table of Contents ... vi List of Tables... xi Chapter 1 ... 1 Introduction ... 1 1.1 Statement ... 1
1.2 Scope and Outline of the Study ... 2
1.3 Literature Review ... 3
1.4 Materials and Methods ... 5
Chapter 2 ... 6
Overview of the Energy Sector and Electricity Infrastructure in Nigeria ... 6
2.1 Primary Energy Supply and Consumption Situation in Nigeria ... 6
2.1.2 Energy Resources and Reserves ... 7
2.1.2.1. Oil ... 7 2.1.2.2. Coal ... 8 2.1.2.3. Natural Gas... 9 2.1.2.4. Uranium ... 9 2.1.2.5. Biomass/Biofuels ... 9 2.1.2.6. Renewable Energy ... 10
2.1.3 Primary Energy Supplies ... 12
2.1.4 Final Energy Consumption ... 13
2.2 Overview of the Nigerian Electricity Sector ... 14
2.2.1 Electricity Generation in Nigeria ... 14
vii
2.2.3 Electricity Distribution in Nigeria ... 16
Chapter 3 ... 18
Methodology ... 18
3.1 The LEAP Model ... 18
3.2 LEAP Algorithm ... 18
3.2.1 Energy Consumption ... 18
3.2.2 Carbon Emission ... 19
3.2.3 Costs... 19
3.3 Nigeria’s LEAP Tree Diagram ... 19
3.4 Load Duration Curve ... 21
3.5 Data collection and Scenario Design ... 22
3.5.1 National Renewable Energy and Energy Efficiency Policy (NREEP, 2015) ... 22
3.5.1.1 Renewable Energy Targets Set by (NREEP, 2015) ... 23
3.5.2 The Renewable Energy Master Plan (REMP, 2013) ... 23
3.5.3 Sustainable Energy for All Action Agenda (SE4ALL-AA, 2016) Adopted by (Inter-Ministerial Committee on Renewable Energy and Energy Efficiency ICREEE) ... 24
3.6 Data Used in LEAP ... 24
3.6.1 Demographic and Economic Data ... 24
3.6.2 Energy Demand Data Used in LEAP ... 25
3.6.3 Emission Data Used in LEAP ... 26
3.6.4 Transformation Data ... 27
3.6.5 Fuel Costs ... 28
3.7 BAU, EC, and REN Scenarios Design ... 29
3.7.1 BAU Scenario ... 29
3.7.2 EC Scenario ... 29
viii
Chapter 4 ... 31
Results and Discussions ... 31
4.1 Electricity Demand Projections... 31
4.2 Electricity Supply Projections ... 34
4.2.1 BAU Electricity Supply ... 34
4.2.2 REN Electricity Supply ... 36
4.2.3 EC Electricity Supply ... 38
4.3 GHG Emission Analysis ... 40
4.4 Cost Analysis of BAU, EC and REN Scenarios ... 42
Chapter 5 ... 45
Conclusion and Policy Recommendations ... 45
5.1 Conclusion ... 45
5.2 Policy Recommendations ... 47
References ... 48
Appendices ... 56
Appendix A: Electricity Demand Tables ... 56
A1: BAU and REN Electricity Demand ... 56
A2: EC Electricity Demand ... 57
Appendix B: Electricity Supply Tables ... 58
Appendix B1: BAU Electricity Supply ... 58
B2: REN Electricity Supply ... 58
ix List of Figures
Figure 1: Installed Power Capacity (MW) by type (%) ... 1
Figure 2: Energy production in Nigeria (EIA, 2016) ... 6
Figure 3: Niger Delta States and Oil Fields ... 8
Figure 4:Coal and Lignite Occurrences in Nigeria ... 9
Figure 5: Solar Energy Distribution in Nigeria (Ohunakin et al., 2014)... 10
Figure 6: Nigeria’s Wind Distribution (Nat Met Department) ... 11
Figure 7: Hydro power plants in Nigeria (Federal Ministry of Power’s website) ... 12
Figure 8: Primary Energy Supply in Nigeria (IEA, 2016) ... 12
Figure 9: Nigeria’s Total Energy Supply (IEA, 2013) ... 13
Figure 10: Energy Consumption by sector in Nigeria (EIA, 2010) ... 13
Figure 11: Energy Consumption from 1990-2010 (UN Stats) ... 14
Figure 12: Electricity Generation Sites in Nigeria (Nigeria Power Guide Vol. 3) .... 15
Figure 13: Transmission Line of Nigeria (Nigeria System Operator) ... 16
Figure 14: Electricity Distribution (Securities & Exchange Commission, Nigeria) .. 17
Figure 15: Nigeria’s LEAP Tree Diagram ... 20
Figure 16: Nigeria’s energy system model diagram for forecasting and transformation ... 20
Figure 17: Hourly load duration curve (National Control Centre PHCN, Oshogbo) 21 Figure 18: Peak load shape used in LEAP ... 22
Figure 19: BAU and REN Electricity Demand Projections for Each Sector. ... 31
Figure 20: Energy Conservation Electricity Demand Projection for Each Sector. .... 32
Figure 21: Electricity Demand projection for BAU, EC, and REN scenarios ... 32
Figure 22: EC electricity demand share by 2040 ... 34
Figure 23: BAU Electricity Supply ... 35
Figure 24: BAU Sankey Diagram 2040 ... 35
Figure 25: BAU Electricity Supply Mix in 2040 ... 36
Figure 26: REN Electricity Supply ... 37
Figure 27: REN Sankey Diagram for 2040 ... 37
Figure 28: REN Electricity Supply Mix ... 38
Figure 29: EC Electricity Supply ... 39
x
Figure 31: EC Electricity Supply Mix ... 40 Figure 32: GHG Emission of BAU, EC, and REN ... 42 Figure 33: Comparison of the capital costs of the EC and REN scenarios with BAU ... 43 Figure 34: Comparison of the Fixed O&M costs of the EC and REN scenarios with BAU ... 43 Figure 35: Comparison of the Variable O&M costs of the EC and REN scenarios with BAU ... 44
xi List of Tables
Table 1: Demographic and Economic data used in LEAP ... 25
Table 2: Electricity Demand Data ... 26
Table 3: Electricity Generation Data for Existing Power Plants... 28
Table 4: Electricity Generation Data for Future Power Plants ... 28
Table 5: Costs of the Electricity Generating Technologies ... 28
xii Abbreviations
PHCN Power Holding Company of Nigeria NNPC Nigerian National Petroleum Cooperation
FGN Federal Government of Nigeria
USAID United States Agency for International Development WDI World Development Indicators
GHG Green House Gases NCC National Control Centre
IPCC Intergovernmental Panel on Climatic Change IEA International Energy Agency
kWh Kilowatt hours
LEAP Long Range Energy Alternatives Planning MAED Model Analysis of Energy Demand
MW Megawatts
NPV Net Present Value
BAU Business as Usual Scenario EC Energy Conservation Scenario
REN Renewable Energy Scenario
TED Technology Database CO2 Carbon Dioxide
1 Chapter 1
Introduction
1.1 Statement
Electricity is essential for the economic development of a country. Electricity consumption per capita is used as a measure to determine how developed a nation is, this clearly shows how important electricity is to the development of any nation. New findings in science and technology, made electricity the most preferred form of energy. Electricity can be easily converted into other forms of energy and has greater flexibility compared to other forms of energy.
Nigeria has a GDP of $486.793 billion dollars and is the 23rd largest economy in the world (World Bank, 2015). According to vision 20:20, Nigeria targets to be among the top 20 largest economies in the world by 2020 but for that to be achieved it will have to eliminate power outages, which has stagnated the development of the industrial and educational sectors. Nigeria’s available electrical capacity ranges between 3500MW to 5000MW (USAID, 2017). For a population of 186 million people this available capacity is clearly insufficient. Electricity supply is only from hydro and gas power plants, which have a percentage share of 22.9% and 77.1% respectively as seen in Figure 1.
Figure 1: Installed Power Capacity (MW) by type (%)
The Nigerian government has made efforts to improve electricity supply over the years in order to reduce power outages across the nation. Nigeria has allowed the involvement of foreign companies in the power sector to generate their own electricity
2
(IPP-Independent Power Plants) and sell it to distribution companies. Still the intervention of the private sector has not solved the recurrent power black outs experienced all over the country. This has not only underdeveloped the nation but caused national embarrassment as in the case of the black out at the Murtala Mohammed International Airport in Lagos and the 2009 FIFA under 17-world cup. Increase in population and a rapid economic growth, the government needs to make policies based on forecasts of electricity demand and supply to ensure that power outages are eradicated and there is constant electricity supply in Nigeria. Because of the importance electricity demand and supply forecasts this research work used Long Range Energy Alternatives Planning (LEAP) to project the electricity supply and demand from 2010 to 2040.
1.2 Scope and Outline of the Study
The study focused on projecting the electricity supply and demand using Long Range Energy Alternatives Planning (LEAP). Three scenarios namely Business as Usual (BAU), Energy Conservation (EC), and Renewable Energy (REN) based on the policies of the Federal Government of Nigeria (FGN) were developed to simulate the electricity demand and supply for the target year 2040. Cost and the GHG emission analysis of the scenarios were carried out and the three scenarios where compared to each other to determine the best path the Nigerian government should follow in order to provide uninterruptable power supply.
The summary of the five chapters of the thesis is given below.
Chapter 1 consists of the basic structure of the thesis and a brief detail about previous
studies done on electricity forecast using various methods and applications such as LEAP (Long Term Alternative Energy Planning), ARIMA (Autoregressive Integrated Moving Average models) and MAED (Model for Analysis of Energy Demand).
Chapter 2 includes the overview of the energy sector of Nigeria. It provides the basic
information concerning primary energy production, consumption of final energy, electricity generation, transmission, and distribution in Nigeria.
3
Chapter 3 gives an overview of the LEAP energy model. It contains information such
as the LEAP algorithm, Nigeria’s LEAP tree diagram, the summary of policy documents that were used in formulating the scenarios such as National Renewable Energy and Energy Efficiency Policy (NREEEP), the Renewable Energy Master Plan (REMP) and the Sustainable Energy for All Action Agenda (SE4ALL-AA) adopted by (Inter Ministerial Committee on Renewable Energy and Energy Efficiency- ICREEE). The chapter also contains the design of the BAU (Business as Usual), EC (Energy Conservation) and REN (Renewable Energy Scenarios), energy demand data used, energy supply data, fuel costs, transformation data and the emission data used in LEAP.
Chapter 4 contains the results and discussions of the electricity demand and supply,
GHG emission analysis and cost analysis of the three generated scenarios; BAU, EC, and REN which were obtained from LEAP.
Chapter 5 contains the conclusion and policy recommendation of the study carried out.
1.3 Literature Review
There is extensive literature available on electricity demand and supply forecasts for Nigeria. The present challenge in the electricity sector has led to many researchers carrying out studies on how to solve the never-ending problem in the electricity sector and find alternatives in order to reduce carbon emissions. Most of the studies compare different scenarios and discuss the results obtained. A couple of the research work that were carried out on the Nigerian electricity sector are being listed below.
Sambo (2008) did energy demand projections using MAED (Model for Analysis of Energy Demand ). Demography, socio-economy and technology were used as key drivers for the four scenarios namely the Reference Scenario (7% GDP Growth), High Growth Scenario (10% GDP Growth), Optimistic Scenario I (11.5% GDP Growth) and Optimistic Scenario II (13% GDP). The study found out that 484.62 billion USD of investments is required in order to meet the demand for the Optimistic Growth Scenario.
4
Adams et al. (2011) used univariate time series model (ARIMA) to determine ten years electricity generation forecast using data between 1970 and 2009. The ARIMA model revealed that electricity generation in Nigeria would reduce further.
Pelesai and Apere (2013) did a study using annual times series data. The report suggested that demand of electricity in Nigeria is elastic and electricity companies cannot increase their revenue by increasing price.
Amlabu et al. (2013) used least squares technique to determine the electrical load demand forecast in four different regional power supplies scenarios in Nigeria. The overall result showed a continuous growth in load demand in the selected regions.
Ezennaya et al. (2014) focused on Nigeria’s electricity demand forecast from 2013-2030 using Time Series Analysis method. Electricity supply in Nigeria was found insufficient. The report recommended that about 20,000 MW of electricity has to be generated or imported.
Oyelami and Adewumi (2014) used Harvey logistic model to calculate the demand and supply of electricity in Nigeria from 2005 to 2026. It estimated that about 317.5 billion US dollars business opportunities are open for new independent power stations in Nigeria.
Emodi et al. (2015) modelled Nigeria’s energy demand and supply under four scenarios which are the reference (REF), the low carbon moderate (LCM), the low carbon advanced (LCA), and the green optimistic (GO) using Long Range Energy Alternative Planning (LEAP). They REF scenario energy demand will reach 3,075 PJ with a GHG emissions of 201.2 Million tons CO2e by 2040. The aggressive policy used in the GO scenario, would significantly reduce the energy demand to 2,249 PJ and GHG emissions 124.4 Million tons CO2e in 2040.
Adebayo (2016) used Autoregressive Integrated Moving Average (ARIMA) model to forecast electricity utilization in Nigeria, as a way to examine the situation under which the country could attain the target of being among the top 20 economies by 2020. The
5
research work found out that if the current trend of electricity consumption in Nigeria continues, Nigeria would only achieve the target of being among the top 20 economies by the year 2671.
1.4 Materials and Methods
LEAP (Long Range Energy Alternatives Planning) is an energy modelling tool used to project energy consumption, supply, GHG emissions, cost analysis in all sectors of an economy. It is being used in both the energy sector and non-energy sector. LEAP in this study was used to match electricity demand with supply in Nigeria and data from agencies and organisations such as the World Bank (World Bank Development Indicators), National Population Commission, National Bureau of Statistics, International Energy Agency, Central Bank of Nigeria Statistical Bulletin, National Renewable Energy, and Efficiency Policy Report (NREEEP, 2015), The Renewable Energy Master Plan (REMP, 2013) and Sustainable Policy for All Action Agenda (SE4LL-AA, 2016). The data includes information about renewable energy and energy efficiency targets, projected population growth, GDP, government electricity demand and supply projection and emission factors.
The major source of information is from government agency websites, and studies completed by various researchers residing within Nigeria and abroad.
6 Chapter 2
Overview of the Energy Sector and Electricity Infrastructure in Nigeria
2.1 Primary Energy Supply and Consumption Situation in Nigeria
Nigeria is among the biggest players in the oil and gas industry in Africa. It has the second largest natural gas reserves behind Algeria with a proven oil reserve estimated to be at 36.2 billion barrels and a gas reserve of 166 trillion SCF (ECN, 2007). Nigeria’s oil and gas reserves are located in the south-south and south-eastern parts of the country. Studies have also been carried out in the in the Chad basin, which is in the north-eastern part of the country to determine the possibility of oil exploration in that region. The hydroelectricity potential of Nigeria is in excess of 11,000 MW (Ismaila, 2006). Biomass is abundantly available in Nigeria and is the most used energy resource especially in the rural areas.
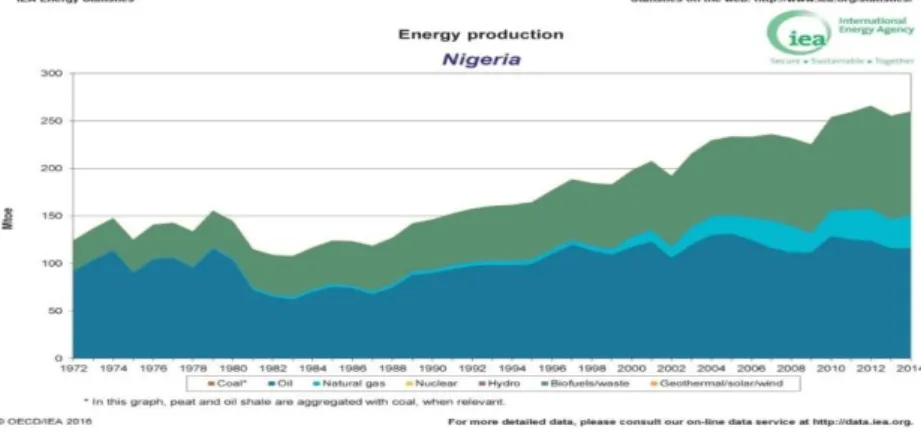
Crude oil has been the most explored energy source in Nigeria since the 1970’s. However, natural gas production grows at the highest pace compared to other primary energy sources. Figure 2 shows the energy production in Nigeria which is released by the US Energy Information Administration (EIA). It highlighted Nigeria’s heavy reliance on fossil fuels for meeting the Nigerian energy requirements (EIA, 2016). There is a clear reliance on fossil fuels in for secondary energy provision. Sectors such as transportation, electricity generation, and residential use, contribute to the growth and heavy reliance on crude oil.
7 2.1.2 Energy Resources and Reserves
Nigeria has vast energy resources ranging from fossil fuels (oil, natural gas, coal), to renewables (hydro, solar, wind, biomass). Each energy resource is explained in detail below:
2.1.2.1. Oil
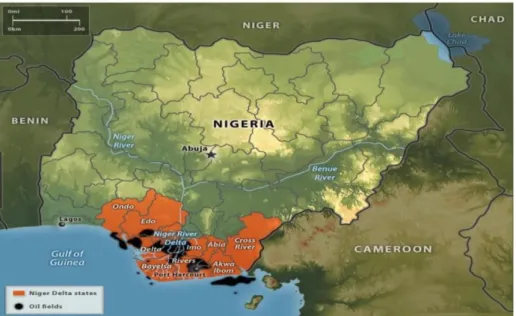
Nigeria has the second largest oil reserves in Africa after Libya, estimated at about 37 billion barrels (CIA, 2016). The oil reserves as shown in Figure 3 are located in the south-south states such as Akwa Ibom, Rivers, Bayelsa, Cross River, Ondo, Edo, and in Abia and Imo in the south-east.
Nigeria’s average oil production was at an average of 2.28 million barrels as of 2015 (EIA, 2015), but by May of 2016 attacks on the oil infrastructure led to a massive decrease in production, as crude oil production fell below 1 million barrels (CNN, 2016). Foreign oil companies are those usually involved in the oil exploration in Nigeria based on a production-sharing contract agreement with the Nigerian National Petroleum Corporation (NNPC).
Nigeria has four oil refineries in which two are located in Portharcourt, one in Warri, and the other one in Kaduna, which have a total installed capacity of 445,000 barrels per day (NNPC, 2016). None of these refineries has been functional to its optimum capacity over the years due to poor maintenance, theft and fire. Due to technical issues with the refineries, the NNPC spends millions of dollars daily to import petroleum products.
8
Figure 3: Niger Delta States and Oil Fields
2.1.2.2. Coal
Coal was discovered in the eastern part of Nigeria, and exploration commenced in the 1910’s. Presently, Nigeria’s proven coal reserves are at about 1.5 billion metric tons to 2.75 billion metric tons (Akubo et al., 2013). The location of the existing coalmines in Nigeria are shown in Figure 4 below; mines in the state of Enugu, Kogi, and the Owukpa mine in Benue state. The Nigerian Coal Corporation (NCC) in charge of the exploration and development of the coal resources was developed in 1950. Coal production peaked to 905,000 tons between 1958-1959, which attributed to more than 70 percent of Nigeria’s energy consumption. Rise in the coal production led to the development of several companies such as the Nigerian railways, Electricity Corporation of Nigeria, and the Nigeria Cement Company which were fully functional up until the late 1960s.
However, during Nigerian Civil War (1966–1970), all the coalmines were abandoned and there was no coal production. As of 2001, coal’s share of Nigeria’s total energy consumption was close to zero (Oramah, 2006).
9
Figure 4:Coal and Lignite Occurrences in Nigeria
2.1.2.3. Natural Gas
Nigeria has an estimated proven natural gas reserve of 159 trillion cubic feet (TCF), which ranks Nigeria among the top ten countries with the largest gas reserves in the world. Because of inadequate infrastructure in the gas sector, Nigeria flares about 40% of the natural gas it has produced, and re-injects another 12% to enable oil recovery (NNPC, 2016). Natural gas is the most used energy source for electricity generation in Nigeria. The thermal power plants for electricity generation in Nigeria completely run on natural gas, which makes natural gas a very important energy source.
2.1.2.4. Uranium
Uranium deposits mainly come from sandstones, quartz-pebble conglomerates, caicrete, shales and phosphates. The sandstone is the richest and is available in Nigeria (Obaje, 2013). The sandstone is mainly found in areas of Sokoto, Benue and other middle Niger basins parts. Uranium deposits in Nigeria are also found in other parts of the country such as Kano, Kaduna, Adamawa and Gombe states (Adekanmi et al., 2007).
2.1.2.5. Biomass/Biofuels
Biomass is a renewable energy source that is obtained from various sources such as agricultural crops and their residues, forestry resources, municipal and animal waste.
10
Nigeria has abundance of biomass resources estimated to be at about 80 million cubic meters (43.4 x 10⁹ kg), majorly used for cooking in Nigeria (Enibeand Odukwe, 1990). Because of Nigeria’s vast land mass it has the capacity to be a major biomass supplier to the world. Nigeria has large quantities of animal and poultry waste, estimated at 227,500 tons which when converted into energy (Biogas) will amount to 2.2x10⁹ MJ, this can then be used for cooking and electricity generation (Oyedepo, 2014).
2.1.2.6. Renewable Energy
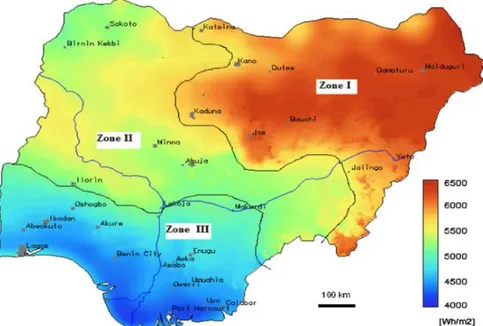
Renewable energy is the energy source that replenishes itself such as hydro, solar, biomass, wind, tidal, and geothermal. Solar radiation is the largest renewable energy resource on earth, and it is estimated that countries which are between latitudes 35oN and 35oS receive at least 200 hours of uninterrupted direct radiation per year which is sufficient for the utilization of solar energy (Abdulrahim, 2010). Nigeria fortunately lies between latitudes 4°N and 14°N of the equator which is ideal for harnessing the energy from the sun. Nigeria receives an average solar radiation of about 7.0 kWh/m2 daily in the north, and about 3.5 kWh/m2 daily in the southern part as shown in Figure 5 (Ileoje, 1997).
11
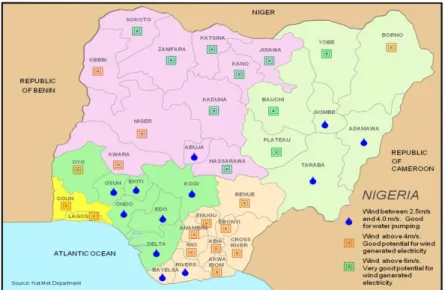
Nigeria has abundance of wind energy potential over most parts of the country. Figure 6 shows the wind distribution in Nigeria (Ajayi, 2010). Wind speeds attain average speeds of 2.0 m/s in coastal regions and 4.0 m/s in the northern part of the country. This clearly shows that wind speeds in the southern parts of the country are pretty low, however it can be harnessed for electricity generation using smaller wind turbines. Employing this strategy will be a major breakthrough for places which don’t have access to electricity. Based on the wind energy mapping developed by the Federal Ministry of Science and Technology, the highest wind speeds are in the Sokoto region, Gembu, Kano and the Jos Plateau. There’s also fair wind speeds in Maiduguri, Lagos and Enugu, sufficient for energy generation by wind farms. Other parts with high wind energy potential Lagos Region and the Mambila Plateau. Wind energy has been utilized for various applications other than electricity generation such as grain grinding and water pumping since the 1960’s (Chel and Kaushik, 2011).
Figure 6: Nigeria’s Wind Distribution (Nat Met Department)
Nigeria’s ministry of power classifies hydropower plants into large and small hydro power plants. Hydro power plants that generate less than 30 MW are generally classified as small hydro power plants. On other hand, hydro power plants that generate more than 30 MW/100 MW are classified as large hydropower plants Hydro power plants (FMP, 2015). Hydro power plants account for about 32 % of Nigeria’s electricity generation (Sambo, 2005). The majority of hydropower plants in Nigeria
12
are located in the states of Taraba, Niger, Benue, Kogi, Anambra as shown in Figure 7 below:
Figure 7: Hydro power plants in Nigeria (Federal Ministry of Power’s website)
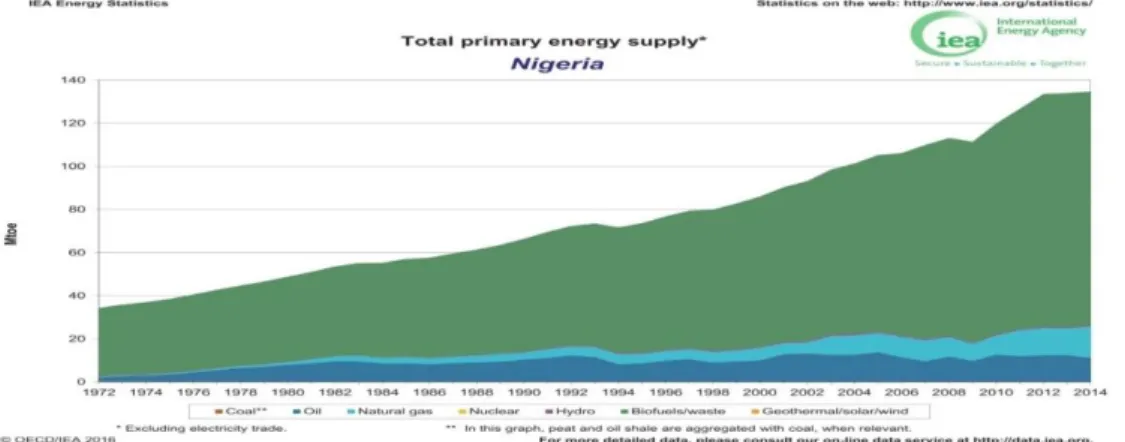
2.1.3 Primary Energy Supplies
Figure 8 shows that from 1972-2014 there is more dependence on biofuels/waste which has risen to a level of 120-140 Mtoe, while oil and natural gas has been constant, in spite of more exploration in the oil and natural gas sector (IEA, 2016). Seemingly, inadequate infrastructure for refining oil and transportation facilities for the natural gas are the major factors. This makes biomass the most attractive energy source in Nigeria followed by natural gas, oil, and then hydro as illustrated in Figure 9 (IEA, 2016).
13
Figure 9: Nigeria’s Total Energy Supply (IEA, 2013)
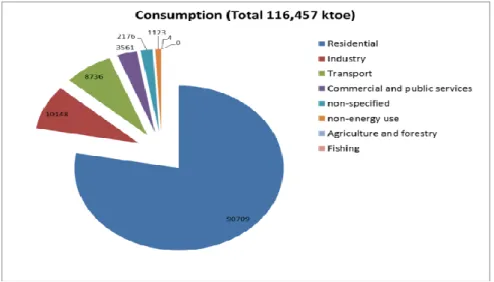
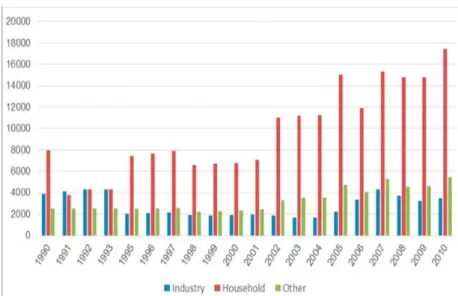
2.1.4 Final Energy Consumption
Nigeria’s energy consumption is estimated at 116,457 ktoe, the residential sector accounts for the majority of the energy consumed. Figure 10 below shows the electricity consumption for the different sectors. Figure 11 shows the share of electricity consumption between household, industry and the other sectors from 1990 to 2010, in which that household has the highest share.
14
Figure 11: Energy Consumption from 1990-2010 (UN Stats)
2.2 Overview of the Nigerian Electricity Sector
The first power plant in Nigeria was located in Lagos state in 1898, which had a total capacity of 60 kilowatts (M. Dada, 2016). Then in 1950, a central body was established to take up the responsibility of the electricity supply outlets in Nigeria. The central body was referred to as Electricity Corporation of Nigeria (ECN). In 1962, Niger Dams Authority (NDA) was established and was in charge of dam construction which led to projects such as the Kainji Dam in 1968. In 1972, ECN and NDA were merged to form National Electric Power Authority (NEPA). From 1999-2005 PHCN was formed by the government to revive the power sector, with the introduction of the National Integrated Power Projects (NIPP) in 2004 to enable the quick upgrading of the electrical infrastructure in Nigeria. The PHCN was subsequently unbundled into 18 companies, which consist of six generating companies, one transmission company and eleven (11) distribution companies (Awosope, 2014).
2.2.1 Electricity Generation in Nigeria
The Nigerian Electricity Supply Industry (NESI) was formed due to the disaggregation of the power sector, which has 23 grid-connected power plants with a total installed capacity of 10,396 MWMW and an available capacity of 6056 MW (Vincent and Yusuf, 2014).The three major Hydropower plants have an installed capacity of 1938
15
MW and an available capacity of with 1060 MW, with Figure 12 showing the various electricity generation sites in Nigeria.
Figure 12: Electricity Generation Sites in Nigeria (Nigeria Power Guide Vol. 3)
The power plants are mostly gas powered due to Government’s focus on thermal plants because of their high efficiencies. Nigeria set targets to increase the generation capacities of the gas power plants and hydropower and also aims to include other electricity generation sources such as nuclear and coal to its generation mix, which will reduce its dependence on natural gas.
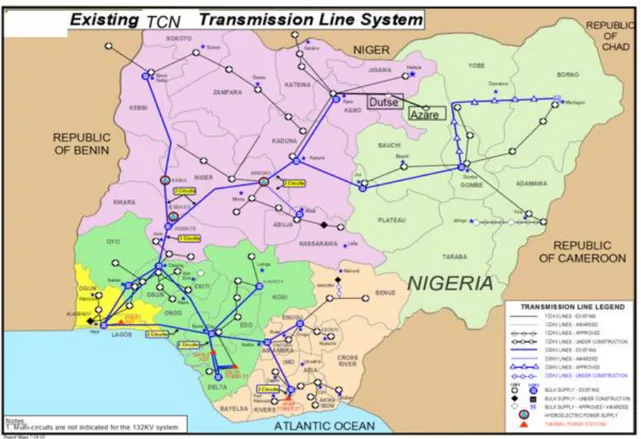
2.2.2 Electricity Transmission in Nigeria
The Transmission Company of Nigeria (TCN) is the only part of the power value chain which is completely owned by the Federal Republic of Nigeria and emerged from the unbundling of the National Electric Power Authority (NEPA) in 2005. Transmission Company of Nigeria manages the operation, maintenance, and the expansion of the 132kV and 330kV transmission system. The transmission network shown in Figure 13 is made up of 159 substations and 15,022km of transmission lines with a capacity of 5300MW but far less than the total installed capacity of 12,522MW (Nigerian Power Report). Transmission losses are high compared to the benchmark of 2-6% set by
16
developing countries, the losses are because of the challenges faced by the infrastructure and operation. The ineffective management of the infrastructure and operations of the transmission lines have led power shortages across the country.
Figure 13: Transmission Line of Nigeria (Nigeria System Operator)
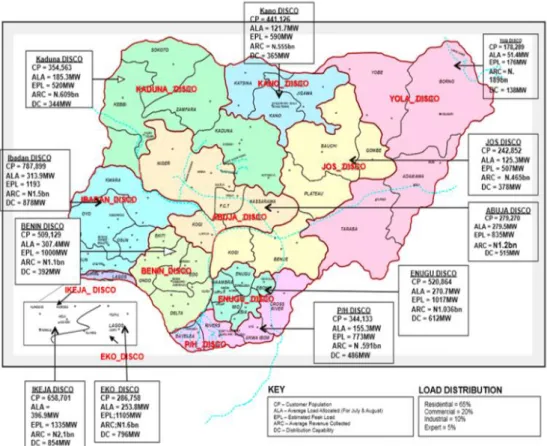
2.2.3 Electricity Distribution in Nigeria
The grid line operates medium and low voltages (33kV and 11kV, respectively), there were more than 24000 km distribution network in 2010 (NERC, 2011). Figure 14 shows the distribution companies and the amount of electricity allocated to them. There are 11 electricity distribution companies (DISCOS) which are in charge of the distribution of electricity in Nigeria. Ikeja Electricity Distribution Company is the largest which covers 36,585 km, Kano on the other hand is the shortest which covers 7,404 km and has the highest losses of 40%. Ibadan network has the highest capacity of 878 MW with 812,000 customers, while the Ikeja network has the highest peak demand of 1,400 MW due to the high demand of electricity by companies in that particular location (Shonibare, 2014).
17
18 Chapter 3
Methodology
This chapter consists of the methodology used for the electricity supply and demand, GHG emissions and cost analysis projections for Nigeria from 2010 to 2040. A base year of 2010 was chosen for this study based on the availability of data.
3.1 The LEAP Model
The Long Range Energy Alternatives Planning (LEAP) energy model was developed by the Stockholm Environment Institute to analyse energy policies and to assess GHG emissions (Heaps, 2012). A major advantage of LEAP is its low data requirements and is based on physical energy and ecological policies. LEAP has been used by individual researchers and organisations to project future energy supplies, consumptions and GHG emissions to enable them formulate energy polices.
3.2 LEAP Algorithm
The framework used by LEAP for the calculation of energy consumption and carbon emissions as according to (Feng and Zang, 2012) is presented as follows:
3.2.1 Energy Consumption
The total final energy consumed is calculated using the following equation: 𝐸𝐶𝑛 = ∑ ∑ 𝐴𝐿𝑛,𝑗,𝑖×𝐸𝐼𝑛,𝑗,𝑖
𝑗 𝑖
EC is the aggregate energy for a given sector, AL represents activity level, EI is the
energy intensity, n is fuel type, i is sector, and j is the device.
Transformation of net energy consumption is calculated using the following equation: 𝐸𝑇𝑠 = ∑ ∑ 𝐸𝑇𝑃𝑡,𝑚× ( 1
𝑓𝑡,𝑚,𝑠− 1)
𝑡 𝑚
ET is the transformation net energy consumption, ETP being the net energy transformation product, f is the energy transformation efficiency, s is the type of primary energy, m is equipment, and t the type of secondary energy.
19 3.2.2 Carbon Emission
Carbon emission of the final energy is calculated using the following equation: 𝐶𝐸𝐶 = ∑ ∑ ∑ 𝐴𝐿𝑛,𝑗,𝑖×𝐸𝐼𝑛,𝑗,𝑖×𝐸𝐹𝑛,𝑗,𝑖
𝑛 𝑗 𝑖
Whereby CEC stands for carbon emission, AL is activity level, EI is energy intensity,
𝐸𝐹𝑛,𝑗,𝑖 is carbon emission factor, n is for equipment j from sector i
Then the carbon emission of energy transformation is obtained using the following equation: 𝐶𝐸𝑇 = ∑ ∑ ∑ 𝐸𝑇𝑃×𝑓1 𝑡,𝑚,𝑠 𝑡 𝑚 𝑠 ×𝐸𝐹𝑡,𝑚,𝑠\
CET is the carbon emission, ETP energy transformation project, f is energy
transformation efficiency, 𝐸𝐹𝑡,𝑚,𝑠 is emission factor from primary fuel type s for producing fuel type j through equipment m.
3.2.3 Costs
Costs are calculated using the following equation (Webmeets, 2015): 𝐶 = ∑ ∑ {⌊∑(𝑒𝑛,𝑗,𝑘×𝑒𝑝𝑛) + ∑(𝑚𝑘,𝑗,𝑖×𝑚𝑝𝑘+ 𝑓𝑐𝑗,𝑖) 𝑘 𝑛 ⌋ 𝑝𝑖,𝑗} 𝑗 𝑖
C is the total cost, 𝑒𝑝𝑛 is unit price of fuel type n, 𝑚𝑘,𝑗,𝑖 is demand for material k per unit of production used in equipment j within production process I, 𝑚𝑝𝑘 unit of material k and 𝑓𝑐𝑗,𝑖 fixed cost per unit production through equipment j.
3.3 Nigeria’s LEAP Tree Diagram
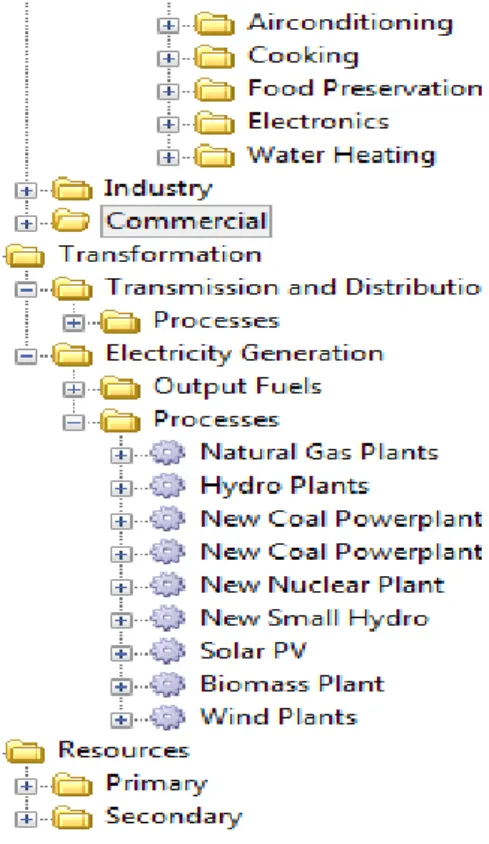
The Nigerian LEAP tree diagram is made up of two branches namely the demand and supply branch as shown in Figure 15. The demand branch is made up of the household sector which is divided into urban and rural, with final energy end users such as electricity, refrigeration, air conditioning, electronics, food preservation, and water heating. The demand branch also includes the commercial and industrial sector (Emodi et al., 2016). The supply branch is made up of existing power generation plants such as hydro and nuclear, with future additions like nuclear, small hydro, biomass, wind, and small hydro.
20
The model diagram used for forecasting Nigeria’s electricity consumption, supply, predicting GHG emission, and cost analysis is shown in Figure 16.
Figure 16: Nigeria’s energy system model diagram for forecasting and transformation Figure 15: Nigeria’s LEAP Tree Diagram
21 3.4 Load Duration Curve
A very important factor considered for the simulation of the electricity supply is the Load Duration Curve (LDC). Demand for electricity is not constant, for instance in the morning there would be higher electricity demand when compared to the afternoon when everybody is at work and school, during the hot season (summer) in Nigeria electricity demand would significantly increase because of more usage of air conditioners and refrigerators because of excessive heat. This clearly shows how demand clearly varies on a day-to-day basis. This made LDC very important on how to determine the operating schedule of the power plants to choose between the base and peak load power plants. The LDCs are produced by Transmission Company of Nigeria, which uses hourly electricity generation data as shown in Figure 17. The time slices where divided into nine. Then, the percentages of the electricity consumption of the time slices used in LEAP as shown in Figure 18. were obtained by taking the percentage of the ratio of the electricity consumption of the second time slice to the ratio of the maximum electricity consumption in which 93.8 was obtained for the first time slice. The same procedure was carried out for the remaining time slices.
22
Figure 18: Peak load shape used in LEAP
3.5 Data collection and Scenario Design
The three scenarios developed in this study were based on the Federal Government of Nigeria’s initiative on energy conservation and renewable energy. Documents such as the National Renewable Energy and Energy Efficiency Policy (NREEP), Sustainable for All Action Agenda (SE4ALL-AA) and the Nigerian Renewable Energy Master Plan (REMP) were all used to formulate the three scenarios namely; BAU (Business-as-usual), EC (energy conservation), and REN (renewable energy). A brief information about these energy policy documents are given in the following sections.
3.5.1 National Renewable Energy and Energy Efficiency Policy (NREEP, 2015) The main reason behind the NREEP report (2015) was to optimize the utilization of the national natural resources in order to achieve a sustainable level of growth. The report was approved by Nigeria’s Federal Executive Council (FEC) in 2015 to ensure the following issues:
i. To develop a framework that will address Nigeria’s challenge in accessing renewable energy that will lead to improved energy security and meet the climate objectives.
23
ii. To increase Nigeria’s level of electricity generated from renewables to meet or even exceed the target set by ECOWAS (Economic Community of West African State).
iii. To enlighten the public about energy efficiency that if embraced will lead to savings on energy bills and provide employment.
iv. To set national targets in energy efficiency and renewable energy.
v. To facilitate a framework for financing renewable and energy efficiency projects in Nigeria.
vi. To set a time frame in which these projects in renewable and energy efficiency projects will be completed.
vii. To make it mandatory for the Ministry of Energy to supervise the ongoing projects.
3.5.1.1 Renewable Energy Targets Set by (NREEP, 2015)
The following are targets set by (NREEP, 2015) for power generation from biomass, solar, small hydro, and wind:
• The capacity of small hydro power plants to attain 8173.81 MW by 2030 • The capacity of biomass power plants to attain 3211.4 MW by 2030 • The capacity of wind power plants to attain 291.92 MW by 2030.
3.5.2 The Renewable Energy Master Plan (REMP, 2013)
The Renewable Energy Master Plan (REMP, 2013) a document developed by Nigeria’s Federal Ministry of Environment targets to increase the supply of electricity from renewable energy sources with solar PV to attain 500 MW 2025. The REMP is set also setup to provide incentives to support renewable energy. The plan will reduce duties on renewable energy technologies being imported. It will also provide tax credits, capital incentives and loans for new renewable energy projects.
24
3.5.3 Sustainable Energy for All Action Agenda (SE4ALL-AA, 2016) Adopted by (Inter-Ministerial Committee on Renewable Energy and Energy Efficiency ICREEE)
The (SE4ALL-AA, 2016) initiative has set objectives in providing safe, renewable and affordable energy for both renewable and non-renewable energy sources. It has three goals which are Energy Access, Energy Efficiency, and Renewable Energy that have the following objectives being listed below:
Energy Access Targets:
• Increase energy access in urban areas to 90 percent by 2030 • Increase energy access in rural areas to 60 percent by 2030
Energy Efficiency Targets:
• Efficient lighting will be used by 40 percent of the household by 2020 and almost 100 percent by 2030.
• High energy consuming devices efficiency will be atleast to 20 percent by 2020 and 50 percent by 2030.
Renewable Energy Targets:
• To achieve atleast 30 percent of renewables in the electricity generation mix by 2030.
• Inclusion of renewable energy technologies such solar, wind, biomass and a 1200 MW of nuclear by 2025 into the energy mix.
3.6 Data Used in LEAP
3.6.1 Demographic and Economic Data
The demographic and economic data includes GDP, population, population growth rate, income, income growth rate, and urbanisation. The data was obtained from sources such as World Development Indicators (WDI), International Energy Agency (IEA), Central Bank of Nigeria (CBN), and the National Bureau of Statistics of
25
Nigeria. Table 1 shows the demographic and economic data used in LEAP for the base year 2010.
Table 1: Demographic and Economic data used in LEAP
3.6.2 Energy Demand Data Used in LEAP
Final energy intensities of various electrical appliances in the demand branch of LEAP were obtained from (Emodi, 2016) and that for the efficient end users were obtained from (Almeida et al., 2011) are shown in Table 2. Final energy intensities for the commercial and industrial sectors were obtained using the ratio of the annual energy consumed of each sector to its value added (Heap, 2015). The value added by the commercial and industrial sectors are 196.44 billion USD and 80 billion USD respectively (WDI, 2010). On the other hand, electricity consumed by commercial and industrial sectors are 469 thousand KTOE and 279 thousand KTOE respectively (IEA, 2015).
Type of Data Used Value of Data in 2010
Income 1,460 thousand USD
Population 159.4 million people
Household Size 5 people
Households 32 million households
GDP 367.128 billion USD
Income Growth Rate 8.6%
Population Growth 2.55%
26 Table 2: Electricity Demand Data
3.6.3 Emission Data Used in LEAP
LEAP has a Technological Environmental Database (TED), which has data from Assessments Reports of Intergovernmental Panel on Climate Change (IPCC), International Energy Agency (IEA), US Department of Energy (DOE) and from dozens of other institutions. Tier 1defaults from AR2 factors from 1996 where used in carrying out this study because they still remain the industry standard.
For the study carried out, only the GHG emissions in the electricity generation process were considered. This is due to the fact that the LEAP energy modelling tool does not consider GHG emissions at the cultivation, fabrication, construction and decommissioning stages of the energy supply and consumption process. Even the renewable energy technologies which are considered carbon free emit GHG at various stages of their life cycle. For instance, during the production of renewable energy technologies GHG’s are being released to the atmosphere and the amount of emissions differs by the location at which the renewable energy technology is produced. Renewable energy technologies that are produced in Germany would result in less emissions than those that are produced in China. This is because China mainly uses coal for electricity production whereby Germany generates its electricity majorly from natural gas and nuclear. Therefore for a more detailed study, emissions as a result of
Electric Appliance Final Energy Intensity Efficient Final Energy Intensity Owned by households (%) Lighting 506.28 kWh 182 kWh 100 Refrigeration 402.01 kWh 180 kWh 87 Air-conditioning 191.04 kWh 40 kWh 47 Cooking 46.44 kWh 15 kWh - Food Preservation 47.64 kWh 32 kWh 42 Electronics 395.04 kWh 260 kWh 90 Water Heating 0.6 kWh 0.6 kWh 70
27
cultivation, transportation, manufacturing and decomposition should be considered so as to have a clearer picture of the GHG emission situation in Nigeria.
3.6.4 Transformation Data
Electricity generation data from the existing power plants such as hydro and natural gas and as well as future power plants like small hydro, solar, biomass, nuclear and, wind are given in Tables 3-5.
In these tables merit order indicates the order in which power plants were dispatched. Power plants that have the lowest merit order were dispatched first (base load) and those with the highest merit were dispatched last (peak load). A value of 1 was set to baseload power plants and a merit order of 2 was used for peak power plants. In carrying out this study the merit order of the power plants was ranked based on ascending order of price, this will result in an economically ideal power supply (Next, 2017). The wind, solar, biomass, nuclear and coal power plants, which produce electricity at very low prices, are switched first to supply electricity. Afterwards, the natural gas power plants which have higher marginal costs are increased subsequently until the demand is met. Exogenous capacity refers to the existing capacity added or retired of the power plants. Endogenous capacity is the capacity of the power plants to be introduced. Maximum availability is the ratio of the maximum energy that is produced to what would have been produced if the power plants ran at full capacity for a given period and is expressed in percentage. Process efficiency is defined as the percentage ratio of energy output to feedstock energy input was set in the system.
The data was obtained from the following sources such as Power Holding Company of Nigeria (PHCN, 2010), National Control Centre (NCC, 2010), Projected Costs of Electricity (IEA, 2010), Economic Outlook, Volume 2010 Issue 1 - Statistics (OECD 1, 2010), Updated Capital Costs for Utility Scale Electricity Generating Plants (EIA, 2013). Energy Policies for Sustainable Development Strategies (Emodi, n.d.), and Cost and Performance Data for Power Generation Technologies from the National Renewable Energy Laboratory (NREL, 2012).
28
Table 3: Electricity Generation Data for Existing Power Plants
Table 4: Electricity Generation Data for Future Power Plants
Table 5: Costs of the Electricity Generating Technologies
3.6.5 Fuel Costs
The fuel prices used in LEAP were obtained from the Projected Costs of Generating Electricity which is a report made by IEA and the OECD Nuclear Energy Agency
Power Plant Exogenous Capacity (MW) Historical Production (MWh) Maximum Availability (%) Process Efficiency (%) Merit Order Natural Gas 3,517 17,360,102.31 95 58 2 Hydro 1,308 6,415848 69 59 1
Power Plant Maximum Availability
(%) Process Efficiency (%) Merit Order New Coal 1000 MW 80 42 1 New Coal 500MW 80 42 1 New Nuclear 90 36 1
New Small Hydro 60 60 1
Solar PV 42 15 1
Biomass 83 80 1
Wind 43 27 1
Power Plant Capital ($/MW) Variable O&M ($/KW) Fixed O&M ($/KW)
Natural Gas 1230 0.00367 6.31 Hydro 3500 0 15 New Coal 1000 MW 2890 0.00371 62.3 New Coal 500MW 2890 0.00371 62.3 New Nuclear 5530 0.00214 93.28 New Small Hydro 2500 0 53 Solar PV 5950 0 50 Biomass 3830 0.0015 95 Wind 2077 0 25.4
29
(NEA), (IEA, 2010). Table 6 consists of the costs of the different fuels used. Costs for hydro, solar, wind and biomass to an extent are virtually free.
Table 6: Fuel costs
3.7 BAU, EC, and REN Scenarios Design
The design of BAU, EC, and REN Scenarios are explained in detail this section. These scenarios were developed based on the Federal Government of Nigeria’s polices towards the expansion of existing power supply, energy conservation and renewable energy.
3.7.1 BAU Scenario
The BAU scenario was developed based on the path that electricity demand and supply polices will continue in the future in the same way they were in the past. All the variables and parameters are assumed to follow the past trend. This includes efficiencies, generation technologies as well as transmission and distribution losses. In the BAU scenario, demographic and economic data used consists of a population growth at 2.55 percent, income growth at 8.6 percent, share of urban population at 50 percent by 2040. Electricity access in the urban areas will increase to 90 percent by 2030 from 79.8 percent while that in the rural areas will attain 60 percent in 2030 from 34.9 percent. In the BAU scenario, there would be the addition of nuclear power plants with a capacity of 1200 MW by 2025, two 1000MW and 500MW coal power plants will be introduced in 2014 and 2015 respectively. The current hydro and gas power plants will be expanded to a capacity of 13000 MW and 9000 MW by 2040 respectively. Transmission and distribution losses will remain at 17 percent.
3.7.2 EC Scenario
Energy conservation is very important because energy consumption and the need for power generation expansion are significantly reduced. The EC scenario was
Fuel Type Cost
Coal Bituminous 14.63 $/Metric Tonne
Natural Gas 3.6 $/Gigajoule
30
formulated from energy conservation documents such as NREEP, SE4ALL-AA, and REMP. This scenario shows us how electricity demand and supply will evolve in the future if energy efficiency measures as stipulated by the documents mentioned above are implemented. The following information was used to develop the EC scenario:
• Usage of efficient lighting will attain 40 percent by 2020 and 100 percent by 2040. • Efficiency of energy intensive technologies will reach to 20 percent by 2020 and
to 50 percent by 2030.
• Transmission and distribution losses will be reduced from 17 percent in 2010 to below 10 percent by 2030 (8 percent is chosen).
3.7.3 REN Scenario
As stated earlier, Nigeria has abundant renewable energy resources such as solar, wind, hydro, and biomass. Therefore, taking advantage of these available resources for electricity generation is a priority for the Nigerian government in terms of energy security and reduction in GHG emissions.
The REN scenario is made up of introduction of renewable power plants and no new gas power plants in future. NREEP and REMP were used in developing scenarios with the following technologies listed below:
• Hydro power plants will attain 9000 MW by 2040
• Small hydro power plants will grow to 8173.81 MW by 2030 • Solar PV will attain 6831 MW by 2030
• Introduction of 1200 MW nuclear power plant in 2025 • Biomass will attain 292 MW by 2030
31 Chapter 4
Results and Discussions
This chapter outlines the results of the LEAP simulations for the three scenarios explained above (BAU, REN, EC). Electricity supply and demand, cost analysis and their emission results corresponding to these scenarios are investigated in detail in this chapter.
4.1 Electricity Demand Projections
The electricity demand of the three scenarios were projected from the base year of 2010 to the target year 2040. Electricity demand in the three scenarios has continuously increased up until 2040 as depicted in Appendix A1-A2. This is attributed to increase in population, urbanization, income growth rate and increase in GDP. Electricity demand in the BAU and REN scenarios increased from 35.9 billion kWh in 2010 to 283.6 billion kWh by 2040 as shown in Fig 19. On the other hand, electricity demand in EC scenario increased from 35.9 billion kWh in 2010 to 233.8 billion kWh as given in Figure 20. Figure 21 compares the electricity demand of the three different scenarios; BAU, EC, and REN.
32
Figure 20: Energy Conservation Electricity Demand Projection for Each Sector.
Figure 21: Electricity Demand projection for BAU, EC, and REN scenarios
From the electricity demand in the BAU and REN scenarios, we see that urban households have the highest share of electricity demand in the base year 2010, with a total electricity demand of 17.4 billion kWh while rural constitutes 9.9 billion kWh
33
(Figure 19). The majority of the electricity demand in the urban households comes from lighting which accounts for 6.6 billion kWh in the base year, 2010. Other high electricity demand sectors are refrigeration (4.5 billion kWh), rural lighting (3.7 billion kWh) and rural refrigeration (2.5 billion kWh). Electricity consumption in the commercial and industrial sectors are 5.5 billion kWh and 3.2 billion kWh respectively. The electricity demand increased to 283.6 billion kWh in 2040, with the urban electricity demand constituting 75.3 billion kWh, lighting constituting 28.3 billion kWh. Demand for lighting in the rural areas increased to 9.7 billion kWh as well. Electricity demand in industrial and commercial sectors massively increased to 18.6 billion kWh and 163.4 billion kWh, respectively.
The demand for electricity in the EC scenario considerably reduced because of the energy efficiency measures taken as well as the reduction of transmission and distribution losses. By 2040, the electricity demand for the EC is 233.8 billion kWh which is a 49.8 billion kWh saving compared to BAU or REN scenarios. The urban household electricity demand is reduced to 59.3 billion kWh under the EC scenario, electricity demand of the rural areas is 28.9 billion kWh, industry is 14.9 billion kWh, and commercial is 130.7 billion kWh. The commercial sector takes the largest share of electricity demand at 55.9 %, subsequently followed by urban house 25.4 %, rural household 12.3 %, and industry 6.4 % as given in Figure 22. The introduction of energy efficient technologies reduced the electricity demand for lighting to 10.2 billion kWh in the urban households but will be overtaken by electronics whose electricity demand will be 26.4 billion kWh. Even though the lighting in rural areas has been reduced, it takes up the largest share of the electricity demand in the rural areas in 2040 (11.5 billion kWh).
34
Figure 22: EC electricity demand share by 2040
4.2 Electricity Supply Projections
The power supply in base year of 2010 is made up of gas and hydro power plants only. The electricity supply in the base year stands at 23.8 billion kWh which does not meet the required electricity demand in the base year. This shortage is the reason behind power outages in Nigeria. But with the introduction of new power plants and expansion of the existing ones as formulated in the BAU, EC and REN scenario the electricity supply will match the electricity demand as highlighted in the coming sections.
4.2.1 BAU Electricity Supply
Electricity supply in 2010 for BAU is 23.8 billion kWh, which is made up of electricity supply from hydro and natural gas power plants. As given in Appendix B1, natural gas power plants supplied 17.4 billion kWh and hydro power plants supplied 6.4 billion kWh. Electricity supply in the BAU scenario increased from 23.8 billion kWh to 341.7 billion in 2040 as shown in Figure 23. The Sankey diagram shows the energy flow process in 2040 (Figure 24). In 2025, with the addition of other electricity supply technologies such as coal power plants, the expansion of the existing hydro and natural gas power plants and new nuclear power plants, the electricity supply attained 114.7 billion kWh. By 2040 electricity supply mix for the BAU is made up of nuclear power plants which supplied 139 billion kWh, the new 1000 MW coal power plant supplied 102.9 billion kWh, the new 500 MW coal power plant supplied 51.5 billion kWh and
35
natural gas power plants supplied 2 billion kWh. In 2040, the share of power supply from nuclear is 40.7%, from 1000 MW coal power plant is 30.1 %, from natural gas plants is 0.6 % and from the 500 MW coal power plant is 15.1 % as given in Figure 25.
Figure 23: BAU Electricity Supply
36
Figure 25: BAU Electricity Supply Mix in 2040
4.2.2 REN Electricity Supply
Electricity supply in the REN scenario increased from 23.8 billion kWh to 336.1 billion in 2040 as given in Figure 26. The Sankey diagram shows the energy flow process in Figure 27. Starting from 2025, the electricity supply mix contained all the electricity supply technologies such as small hydro power plants, biomass power plants, solar PV, nuclear power plants, wind power plants, hydro power plants. The capacity of the natural gas power plants was not increased in the REN scenario. By 2040 as given in Appendix B2, the electricity supply mix for the REN scenario is made up of new small hydro power plants which supply 114 billion kWh, the new nuclear power plant which supplies 77.6 billion kWh, the solar PV plant supplies 53.5 billion kWh, wind power plants supplied 31.3 billion kWh, biomass power plants supplied 5.2 billion kWh, natural gas power plants supplied 2.8 billion kWh, and hydro supplied 51.7 billion kWh. In 2040, the supply from small hydro power plants reached 33.9 % of the electricity mix, nuclear is 23.1 %, solar PV plants are 15.9 %, wind power plants are 9.3 %, gas power plants are 0.8 %, hydro is 15.4 %, and biomass plant is at 1.5 % as given in Figure 28.
37
Figure 26: REN Electricity Supply
38
Figure 28: REN Electricity Supply Mix
4.2.3 EC Electricity Supply
Electricity supply for the EC scenario attained 254.1 billion kWh in 2040 as given in Figure 29. The Sankey diagram shows the energy flow process for this scenario in Figure 30. This clearly shows a massive reduction in electricity supply of 87.6 billion kWh in 2040 when compared to the BAU scenario and a reduction of 82 billion kWh in 2040 when compared to the REN scenario. By 2040 as given in Appendix B3, the electricity supply mix for the EC is made up of nuclear power plants, which supply 96.2 billion kWh, the new 1000 MW power plant supply 71.3 billion kWh, the 500 MW coal power plant supply 32.9 billion kWh, natural gas power plants supply 4.3 billion kWh, and hydro power plants supply 49.4 billion kWh. In 2040, the supply from nuclear is 37.9 % of the electricity mix, the 1000 MW coal power plant is 28.1 %, natural gas plants is 1.7 %, and 500 MW coal power plant is 12.9 %, and the hydro power plant is 19.4 % as given in Figure 31.
39
Figure 29: EC Electricity Supply
40
Figure 31: EC Electricity Supply Mix
4.3 GHG Emission Analysis
The Greenhouse Gas (GHG) emissions of the BAU, EC, and REN scenarios for the study carried out are given Figure 32. GHG emissions are measured in million metric tonnes of carbon dioxide (CO2) equivalent. GHG emissions from the power generating plants in the BAU scenario increased from 6 million metric tons of CO2eq to 123.9 million metric tons of CO2eq. Carbon dioxide takes the major chunk of the GHG but there are other gasses such as methane and nitrous oxide. The rapid increment in the GHG for the BAU is due to the addition of coal power plants and expansion of the capacity of the gas power plants. The 1000 MW and 500 MW coal power plants emit the largest quantities of GHG emissions with 82.1 million metric tons of CO2eq and 41.1 million metric tons of CO2eq respectively. Natural gas power plant has the least emission when compared to the coal power plants being 0.7 million metric tons of CO2eq because natural gas has less GHG emissions than coal. The GHG emissions in the EC scenario is 84.6 million metric tons of CO2eq which is a reduction of 31.7 % amounting to 39.3 million metric tons of CO2eq compared to the BAU scenario. Reduction in GHG from the EC scenario is as a result of energy efficiency measures taken which led to reduction in electricity demand and supply. The 1000 MW coal power plant introduced is the largest contributor of the GHG emissions. Emissions grew from 11.2 million metric tons of CO2eq to 56.9 million metric tons of CO2eq
41
producing 67.2 % of GHG emissions by 2040. On the other hand, emissions from the 500 MW coal power plant reached 26.3 million metric tons of CO2eq accounting for 31 % of the GHG emissions. Natural gas power plants emit 1.5 million metric tons of CO2eq which is 1.8 % of the emissions. The natural gas power plants have the least GHG emission because natural gas has less emissions when compared to coal.
The REN scenario has the least emissions of the three scenarios: BAU, EC, and REN. The REN scenario has the least emissions because coal power plants were not included into the scenario and the capacity of natural gas power plants were not increased. Therefore, the REN scenario will have electricity supply from wind, solar, hydro, nuclear, biomass and natural gas power plants. With the exception of biomass and natural gas power plants, the remaining power plants do not emit any GHG gasses. Natural gas power plants emit the largest share of GHG amounting to 975.1 thousand metric tons of CO2eq with biomass emitting 43.8 thousand metric tons of CO2eq. The total cumulative amount of GHG emissions by REN scenario is 1,018.9 thousand metric tons of CO2eq. The cost required in reducing the GHG emissions in the REN scenario is 13.57 USD/tCO2eq. The cumulative amount of GHG emissions that would be released by the BAU scenario is 1,414.5 million tons of CO2eq, for EC is 1,004.8 million tons of CO2eq and for the REN scenario is 134.62 million tons of CO2eq.
42
Figure 32: GHG Emission of BAU, EC, and REN
4.4 Cost Analysis of BAU, EC and REN Scenarios
According to (Heap, 2015) in order to view the result of the cost analysis graphically, the costs should be viewed in terms of differences with respect to the Reference scenario (BAU).
The cumulative net present value (NPV) of the capital costs in billion USD from 2010 to 2040 of the EC and REN scenarios compared to the BAU scenario is given in Figure 33. The cumulative capital cost of the EC reached a negative 44.2 billion USD by 2040. This means that the capital cost of the EC scenario is 44.2 billion USD less than the BAU scenario in 2040 (160.2 billion USD). The REN scenario on the other hand has a positive cumulative capital cost of 56.3 billion USD, which means that the REN scenario is 56.3 billion USD more than the BAU scenario. The REN scenario is the most expensive scenario in terms of capital costs, while the EC scenario has the least capital costs. The high costs of the REN scenario are attributed to the higher capital costs of the renewable energy electricity generation power plants being introduced.
43
Figure 33: Comparison of the capital costs of the EC and REN scenarios with BAU
Figure 34 shows the cumulative (NPV) of the fixed O&M costs from 2010 to 2040 in billion USD. REN scenario has a positive NPV of 4.1 billion USD and EC has a negative NPV 15 billion USD in 2040. The REN scenario has the highest fixed O&M costs compared to EC and BAU scenarios.
Figure 34: Comparison of the Fixed O&M costs of the EC and REN scenarios with BAU
Figure 35 shows that the both REN and EC scenarios have a cumulative variable O&M cost less than that of the BAU scenario. REN scenario has a negative NPV of 789.4 million USD, EC on the other hand has negative NPV of 263 million USD as of 2040. The REN scenario has the lowest variable O&M costs mainly attributed to the fact that