AUTOMATIC PERFORMANCE EVALUATION OF
INFORMATION RETRIEVAL SYSTEMS USING
DATA FUSION
A THESIS
SUBMITTED TO THE DEPARTMENT OF COMPUTER ENGINEERING AND THE INSTITUTE OF ENGINEERING AND SCIENCE
OF BILKENT UNIVERSITY
IN PARTIAL FULFILMENT OF THE REQUIREMENTS FOR THE DEGREE OF
MASTER OF SCIENCE
By
Rabia Nuray
August, 2003
I certify that I have read this thesis and that in my opinion it is fully adequate, in scope and in quality, as a thesis for the degree of Master of Science.
____________________________
Prof. Dr. H. Altay Güvenir (Advisor)I certify that I have read this thesis and that in my opinion it is fully adequate, in scope and in quality, as a thesis for the degree of Master of Science.
____________________________
Prof. Dr. Fazlı CanI certify that I have read this thesis and that in my opinion it is fully adequate, in scope and in quality, as a thesis for the degree of Master of Science.
____________________________
Prof. Dr. Özgür UlusoyApproved for the Institute of Engineering and Science:
__________________________
Prof. Dr. Mehmet BarayDirector of the Institute
ABSTRACT
AUTOMATIC PERFORMANCE EVALUATION OF
INFORMATION RETRIEVAL SYSTEMS USING DATA
FUSION
Rabia NurayM.S. in Computer Engineering Supervisor: Prof. Dr. H. Altay Güvenir
August, 2003
The empirical investigation of the effectiveness of information retrieval systems (search engines) requires a test collection composed of a set of documents, a set of query topics and a set of relevance judgments indicating which documents are relevant to which topics. The human relevance judgments are expensive and subjective. In addition to this databases and user interests change quickly. Hence there is a great need of automatic way of evaluating the performance of search engines. Furthermore, recent studies show that differences in human relevance assessments do not affect the relative performance of information retrieval systems. Based on these observations, in this thesis, we propose and use data fusion to replace human relevance judgments and introduce an automatic evaluation method and provide its comprehensive statistical assessment with several Text Retrieval Conference (TREC) systems which shows that the method results correlates positively and significantly with the actual human based evaluations. The major contributions of this thesis are: (1) an automatic information retrieval performance evaluation method that uses data fusion algorithms for the first time in the literature, (2) system selection methods for data fusion aiming even higher correlation among automatic and human-based results, (3) several practical implications stemming from the fact that the automatic precision values are strongly correlated with those of actual information retrieval systems.
Keywords: automatic performance evaluation, data fusion, information retrieval system,
social welfare functions, system performance prediction, TREC.
ÖZET
VERİ BİRLEŞTİRME YÖNTEMLERİ KULLANARAK BİLGİ
ERİŞİM SİSTEMLERİNİN PERFORMANSININ OTOMATİK
OLARAK DEĞERLENDİRİLMESİ
Rabia NurayBilgisayar Mühendisliği, Yüksek Lisans Tez Yöneticisi: Prof. Dr. H. Altay Güvenir
Ağustos, 2003
Deneysel olarak bir bilgi erişim sisteminin (arama motorunun) etkinliğinin ölçümü belgeler, bir sorgu kümesi ve her sorguya ilişkin bir küme belgeden oluşan bir test koleksiyonu gerektirir. İnsanlar tarafından yapılan değerlendirmeleri pahalı ve özneldir. Buna ek olarak veri tabanları ve kullanıcıların ilgi alanları çok çabuk değişmektedir. Bu nedenle arama motorlarının performansını otomatik olarak değerlendirecek bir yönteme büyük gereksinim duyulmaktadır. Ayrıca son çalışmalar insan değerlendirmelerindeki faklılığın sistemlerin bağıl performansını etkilemediğini göstermiştir. Bu gözlemlere dayanarak, bu tezde veri birleştirme yöntemlerini kullanarak insan değerlendirmelerini otomatik değerlendirmeler ile değiştirmeyi öneriyor, kullanıyor, ve yeni bir yöntem sunuyoruz ve bu yöntemin birçok Text Retrieval Conference (TREC)’ de uygulamasının sonuçlarını gerçek insan değerlendirmeleri ile anlamlı ve pozitif uyuşumunu ayrıntılı gösteren istatistiksel değerlendirmelerini gösteriyoruz. Bu tezin önemli katkıları şunlardır: (1) veri birleştirme algoritmalarını literatürde ilk defa kullana bir otomatik değerlendirme yöntemi (2) özdevinimli yöntem ile insan değerlendirmeleri arasında yüksek uyuşum amaçlayan sistem seçme yöntemleri (3) önerilen bu yöntemin bulduğu duyarlık değerlerinin gerçek duyarlık değerlerine güçlü uyuşumunun olduğu gerçeğinden kaynaklanan birkaç farklı pratik faydalar ve yeniliklerdir.
Anahtar Sözcükler: otomatik performans değerlendirme, veri birleştirme, bilgi erişim sistemleri, sosyal refahlık fonksiyonları, sistem performans tahmini, TREC.
Acknowledgements
I am deeply grateful to my de facto supervisor Prof. Dr. Fazlı Can, who has guided me with his invaluable suggestions and criticisms, and encouraged me a lot in my academic life. It was a great pleasure for me to have a chance of working with him. I would like to address my special thanks to Prof. Dr. H. Altay Güvenir and Prof. Dr. Özgür Ulusoy, for their valuable comments. I would also like to thank NIST for providing the TREC data, and Dr. Ellen Voorhees for making the official TREC pools available.
I am grateful to Bilkent University for providing me research assistant scholarship for my MS study.
I would also like to address my thanks to School of Engineering and Applied Science of Miami University, Ohio for providing me a visiting short-term scholarship, which is really invaluable for my thesis study. I am indebted to Gül and Alper Can because of their friendship and hospitality during my visit to Miami University. I would also like to thank Dr. Jon Patton from Miami University for his valuable comments.
Above all, I am deeply thankful to my parents and sisters, who supported me in each and every day. Without their everlasting love and encouragement, this thesis would have never been completed.
Contents
1 Introduction...1
1.1 Motivation...1
1.2 Overview of the Thesis ...3
2 Related Work on Automatic Evaluation...7
2.1 Ranking Retrieval Systems without Relevance Judgments ...7
2.2 Automatic Evaluation of Web Search Services ...9
2.3 Methods for Measuring Search Engine Performance over Time...10
2.4 Evaluating Topic-Driven Web Crawlers...11
2.6 Automatic Performance Evaluation of Web Search Engines (AWSEEM) ...12
3 Data Fusion Techniques for Automatic Evaluation...14
3.1 Data Fusion with Rank Positions ...17
3.2 Data Fusion with Social Welfare Functions ...18
3.2.1 Borda Count ...19
3.2.2 Condorcet’s Algorithm...20
3.3 Observations Related to Data Fusion...23
3.3.1 Effects of Number of Unique Documents in the Relevant Documents Set 23 3.3.2 Effects of Document Popularity in the Relevant Documents Set ...23
4 System Selection for Data Fusion ...25
4.1 Using Bias for System Selection...26
CONTENTS vii
5 Experimental Design and Evaluation...30
5.1 Data Sets ...30
5.2 Experimental Results and Evaluation ...32
5.2.1 Rank Position Method...34
5.2.2 Borda Count Method...43
5.2.3 Condorcet’s Algorithm...51
5.3 Overall Evaluations...58
6 Further Experiments ...59
6.1 Iterative Rank Position Method ...60
6.2 Random Sampling Method ...62
7 Conclusions and Future Work...64
7.1 Novelty and Implications of this Study...65
7.2 Further Work Possibilities ...67
List of Figures
1.1: Information Retrieval Process...2
3.1: Automatic performance evaluation process; generalized description for information retrieval system IRSi...16
5.1: Mean average precision ranking of retrieval systems with actual TREC rankings and ranking with the Rank Position method applied to all systems to be ranked...36 5.2: Mean average precision ranking of retrieval systems with actual TREC rankings and
ranking with the Rank Position method applied to best 25% of the systems. ...38 5.3: Mean average precision ranking of retrieval systems with actual TREC rankings and
ranking with Rank Position method applied to biased 50% of the systems...41 5.4: Correlation comparisons for different system selection methods in the Rank Position
method with the actual TREC rankings. ...42 5.5: Mean average precision ranking of retrieval systems with actual TREC rankings and
ranking with the Borda Count method applied to all of the systems. ...45 5.6: Mean average precision ranking of retrieval systems with actual TREC rankings and
ranking with the Borda Count method applied to best 25% of the systems. ...47 5.7: Mean average precision ranking of retrieval systems with actual TREC rankings and
ranking with the Borda Count method applied to biased 50% of the systems...48 5.8: Correlation comparisons for different system selection methods in the Borda Count
method with the actual TREC rankings ...50
LIST OF FIGURES ix 5.9: Mean average precision ranking of retrieval systems with actual TREC rankings and
ranking with the Condorcet’s Algorithm applied to all of the systems...53 5.10: Mean average precision ranking of retrieval systems with actual TREC rankings
and ranking with the Condorcet’s Algorithm applied to best 25% of the systems. .54 5.11: Mean average precision ranking of retrieval systems with actual TREC rankings
and ranking with the Condorcet’s Algorithm applied to biased 50% of the systems. ...56 5.12: Correlation comparisons for different system selection methods in the Condorcet’s
Algorithm with the actual TREC rankings...57
6.1: Scatter plot of the Rank Position method with b=100 and s50 vs. actual TREC assessments for TREC-6. ...60 6.2: Scatter plot of the iterative Rank Position method with b=100 and s50 vs. actual
TREC assessments for TREC-6. ...61 6.3: Comparison of Correlations for variants of the Rank Position method...62 6.4: Comparison of the random sampling method with different variants of the Rank
Position method...63
List of Tables
5.1: Kendall’s tau correlation of the Rank Position method using all systems to the actual TREC rankings for various numbers of pseudo relevant documents ...35 5.2: Kendall’s tau correlation of the Rank Position method using best 25% of the
systems to the actual TREC rankings for various numbers of relevant documents.37 5.3: Kendall’s tau correlation of the Rank Position method using biased 50% of the
systems to the actual TREC rankings for various numbers of pseudo relevant
documents ...40 5.4: Kendall’s tau correlation of the Borda Count method using all systems to the actual
TREC rankings for various numbers of pseudo relevant documents...44 5.5: Kendall’s tau correlation of the Borda Count method using best 25% systems to
the actual TREC rankings for various numbers of pseudo relevant documents ...44 5.6: Kendall’s tau correlation of the Borda Count method using biased 50% of systems
to the actual TREC rankings for various numbers of pseudo relevant documents ..49 5.7: Kendall’s tau correlation of the Condorcet’s Algorithm using all systems to the
actual TREC rankings for various numbers of pseudo relevant documents ...52 5.8: Kendall’s tau correlation of the Condorcet’s Algorithm using best 25% systems to
the actual TREC rankings for various numbers of pseudo relevant documents ...52 5.9: Kendall’s tau correlation of the Condorcet’s Algorithm using biased 50% of
systems to the actual TREC rankings for various numbers of pseudo relevant
documents ...55 5.10: Number of TREC years that each composition beats others ...58 5.11: TREC years that composition of merging and selection algorithms beats others .58
LIST OF TABLES xi
6.1: Correlation values for iterative Rank with different depth of pools ...61 A.1: The Kendall’s tau correlation of the Rank Position method to the actual TREC
rankings using all systems for TREC-3 ...75 A.2: The Kendall’s tau correlation of the Rank Position method to the actual TREC
rankings using all systems for TREC-4 ...75 A.3: The Kendall’s tau correlation of the Rank Position method to the actual TREC
rankings using all systems for TREC-5 ...76 A.4: The Kendall’s tau correlation of the Rank Position method to the actual TREC
rankings using all systems for TREC-6 ...76 A.5: The Kendall’s tau correlation of the Rank Position method to the actual TREC
rankings using all systems for TREC-7 ...76 A.7: The Kendall’s tau correlation of the Rank Position method to the actual TREC
rankings using all systems for TREC-9 ...77 A.8: The Kendall’s tau correlation of the Rank Position method to the actual TREC
rankings using best 25% of the systems for TREC-3 ...77 A.9: The Kendall’s tau correlation of the Rank Position method to the actual TREC
rankings using best 25% of the systems for TREC-4 ...77 A.10: The Kendall’s tau correlation of the Rank Position method to the actual TREC
rankings using best 25% of the systems for TREC-5 ...77 A.11: The Kendall’s tau correlation of the Rank Position method to the actual TREC
rankings using best 25% of the systems for TREC-6 ...78 A.12: The Kendall’s tau correlation of the Rank Position method to the actual TREC
rankings using best 25% of the systems for TREC-7 ...78 A.13: The Kendall’s tau correlation of the Rank Position method to the actual TREC
rankings using best 25% of the systems for TREC-8 ...78 A.14: The Kendall’s tau correlation of the Rank Position method to the actual TREC
LIST OF TABLES xii
A.15: The Kendall’s tau correlation of the Rank Position method to the actual TREC rankings using biased 25% of the systems for TREC-3...79 A.16: The Kendall’s tau correlation of the Rank Position method to the actual TREC
rankings using biased 25% of the systems for TREC-4...79 A.17: The Kendall’s tau correlation of the Rank Position method to the actual TREC
rankings using biased 25% of the systems for TREC-5...79 A.18: The Kendall’s tau correlation of the Rank Position method to the actual TREC
rankings using biased 25% of the systems for TREC-6...79 A.19: The Kendall’s tau correlation of the Rank Position method to the actual TREC
rankings using biased 25% of the systems for TREC-7...80 A.20: The Kendall’s tau correlation of the Rank Position method to the actual TREC rankings using biased 25% of the systems for TREC-8...80 A.21: The Kendall’s tau correlation of the Rank Position method to the actual TREC
rankings using biased 25% of the systems for TREC-9...80 A.22: The Kendall’s tau correlation of the Rank Position method to the actual TREC
rankings using biased 50% of the systems for TREC-3...80 A.23: The Kendall’s tau correlation of the Rank Position method to the actual TREC rankings using biased 50% of the systems for TREC-4...81 A.24: The Kendall’s tau correlation of the Rank Position method to the actual TREC
rankings using biased 50% of the systems for TREC-5...81 A.25: The Kendall’s tau correlation of the Rank Position method to the actual TREC rankings using biased 50% of the systems for TREC-6...81 A.26: The Kendall’s tau correlation of the Rank Position method to the actual TREC
rankings using biased 50% of the systems for TREC-7...81 A.27: The Kendall’s tau correlation of the Rank Position method to the actual TREC rankings using biased 50% of the systems for TREC-8...82
LIST OF TABLES xiii
A.28: The Kendall’s tau correlation of the Rank Position method to the actual TREC rankings using biased 50% of the systems for TREC-9...82 B.1: The Kendall’s tau correlation of the the Borda Count method to the actual TREC
rankings using all of the systems for TREC-3 ...83 B.2: The Kendall’s tau correlation of the the Borda Count method to the actual TREC
rankings using all of the systems for TREC-4 ...83 B.3: The Kendall’s tau correlation of the the Borda Count method to the actual TREC
rankings using all of the systems for TREC-5 ...84 B.4: The Kendall’s tau correlation of the the Borda Count method to the actual TREC
rankings using all of the systems for TREC-6 ...84 B.5: The Kendall’s tau correlation of the the Borda Count method to the actual TREC
rankings using all of the systems for TREC-7 ...84 B.6: The Kendall’s tau correlation of the the Borda Count method to the actual TREC
rankings using all of the systems for TREC-8 ...84 B.7: The Kendall’s tau correlation of the the Borda Count method to the actual TREC
rankings using all of the systems for TREC-9 ...85 B.8: The Kendall’s tau correlation of the the Borda Count method to the actual TREC
rankings using best 25% of the systems for TREC-3 ...85 B.9: The Kendall’s tau correlation of the the Borda Count method to the actual TREC
rankings using best 25% of the systems for TREC-4 ...85 B.10: The Kendall’s tau correlation of the the Borda Count method to the actual TREC
rankings using best 25% of the systems for TREC-5 ...85 B.11: The Kendall’s tau correlation of the the Borda Count method to the actual TREC
rankings using best 25% of the systems for TREC-6 ...86 B.12: The Kendall’s tau correlation of the the Borda Count method to the actual TREC
LIST OF TABLES xiv
B.13: The Kendall’s tau correlation of the the Borda Count method to the actual TREC rankings using best 25% of the systems for TREC-8 ...86 B.14: The Kendall’s tau correlation of the the Borda Count method to the actual TREC
rankings using best 25% of the systems for TREC-9 ...86 B.15: The Kendall’s tau correlation of the the Borda Count method to the actual TREC
rankings using biased 25% of the systems for TREC-3...87 B.16: The Kendall’s tau correlation of the the Borda Count method to the actual TREC
rankings using biased 25% of the systems for TREC-4...87 B.17: The Kendall’s tau correlation of the the Borda Count method to the actual TREC
rankings using biased 25% of the systems for TREC-5...87 B.18: The Kendall’s tau correlation of the the Borda Count method to the actual TREC
rankings using biased 25% of the systems for TREC-6...87 B.19: The Kendall’s tau correlation of the the Borda Count method to the actual TREC
rankings using biased 25% of the systems for TREC-7...88 B.20: The Kendall’s tau correlation of the the Borda Count method to the actual TREC
rankings using biased 25% of the systems for TREC-8...88 B.21: The Kendall’s tau correlation of the the Borda Count method to the actual TREC
rankings using biased 25% of the systems for TREC-9...88 B.22: The Kendall’s tau correlation of the the Borda Count method to the actual TREC
rankings using biased 50% of the systems for TREC-3...88 B.23: The Kendall’s tau correlation of the Borda Count method to the actual TREC
rankings using biased 50% of the systems for TREC-4...89 B.24: The Kendall’s tau correlation of the Borda Count method to the actual TREC
rankings using biased 50% of the systems for TREC-5...89 B.25: The Kendall’s tau correlation of the Borda Count method to the actual TREC
LIST OF TABLES xv
B.26: The Kendall’s tau correlation of the Borda Count method to the actual TREC rankings using biased 50% of the systems for TREC-7...89 B.27: The Kendall’s tau correlation of the Borda Count method to the actual TREC
rankings using biased 50% of the systems for TREC-8...90 B.28: The Kendall’s tau correlation of the Borda Count method to the actual TREC
rankings using biased 50% of the systems for TREC-9...90
C.1: The Kendall’s tau correlation of the Condorcet’s Algorithm to the actual TREC rankings using all of the systems for TREC-3 ...91 C.2: The Kendall’s tau correlation of the Condorcet’s Algorithm to the actual TREC
rankings using all of the systems for TREC-4 ...91 C.3: The Kendall’s tau correlation of the Condorcet’s Algorithm to the actual TREC
rankings using all of the systems for TREC-5 ...91 C.4: The Kendall’s tau correlation of the Condorcet’s Algorithm to the actual TREC
rankings using all of the systems for TREC-6 ...92 C.5: The Kendall’s tau correlation of the Condorcet’s Algorithm to the actual TREC
rankings using all of the systems for TREC-7 ...92 C.6: The Kendall’s tau correlation of the Condorcet’s Algorithm to the actual TREC
rankings using all of the systems for TREC-8 ...92 C.7: The Kendall’s tau correlation of the Condorcet’s Algorithm to the actual TREC
rankings using all of the systems for TREC-9 ...92 C.8: The Kendall’s tau correlation of the Condorcet’s Algorithm to the actual TREC
rankings using best 25% of the systems for TREC-3 ...92 C.9: The Kendall’s tau correlation of the Condorcet’s Algorithm to the actual TREC
rankings using best 25% of the systems for TREC-4 ...93 C.10: The Kendall’s tau correlation of the Condorcet’s Algorithm to the actual TREC
LIST OF TABLES xvi
C.11: The Kendall’s tau correlation of the Condorcet’s Algorithm to the actual TREC rankings using best 25% of the systems for TREC-6 ...93 C.12: The Kendall’s tau correlation of the Condorcet’s Algorithm to the actual TREC
rankings using best 25% of the systems for TREC-7 ...93 C.13: The Kendall’s tau correlation of the Condorcet’s Algorithm to the actual TREC
rankings using best 25% of the systems for TREC-8 ...93 C.14: The Kendall’s tau correlation of the Condorcet’s Algorithm to the actual TREC
rankings using best 25% of the systems for TREC-9 ...93 C.15: The Kendall’s tau correlation of the Condorcet’s Algorithm to the actual TREC
rankings using biased 50% of the systems for TREC-3...94 C.16: The Kendall’s tau correlation of the Condorcet’s Algorithm to the actual TREC
rankings using biased 50% of the systems for TREC-4...94 C.17: The Kendall’s tau correlation of the Condorcet’s Algorithm to the actual TREC
rankings using biased 50% of the systems for TREC-5...94 C.18: The Kendall’s tau correlation of the Condorcet’s Algorithm to the actual TREC
rankings using biased 50% of the systems for TREC-6...94 C.19: The Kendall’s tau correlation of the Condorcet’s Algorithm to the actual TREC
rankings using biased 50% of the systems for TREC-7...94 C.20: The Kendall’s tau correlation of the Condorcet’s Algorithm to the actual TREC
rankings using biased 50% of the systems for TREC-8...94 C.21: The Kendall’s tau correlation of the Condorcet’s Algorithm to the actual TREC
Chapter 1
Introduction
1.1 Motivation
Information retrieval is the study of developing techniques for finding documents that are likely to satisfy the information needs of users [SAL1983]. Evaluation, which is a major force in research and development in information retrieval (IR), means assessing the performance of a system. Information retrieval system evaluation is performed at different levels; however, most of the experiments are performed at the processing level [SAR1995]. At this level, comparison of performance of different algorithms and techniques is performed, and their effectiveness is measured. The majority of the experiments on information retrieval effectiveness require a test collection, a set of query topic, and relevance information about each document with respect to each query. Information retrieval systems use a matching algorithm to estimate documents that are possibly relevant to the query and present them to the user. Then users examine the
CHAPTER 1. INTRODUCTION 2
documents to find answers to their information needs. This process is called relevance judgment. Figure 1.1 shows the principles of the information retrieval process. The effectiveness of information retrieval systems is measured using thee relevance judgments. The traditional performance measures in information retrieval are precision and recall, where precision is the fraction of number of relevant documents to the number of retrieved documents and recall is the fraction of the number of relevant documents to the number of all relevant documents
In this study, we used the retrieval runs (systems) submitted to the Text Retrieval Conference (TREC), which is a yearly conference dedicated to experimentation with large databases. TREC is managed by National Institute of Standards and Technology (NIST). For each TREC conference a set of reference experiments is designed. Each participating group in TREC conferences uses reference experiments for benchmark purposes. The effectiveness of these retrieval runs is evaluated by TREC using the human-based relevance judgments.
For very large databases creating relevance judgment is difficult, since several documents need to be judged for relevance to each query. This difficulty can be overcome through the use of pooling. Pooling is the selection of a fraction of documents for assessment; if the selected documents are a representative of the whole collection than the pooling method closely approximates the performance of each system. For example, in TREC, each participating group is asked to return the top 1000 documents and then the top 100 of these documents from each participant are pooled to generate the document collection for assessment.
query(input) querying
result set documents Information
Retrieval System
Document Collection
Figure 1.1: Information retrieval process
CHAPTER 1. INTRODUCTION 3
Some recent retrospective studies examined the effect of pooling method on the effectiveness of retrieval systems in very large databases. For example, Zobel [ZOB1998] performed some experiments using different sizes of pools and concluded that the results obtained using the method in TREC are reliable given a pool depth of 100. Cormack and his co-workers [COR1999] proposed some new pooling algorithms and compared to the standard pooling method. They found that it is possible to build an effective pool with fewer judgments to reduce the manual effort.
Another difficulty in creating relevance judgments is that people usually disagree about the relevance judgments and human judgment is expensive, subjective, and noisy. Some recent studies examined the issue of assessor disagreement. Harter [HRT1996] examined the variations in relevance assessments and the measurement of retrieval effectiveness using small databases. He found that the disagreement of assessors has a little influence on the relative effectiveness of information retrieval systems.
Another work on the variations in relevance judgments is the study of Voorhees [VOO2000b]. Her study uses TREC databases to see the effect of assessor disagreement in measuring the relative effectiveness of information retrieval systems in large databases. She found that with a little overlap in the relevance judgments, the relative effectiveness of retrieval systems are very close to each other for different assessors. Her results showed that differences in human relevance judgments do not affect the relative performance of the retrieval systems. The cost and subjectiveness of human-based methods necessitates automatic evaluation techniques that predict the ranking of systems correctly.
1.2 Overview of the Thesis
In this thesis, we propose and describe the results of an automatic evaluation methodology, which replaces the human relevance judgments with a set of documents determined by various data fusion methods. Data fusion is the process of combining the results of a number of retrieval systems working on the same database. It aims to improve the retrieval performance. Current data fusion algorithms can be categorized by the data they require: whether they need relevance scores or only ranks [ASL2001].
CHAPTER 1. INTRODUCTION 4
Since the relevance scores are not always available, we used the algorithms that exploit the rank information. In this study, three different data fusion algorithms are used. Two of them, Borda Count and Condorcet’s Algorithm, are based on the democratic election strategies [ROB1976]. The other one is the simplest merging algorithm among the three, which uses the plain rank position information of documents.
Data fusion is based on four different components: database (system) selection, document selection, query dispatching, and result merging [MNG2002]. In our experiments, we used different system selection methods and different result merging algorithms. In the document selection process, we select the top documents of the systems to be fused. We do nothing for the query dispatching part of data fusion method, because the query results (i.e., ranked documents) of the retrieval runs submitted to TREC for a set of topics is used.
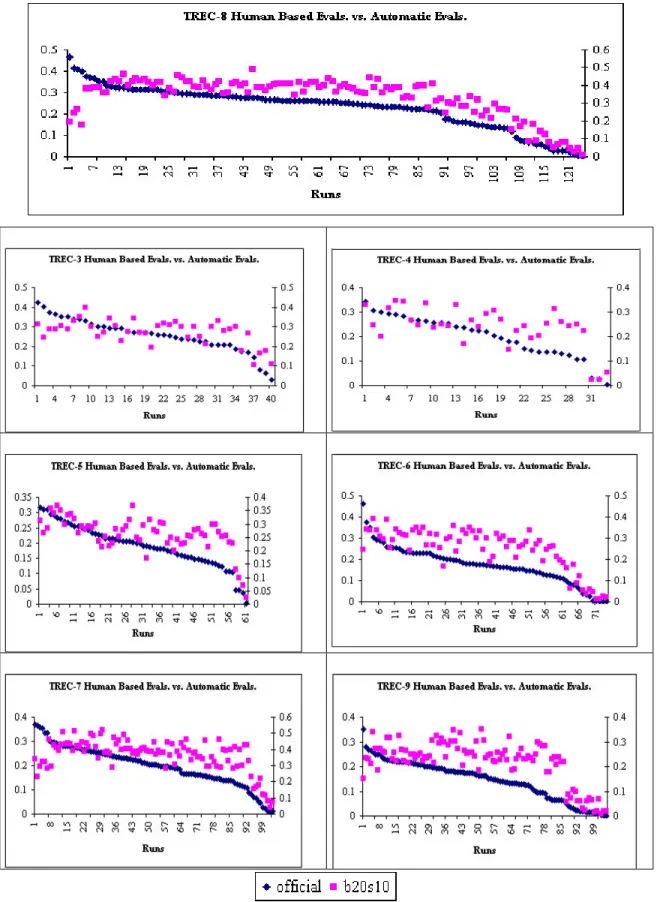
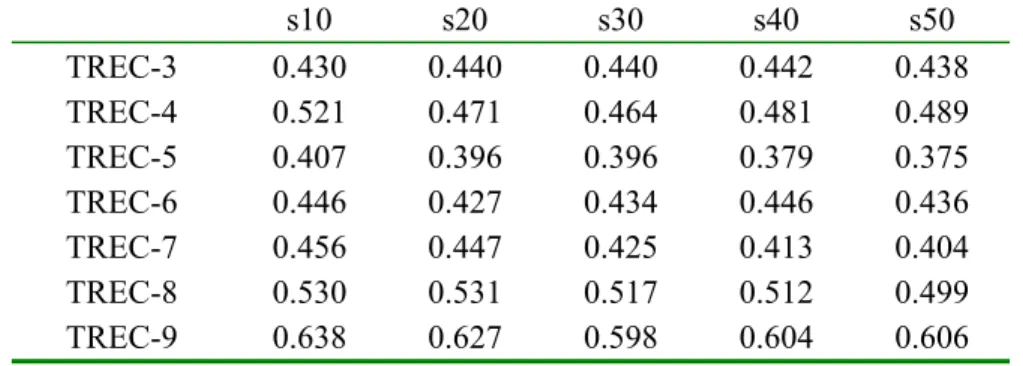
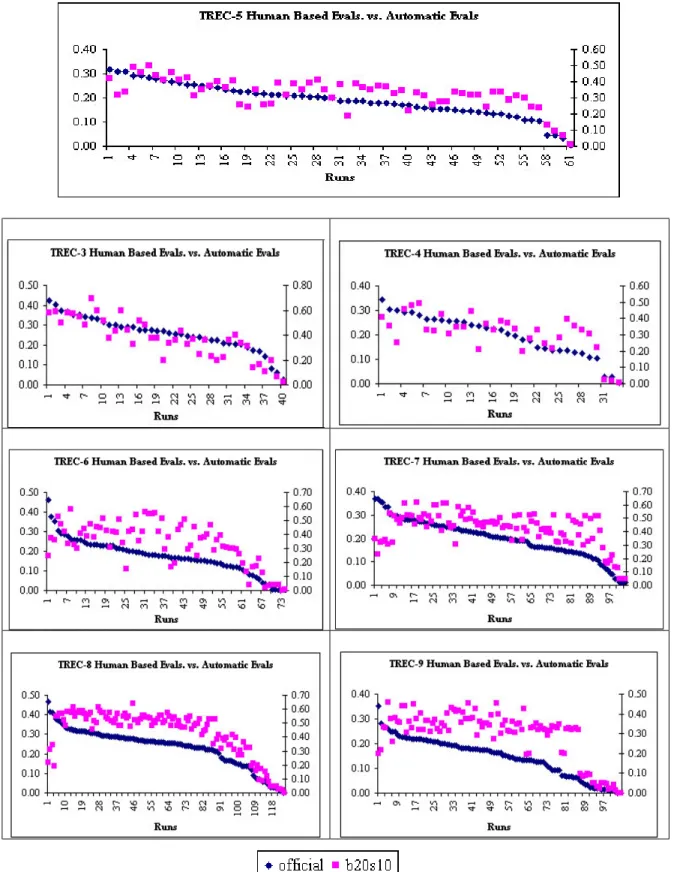
The correlations of our method for each data fusion algorithm to the actual (human-based) TREC rankings are measured over a variety of pool depths and various numbers of relevant documents. We report only the results of pooling top 20 documents; the correlations using other pool depths are given in Appendix A, B, and C, to show that using larger pools improves the effectiveness of automatic evaluation methods based on the data fusion. As we increase the pool depth the results (i.e., the correlations between human-based and automatic results) tend to increase yet we prefer to report the results of top 20 documents for a simpler presentation and also due to the fact that the search engine users are generally look at the top 10 or 20 documents of the resulting list [SPI2002]; it also provides a more efficient experimental environment. Furthermore, we explore the success of using different data fusion methods for the automatic performance evaluation of retrieval systems and try to find the most appropriate method.
Our new evaluation methodology uses the merging algorithms that take only the ranking of documents into account and do not consider the content of them. Using such an approach makes the evaluation process more efficient. The experimental results show that the use of data fusion algorithms not only improves the prediction of ranking of information retrieval systems, but it also improves the prediction of the actual mean
CHAPTER 1. INTRODUCTION 5
average precision values of each system with respect to previous studies. Similar to our study Soboroff and his co-workers [SOB2001] proposed an automatic ranking methodology, which replaces the human relevance judgments. However, their study uses a random sampling technique and open to random variations. In this study, we also compare the effectiveness of the proposed method with different data fusion algorithms and conclude that the best performing variant of evaluation methodology is the one based on the Condorcet’s Algorithm. This method gives better performance for most of the cases using different system selection algorithms. The system selection algorithms determine the systems to be fused for data fusion purposes.
Our previous studies [CAN2003; NUR2003a; NUR2003b] also propose a new automatic evaluation methodology to replace the human relevance judgments, but in that study we use the content of documents to rank them, therefore it is an expensive approach. The ranking of retrieval systems with those studies are also consistent with the human based evaluations.
The major contributions of this thesis are the following:
• an automatic information retrieval performance evaluation method that uses data fusion algorithms for the first time in the literature (the thesis includes its comprehensive statistical assessment with several TREC systems which shows that method results correlates positively and significantly with the actual human-based results),
• system selection methods (using the concept of system bias, defined later, and iterative fusion) for data fusion aiming even higher correlations among automatic and human-based results,
• several practical implications stemming from the fact that the automatic precision values are strongly correlated with those of actual information retrieval systems.
This thesis is organized as follows. We first review the related works in Chapter 2. The used data fusion methods and some observations related to the data fusion algorithms are presented in Chapter 3. We then detail the system selection methods in
CHAPTER 1. INTRODUCTION 6
Chapter 4. Experimental results are presented in Chapter 5. Chapter 6 provides further experiments on the automatic performance evaluation with data fusion. Chapter 7 concludes the thesis and provides promising future research directions based on the thesis work.
Chapter 2
Related Work on Automatic Evaluation
The evaluation of text retrieval performance in static document collections is a well-known research problem in the field of information retrieval [SAL1983]. In this study our concern is the automatic performance evaluation of information retrieval systems. Classical performance evaluation of information retrieval systems requires a set of relevance judgments, made by human assessors, for each query. In the automatic evaluation, these relevance judgments generally are replaced with a set of relevant documents determined automatically. In the following sections, we give an overview of the automatic evaluation methodologies proposed so far.2.1 Ranking Retrieval Systems without Relevance Judgments
The study of [SOB2001] involves ranking retrieval systems without relevance judgments. Their methodology replaces human relevance judgments with a number of randomly selected documents from a pool generated in the TREC environment. The random selection approach provides a generic retrieval system that reflects the average behavior of all search engines. At first, the number of relevant documents is taken as the average number of relevant documents appearing in the TREC pool per topic for each year. The consistency of random selection method with human relevance judgment is measured by experimenting on some factors such as the pool depth, number of relevant documents, and allowing/disallowing duplicated documents in the pool.CHAPTER 2. RELATED WORK ON AUTOMATIC EVALUATION 8
In official TREC evaluations the top 100 documents from each participant are gathered to form a pool. The study looked at the effect of using a smaller pool depth. For this purpose, they used the top 10 documents from each retrieval run and they assumed that top systems perform well, since they find rare and unique relevant documents that other systems either do not find or do not rank highly. Use of shallow pools improves the consistency of random selection method with human-based evaluations in some TREC years.
Another factor that affects the consistency of human-based evaluations with the random selection process is allowing duplicated documents in the pool. In the construction of official TREC pools duplicated documents are not allowed, since it makes no sense for a TREC assessor to judge the relevance of the same document more than once. However, for random selection process, it is important to use duplicated documents in the pool, since the documents retrieved highly by more than one retrieval system are more likely to be relevant. Furthermore, their occurrences more than once in the pool improve their chance to be selected randomly. The study showed that allowing duplicated documents improves the correlation of human-based evaluations with random selection process.
The last factor that they take into account is the number of relevant documents for each query. At first, they used the average number of relevant documents for each TREC year. They used different number of relevant documents for each topic using the exact percentage of relevant document for that topic. This process is called exact fraction sampling. Using exact fraction sampling has two advantages over using the same number of documents for every topic. 1) Every topic has an exact number of relevant documents, so some topics have large number of relevant documents and some have very few. Using the exact number of relevant documents improves the mean average precision of each system. 2) A very large number of documents for a topic are not selected that has few relevant documents in reality, or vice versa. The study assumes that use of exact fraction sampling will have the highest improvement in the correlation; however, it improved the correlation of both methods for only some TREC years. Use of exact fraction sampling is an unrealistic approach, since we would never know these
CHAPTER 2. RELATED WORK ON AUTOMATIC EVALUATION 9
values in an actual case. In fact exact percentage approach reflects the real values to the experimental environment due to the two points stated above.
Ranking of retrieval systems using this methodology correlates positively and significantly with official TREC rankings, although the performance of top performing systems is not predicted well. Furthermore, it is unable to predict the real system effectiveness.
2.2 Automatic Evaluation of Web Search Services
The [CHO2002] study, presents a method for comparing search engine performance automatically based on how they rank the known item search result. The method uses known-item searching; comparing the relative ranks of the items in the search engines’ rankings. Known-item searching is as its name implies the searching of known documents in the results of search engines.
In the study, query-document pairs were constructed automatically using query logs and documents from Open Directory Project (ODP). Three random samples of query-document pairs were constructed (500, 1000, and 2000), and then the queries are issued to the search engines and the results are collected. The rank of each search engine for each query is found by computing the mean reciprocal rank of the document paired with that query. The overall score for a search engine is the mean reciprocal rank over all query-document pairs.
If query-document pairs are reasonable and unbiased then this method could be valuable. Although the document must be the most relevant for a query, it is not easy to determine. However, if the matches are reasonably good, then the better engines will be those that rank the documents higher. If the documents are biased then results will not be fair. For example, if we use a document from the search engine results we can choose the first document in the result set or we can choose a document randomly. If the selection is performed as in the former example the results will not be fair. The search engine whose first document is selected will be biased. To avoid bias in the evaluation we can ignore the search engine whose document is selected; however, the
CHAPTER 2. RELATED WORK ON AUTOMATIC EVALUATION 10
other search engines using a similar algorithm or the same database will also be biased, if there are any.
2.3 Methods for Measuring Search Engine Performance over
Time
The study of [BAR2002] describes methods for measuring performance of search engines over time. Several measures to describe the search engine functionality over a time period are defined. The study argues that, it is not sufficient to use traditional evaluation criteria: coverage, recall, precision, response time, user effort and form of output, as defined by [CLE1970]. Therefore a set of new evaluation measures is introduced for the evaluation of search engine performance over time. They are: (a) technical precision; (b) relative coverage; (c) new and totally new URLs; (d) forgotten, recovered, lost; (e) well-handled and mishandled URLs; (f) self overlap of a search engine; and (g) persistent URLs.
The study introduces the notion of technically relevant documents. A document is
technically relevant if it satisfies all the conditions posed by the query; query terms and
phrases that are supposed to be in the document are in the document and the terms that are supposed to be missing from the document are not in the document. If a document matches the Boolean query than it is relevant to that query. Although relevance evaluation is not as simple as the technical relevance defined here, the study is interesting because it introduces a set of new automatic evaluation criteria for retrieval systems.
The study illustrates the use of the proposed measures by a small example. The experiments involve the six major search engines, using a single term query. The searches are performed for a year for several times, and results are presented using the measures defined in the study.
CHAPTER 2. RELATED WORK ON AUTOMATIC EVALUATION 11
2.4 Evaluating Topic-Driven Web Crawlers
The [MEN2001] study proposes three approaches for assessing and comparing the performance of topic driven crawlers. These approaches are; (a) assessment via classifiers, (b) assessment via a retrieval system, and (c) assessment via mean topic similarity. These approaches are applied to assess three different crawlers; bestFirst, pageRank, and infoSpiders. The evaluations are performed automatically and are defined as follows.
Assessment via classifiers: a classifier for a set of 100 topics was built. These classifiers
are used to assess the newly crawled Web pages. A positively classified Web page is assumed to be good, or relevant page for that the topic that classifier defines. The measurement is performed using content-based relevance decided by the classifier.
Assessment via a retrieval system: an independent retrieval system is used to rank the
crawled pages against a topic. The crawlers are assessed by looking at the time when they fetched the good pages. A good crawler retrieves the high ranked pages earlier than the lower ranked pages. The temporal position of the URLs, the position related to their fetch time, is used in this evaluation, but if the URLs used in an index, their temporal positions are not important, since they will be evaluated using a different retrieval algorithm. Although they use the temporal positions of each URL in the crawling, it is fair since it equally treats all of the tested crawlers.
Assessment via mean topic similarity: the average cosine similarity between the tf*idf
vector of the topic and the tf*idf vector of each page visited up to certain point in the crawl is measured in this assessment method. The intuition is that a good crawler should remain in the neighborhood of the topic in vector space. This measure assesses the consistency of the retrieved set with the topic as the core. The similarity calculation is performed as the size of visited pages increases.
CHAPTER 2. RELATED WORK ON AUTOMATIC EVALUATION 12
2.6 Automatic Performance Evaluation of Web Search
Engines (AWSEEM)
In our previous works [CAN2003; NUR2003a; NUR2003b], we proposed a new methodology to replace human-based relevance judgments with a set of automatically generated relevance judgments. Our methodology works as follows. For each query, top b documents from each search engine are collected to form a pool of documents. Then we index and rank these documents using the vector space model [SAL1983]. The stop words in the documents and queries are eliminated. We also use stemming. The similarity between query and documents are evaluated using the cosine similarity function. The documents are sorted in descending order with their similarity to the query and a constant number of top documents in this ordering are treated as relevant. Then using these automatic or pseudo relevance judgments, we evaluate the performance of each system in terms of average precision at different document cut off values.
We tested our methodology in two different test environments and observed that our method correlates positively and significantly with the human based evaluations. We first tested our method on the performance evaluation of Web search engines. In this experiment, we used eight different search engines and 25 queries [CAN2003]. The ranking of these search engines with human-based evaluations is compared with the ranking by our automatic method. The results showed that our method predicts the best and worst performing search engines in terms of precision at different cut-off values and the ranking of search engines with this methodology is strongly correlated with that of human-based evaluations.
We then tested our methodology in the TREC environment [NUR2003a; NUR2003b]. We tested our method with the retrieval systems submitted to the ad hoc task of TREC-5. In our experiments we assumed a Web-like imperfect environment; i.e., the indexing information of all documents are available, but some of the documents are not reachable because of document deletions or network conditions. Our method presented consistent results with the actual TREC rankings; however, the methodology
CHAPTER 2. RELATED WORK ON AUTOMATIC EVALUATION 13
ranks the best performing search engines with the poor systems. The systems in the middle and the worst systems are predicted well. These two experiments showed that our method evaluating the retrieval systems automatically can be used to evaluate rank the Web search engines.
In this chapter, we reviewed the automatic evaluation and ranking methods proposed so far. Most of the methods are designed and experimented on the effectiveness of Web search engines. However, these methods can also be used in the performance evaluation of information retrieval systems in TREC. Knowing the most effective retrieval systems is important; however, the methodologies proposed so far cannot predict the most effective search engines. They use different techniques and support the hypothesis that it is possible to evaluate the effectiveness of information retrieval systems automatically. Our aim is to find a good automatic evaluation approach that estimates the actual performance of systems. The existence of automatic evaluation methods encourages us to propose such an evaluation methodology, because their results reveal that we can evaluate the performance of systems without human relevance judgments.
Chapter 3
Data Fusion Techniques for Automatic
Evaluation
“Two hands are better than one” is an old saying applied to the information retrieval problem since 1972 Fisher and Elchesen [FIS1972] showed that document retrieval results were improved by combining the results of two Boolean searches. Data fusion is the merging of final results from a number of retrieval systems to improve the retrieval effectiveness [MNG2002]. The central thesis in the fusion is that by combining the results of different retrieval systems we can outperform the best system. Data fusion process takes as input n ranked lists output by each retrieval system in response to a query. It then computes a single ranked list as output.
The work of Fisher and Elchesen [FIS1972] has been followed by several studies. For an excellent survey of combining approaches see [CRO2000; MNG2002]. Fox and Shaw [FOX1994] designed the CombSum and CombMNZ algorithms. Lee [LEE1995; LEE1997] performed experiments on these Comb algorithms and they have become the standard by which newly developed result combinations are judged. Aslam and Montague [ASL2001; MON2002] developed two different merging algorithms based on the social welfare functions, Borda Fuse and Condocet’s Fuse, and showed that their algorithms outperform the CombMNZ algorithm.
CHAPTER 3. DATA FUSION TECHNIQUES FOR AUTOMATIC EVALUATION 15
Recent studies on data fusion showed that the use of social welfare functions as the merging algorithms in data fusion presents better results than the existing data fusion methods [ASL2001; MON2002]. In the following sections, we describe three different data fusion methods; Rank Position (reciprocal rank), Borda Count (Fuse), and Condorcet’s Algorithm (Fuse) and their usage in the automatic performance evaluation. Some observations related to the effect of the number of unique relevant documents and document popularity in the data fusion is also presented.
Meng and his co-workers [MNG2002] reported that metasearch (data fusion) software is composed with a list of sub components. The following list details these components.
1. Database/Search Engine Selector: the search engines (databases) to be fused selected using some system selection methods.
2. Query Dispatcher: the queries are issued to the underlying search engines using their query formats.
3. Document Selector: documents selected from each search engine are determined. The simplest way is the use of top b documents.
4. Result Merger: the results of search engines are merged using some merging techniques.
In our experiments, we deal with three of these components. We do not consider the query dispatcher component, because we have the results for each query. In TREC the top 1000 documents are returned by each retrieval system for each query. In this chapter, we will discuss the result merger component of the data fusion process, and we will use the phrase data fusion instead of result merging. We also deal with the database (system) selection in Chapter 4. For the document selection phase, we use the pooling method with a depth of 20 documents.
CHAPTER 3. DATA FUSION TECHNIQUES FOR AUTOMATIC EVALUATION 16
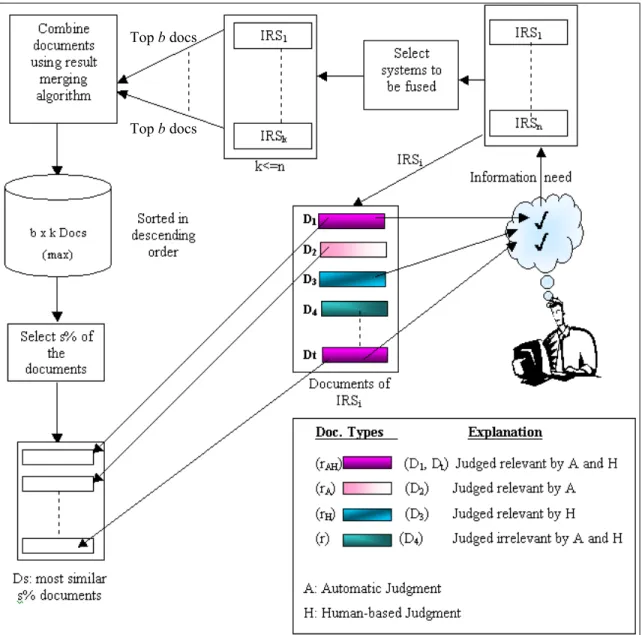
Figure 3.1: Automatic performance evaluation process; generalized description for information retrieval system IRSi
Top b docs
Top b docs
In our approach, automatic performance evaluation with data fusion works as follows. At first using a system selection algorithm we first select k systems to be fused. The maximum number of selected systems is the number of systems (n) in the test environment (k ≤ n). Then using one of the data fusion methods described in this chapter, we combine the top b documents from each selected system. The final output of merging is used to determine the pseudo relevant documents. Top s% of the merging result is selected and treated as relevant documents (Ds). We use a percentage of
CHAPTER 3. DATA FUSION TECHNIQUES FOR AUTOMATIC EVALUATION 17
documents instead of a constant number, because for some queries and pool depths the selected constant number may be higher than the number of documents returned as a response to that query from all of the systems. The performance of each retrieval system is evaluated using these pseudo relevant documents. The consistency of ranking of retrieval systems obtained using data fusion method with the actual TREC rankings is measured. Figure 3.1 depicts the automatic performance evaluation process.
3.1 Data Fusion with Rank Positions
The simplest merging strategy, which takes only the rank positions of documents retrieved from each retrieval system to merge them into a unified list. The rank position of each document is determined by the individual retrieval system. When a duplicated document is found its rankings are summed up, since the documents returned by more than one retrieval system might be more likely to be relevant. In our experiments, the rank position score (r) of a document is calculated by adding the inverse of rank positions of the document in different result sets.
1
r ( di ) = for all retrieval systems (j).
(Σ 1/position dij )
For each of the documents to be combined the rank position score is evaluated, then using these rank position scores documents are sorted in ascending order. Since the top ranked documents are more likely to be relevant to the query, they are treated as relevant documents.
Following example provides the working principle of Rank Position in automatic performance evaluation.
Example: Suppose that we have four different information retrieval systems with a document collection composed of documents a, b, c, d, e, f, and g. For a given query, their top four results for the search engines A, B, C, and D are as follows:
CHAPTER 3. DATA FUSION TECHNIQUES FOR AUTOMATIC EVALUATION 18
B = (a, d, b, e) C = (c, a, f, e) D = (b, g, e, f)
Now, we compute the rank position of each document in our document list, and the rank scores of documents are as follows.
r (a) = 1 / (1 + 1 + 1/ 2 ) = 0. 4 r (b) = 1 / (1/2 + 1/3 + 1 ) = 0. 52 r (c) = 1 / ( 1/3 + 1 ) = 0. 75 r (d) = 1 / (1/4 +1/2) = 1. 33 r (e) = 1 / (1/4 + 1/4 + 1/3 ) = 1. 2 r (f) = 1 / (1/3 +1/4) = 1. 71 and r (g) = 1 / ( 1/2) = 2.
After calculating rank scores of each document, we rank the documents with respect to their scores. The top s= 3 documents of the ranked list assumed to be relevant for that query, (i. e. , a, b, and c). The precision values are computed as follows:
A: Precision = 3/4 B: Precision = 1/2 C: Precision = 1/2 D: Precision = 1/4
The ranking of the systems from best to the worst is as follows.
A > B = C > D
3.2 Data Fusion with Social Welfare Functions
In social theory of voting, a group mainly decides the winner, but in many situations it is more useful to produce rankings of all of the candidates. A rule for determining the group ranking is called social welfare functions [ROB1976]. Voting procedures can be considered as data fusion algorithms, since they combine the preferences of multiple “experts” [ASL2001].
CHAPTER 3. DATA FUSION TECHNIQUES FOR AUTOMATIC EVALUATION 19
In the social theory of voting, there is a lot of individuals and a set of candidates. In data fusion problem, as an instance of voting problem, the documents correspond to the candidates and the input retrieval systems correspond to individuals. Thus, in data fusion there is a lot of candidates and a set of individuals. In our experiments, we use two different social welfare functions to assess the effectiveness of group decision-making algorithms in terms of automatic ranking of retrieval systems. In the following sections, we describe the social welfare functions used for data fusion.
3.2.1 Borda Count
This method is introduced by Jean-Charles de Borda in 1770. Borda Count is a position based voting algorithm in which each voter gives a complete ranking of all possible individuals. The highest ranked individual (in for example an n-way vote) gets n votes and each subsequent gets one vote less (so the number two gets n-1 and the number three gets n-2 and so on). Then, for each alternative, all the votes are added up and the alternative with the highest number of votes wins the election. More technically, each individual i ranks a set of candidates in order of preference, Pi. Let Bi (a) be the number
of candidates, b ranked below candidate a in Pi. For the top ranked candidate Bi (a) will
be the number of candidates. If there are candidates left unranked by the individual i, then the remaining score will be divided evenly among them. The candidates are ranked in order of their total scores (i. e. , Σ Bi(a), for all individual i). Ties in this election
process are not solved.
In automatic performance evaluation, retrieval systems are individuals where documents are candidates. We first merge the results of each retrieval system to obtain a full list of candidates for each query. Then for each document in that list, we compute the total Borda Count score. After that we rank the documents by their scores. Top s% of the documents in that ranked list are treated to be relevant documents to that query. If there is a tie of documents then documents are selected randomly.
Example: Suppose that we will evaluate the performance of three search engines A, B, and C. The search engines returned the following list of documents to a given query.
CHAPTER 3. DATA FUSION TECHNIQUES FOR AUTOMATIC EVALUATION 20
A = (a, c, b, d) B = (b, c, a, e) C = (c ,a, b, e)
Five distinct URLs retrieved by search engines A, B, and C: (a, b, c, d, and e) Now, the Borda Count of each URL is computed as follows.
B (a) = BA (a) + BB (a) + BC (a) = 5 + 3 + 4 = 12
B (b) = BA (b) + BB (b) + BC (b) = 3 + 5 + 3 = 11
B (c) = BA (c) + BB (c) + BC (c) = 4 + 4 + 5 = 13
B (d) = BA (d) + BB (d) + BC (d) = 2 + 1 + 1 = 4
B (e) = BA (e) + BB (e) + BC (e) = 1 + 2 + 2 = 5
Finally, documents are ranked using their Borda Counts. The final ranked list is as follows.
c > a > b > e > d
After that top s documents in this list are treated as relevant and the performance of each system can be evaluated using these relevance judgments. Suppose that top four (s= 4) documents in the ranked list (c, a, b, and e) are relevant to query, then precision of each system will be:
P (A) = 3/4, P (B) = 1, and P (C) = 1.
3.2.2 Condorcet’s Algorithm
Condorcet’s election method named after the French mathematician Marie Jean Antoine
Nicolas de Caritat Condorcet who formulated it in 18th century. The main idea is that each race is conceptually broken down into separate pair-wise races between each possible pairing of the candidates. If candidate A is ranked above candidate B by a particular voter, that is interpreted as a vote for A over B. If one candidate beats each of the other candidates in their one-on-one races, that candidate wins.
CHAPTER 3. DATA FUSION TECHNIQUES FOR AUTOMATIC EVALUATION 21
In the Condorcet’s election method, voters rank the candidates in order of preference. The vote counting procedure then takes into account each preference of each voter for one candidate over another. The Condorcet’s voting algorithm is a majoritarian method that specifies the winner as the candidate, which beats each of the other candidates in a pair-wise comparison. The basics of Condorcet’s voting are best illustrated by an example.
Example: Suppose that we have three candidates a, b, and c with five voters A, B, C, D, and E. Within the context of information retrieval candidates are documents and voters are retrieval systems. Each voter’s preferences are as follows.
A: a > b > c B: a > c > b C: a > b = c D: b > a E: c > a
In the first stage, we will use a NxN matrix for the pair-wise comparison, where N is the number of candidates. Each entry (i, j) of the matrix is showing the number of votes i over j (i.e., cell [a, b] is showing the number of wins, lose, and tie a over b, respectively).
a b c
a - 4, 1, 0 4, 1, 0
b 1, 4, 0 - 2, 2, 1
c 1, 4, 0 2, 2, 1 -
After that, we will determine the pair-wise winners. Each complimentary pair is compared, and the winner receives one point in its "win" column and the loser receives one point in its "lose" column. If the simulated pair-wise election is a tie, both receive one point in the "tie" column.
CHAPTER 3. DATA FUSION TECHNIQUES FOR AUTOMATIC EVALUATION 22
win lose tie
a 2 0 0
b 0 1 1
c 0 1 1
To rank the documents we use their win, lose and tie values. If the number of wins that a document has is higher than the other one, then that document wins. Otherwise if their win property is equal we consider their lose scores, the document who has smaller lose score wins. If both win and lose scores are equal then both documents are tied. The final ranking of the candidates in the example is as follows.
a > b = c.
If two of the candidates have same number of win, loss and tie, then they will be tied candidates. For some voting profiles, instead of a single winner, the class of candidates is all winners. This is called the voting paradox. An example of profile that causes voting paradox is the following. In this profile candidate a beats b twice, b beats c twice, and c beats a twice.
A: a > b > c B: b > c > a C: c > a > b
In automatic evaluation of the information retrieval systems, the top s% of the ranked documents will be relevant documents to our queries, and performance of each system will be evaluated using this relevant document list. If the documents merged using Condorcet’s Algorithm cause the voter’s paradox, the pseudo relevant documents are selected as a random sample in the evaluation.
CHAPTER 3. DATA FUSION TECHNIQUES FOR AUTOMATIC EVALUATION 23
3.3 Observations Related to Data Fusion
3.3.1 Effects of Number of Unique Documents in the Relevant
Documents Set
Beitzel and his co-workers [BEI2003] experimentally showed that to improve the effectiveness of data fusion, fusion with multiple-evidence strategies is not enough. The result sets being fused must contain a large number of unique relevant documents. These unique relevant documents must be highly ranked. The study first analyzed Lee’s claim that the effectiveness of fusion is directly related to the relevant and non-relevant overlap of the fused systems [LEE1995; LEE1997]. According to Lee, the higher the difference in relevant and non-relevant overlap, the greater the effectiveness of fusion should be. However, the experiments showed that the improvement in effectiveness of fusion is not related to the relevant and non-relevant overlap. The next step of the study was on the claim that highly effective retrieval strategies tend to return different relevant documents. They used highly effective retrieval strategies to show that the truth of this claim. If a relatively large number of unique relevant documents were ranked highly in the result sets to be fused, it would raise the average precision of fusion. Analysis of unique relevant documents for each TREC year and best three systems of that TREC year is done. This analysis showed that the fusion of top three systems for any depth has a higher percentage of unique relevant documents. Another interesting observation in this analysis is that the greatest percentage of unique relevant documents is near the top of the result sets. It shows that the best systems return unique relevant documents at the top of the result sets, so that fusion of best systems improves the effectiveness.
3.3.2 Effects of Document Popularity in the Relevant Documents Set
Aslam and Savell [ASL2003b] proposed an explanation why evaluating the performance of systems without relevance judgments such as the one proposed in [SOB2001] correlates positively and significantly with the actual TREC rankings.
CHAPTER 3. DATA FUSION TECHNIQUES FOR AUTOMATIC EVALUATION 24
They proposed a simple measure for the similarity of retrieval systems and showed that evaluating retrieval systems with the average similarity yields quite similar results to the methodology proposed in [SOB2001]. They also demonstrated that both of these methods are evaluating the retrieval systems by popularity as opposed to performance. In the study of Soboroff, et al. [SOB2001] most of the systems classified correctly, however the best systems are ranked consistently with the poor performers. Because the best performing systems return different relevant documents and they do something significantly different from the more generic systems in the competition. Thus, the study hypothesized that Soboroff, et al. study evaluates systems by popularity. Experiments on the system similarity are performed, and the correlation of ranking with system similarity to the Soboroff, et al.’s results verified the hypothesis about the popularity.
In this section, we review the studies that examine the number of unique relevant documents in the response set of a retrieval system for a query and the effect of popular documents in the automatic performance evaluation. As pointed out in [ASL2003b] the ranking of retrieval systems automatically performs well for the average systems because they return popular documents; however it does not perform well for best systems because they do not rank highly the popular documents; they rank the unique relevant documents highly. In our study we use the results of these two observations to use different set of systems in the data fusion process for automatic performance evaluation. In other words, their observations are a motivation tool for us to change the system selection component of data fusion in the automatic performance evaluation.
Chapter 4
System Selection for Data Fusion
One of the important components in the data fusion is the selection of the systems to be fused to improve the effectiveness of the data fusion process. Several researchers have used combinations of different retrieval strategies to varying degrees of success. Lee studied the effect of using different weighting schemes to retrieve different sets of documents with a single query and document representation, and a single retrieval strategy [LEE1995]. In another study, Lee examined why the data fusion techniques improved the effectiveness and concluded that improvements in retrieval effectiveness due to data fusion is directly related to the level of overlap in the results from each approach being combined [LEE1997]. Lee hypothesized that for multiple-evidence techniques to improve the effectiveness, the result set being combined must have higher relevant document overlap than non-relevant overlap. However, Beitzel, et al. [BEI1997] showed that this hypothesis is not true. The improvements in the retrieval effectiveness due to data fusion are related something different than the relevant or non-relevant overlap. Specifically, Beitzel, et al. proposed that to improve the effectiveness, highly effective retrieval strategies must be combined. They used the observations of Soboroff, et al. [SOB2001], which is the highly ranked retrieval systems find unique relevant documents that other retrieval systems either do not find or do not rank highly. Then they showed that the use of best systems in fusion improves the retrieval effectiveness and the best performing system returns the most unique relevant
CHAPTER 4. SYSTEM SELECTION FOR DATA FUSION 26
documents. At the same time Aslam and Savell [ASL2003b] showed that the automatic ranking of retrieval systems with random sampling method ranks systems using the popularity of the documents returned in their response set. Based on these observations, we propose to use three different approaches to select systems to be combined to generate pseudo relevant documents.
• Fusion via all retrieval systems, • Fusion via best retrieval systems, • Fusion via biased retrieval systems.
Firstly, every information retrieval system to be ranked is combined in the fusion via all retrieval systems. The 25 % of the top performing retrieval systems are combined in the second approach. Merging of the best retrieval systems to generate pseudo relevance judgments is a motivation to find a system selection algorithm that improves the automatic performance prediction of retrieval systems. The final approach is the fusion of biased systems, that is the retrieval systems that behave differently from the ideal retrieval system. Bias is a candidate method that finds the systems different from the majority. A detailed definition of bias is given in the following section.
4.1 Using Bias for System Selection
In this section, we deal with the bias in information retrieval systems. Bias is the balance or a function of emphasis of a set of documents in response to a set of queries [MOW2002a]. A response set may display bias whether or not the documents are relevant to the user’s need. However, bias in information retrieval is not concerned with individual documents, but rather with their distributions. Since the bias exhibited by a set of document deals with the emphasis. Bias of a retrieval system is measured by assessing the degree of deviation the document distribution from the ideal or norm. A retrieval system is highly biased if the documents in response to a set of queries are very different from the norm. Given a norm prescribing the frequency of items retrieved in response to a query, a set of documents exhibits bias, when some documents occur more
CHAPTER 4. SYSTEM SELECTION FOR DATA FUSION 27
frequently with respect to the norm, while others occur less frequently with respect to the norm [MOW2002a; MOW2002b].
The distribution of items in the norm is obtained by computing the frequencies of occurrence of documents in the collection retrieved by several information retrieval systems for a given set of queries. For a particular information retrieval system, the distribution of items is obtained in a similar fashion. Distribution of items is a vector of real numbers. To compute the bias of a particular system, we first calculate the similarity of the vectors of norm and a particular information retrieval system using a metric; such as their dot product is divided by the square root of the product of their lengths, i.e., the cosine similarity measure (other similarity measures can also be used). The bias value is obtained by subtracting this similarity value from 1. i.e. , the similarity function for vectors v and w is:
∑vi . wi
s(v, w) =
(∑(vi)2 . ∑(wi)2) ½
and the bias between these two vectors is defined as follows : B(v,w) = 1- s(v,w)
Bias can be interpreted in two very different ways. On the positive side, the results may mean that a retrieval system chooses relevant documents not found by the others; on the negative side, it may mean that the retrieval system simply fails to find the most relevant documents retrieved by the majority.
Two variant measures of bias, one that ignores the order of the documents in the retrieved result set, and one that takes account of order, are formulated in the study of Mowshowitz and Kawaguchi [MOW2002a; MOW2002b]. Frequency of occurrence of documents is incremented by 1 when bias is calculated by ignoring the position of documents. To take the order of documents into account, we may increment the frequency count of a document with a value different from 1. One possibility is to increment frequency of document by m/i where m is the number of positions and i is the position of document in the retrieved result set. In our experiments, we pay attention to