Original Article
Experimental validat
ıon of peripheral dose distribution of electron
beams for eclipse electron Monte Carlo algorithm
Hilal Acar, Mustafa Caglar, Ayse Y. Altinok
Department of Radiation Oncology, Istanbul Medipol University, Istanbul, Turkey
(Received 18 June 2017; revised 4 December 2017; accepted 8 December 2017;first published online 23 July 2018)
Abstract
Aim: The accuracy of two calculation algorithms of the Varian Eclipse treatment planning system (TPS), the electron Monte Carlo algorithm (eMC) and general Gaussian pencil beam algorithm (GGPB) for calculating peripheral dose distribution of electron beams was investigated.
Methods: Peripheral dose measurements were carried out for 6, 9, 12, 15, 18 and 22 MeV electron beams using parallel plate ionisation chamber and EBT3film in the slab phantom. Measurements were performed for 6× 6, 10 × 10 and 25 × 25 cm2 cone sizes at dmaxof each energy up to 20 cm beyond thefield edges. The measured and TPS calculated data were compared.
Results: The TPS underestimated the out-of-field doses. The difference between measured and calculated doses increase with the cone size. For ionisation chamber measurement, the largest deviation between calculated and measured doses is<4·29% using the eMC, but can increase up to 8·72% of the distribution
using GGPB. For film measurement, the minimum gamma analysis passing rates between measured and
calculated dose distributions for allfield sizes and energies used in this study were 91·2 and 74·7% for eMC and GGPB, respectively.
Findings: The use of GGPB for planning largefield treatments with 6 MeV could lead to inaccuracies of clinical significance.
Keywords: electron beams; eMC; GGPB.EBT3film; peripheral dose distribution
INTRODUCTION
Most commercial treatment planning systems (TPS) incorporate electron beam planning programs. However, not all programmes have
desirable accuracy. Pencil beam algorithms are common for electron beam dose calculations. In these techniques the energy spread or dose kernel at a point is summed along a line in a phantom to obtain a pencil type beam. By inte-grating the pencil beam over the patient’s surface to account for changes in primary intensity and by modifying the shape of the pencil beam with depth and tissue density, a dose distribution can
Correspondence to: Assoc Prof. Hilal Acar, Department of Radiation Oncology, Medicine Faculty, Istanbul Medipol University, 34214, Istanbul, Turkey. Tel: +90 (535) 9395365. Fax: 90 (212) 460 70 70. E-mail: [email protected]
be generated.1,2 The most accurate way to calculate electron beam dose distributions is through Monte Carlo techniques.3
Varian (Varian Medical Systems, Palo Alto, CA, USA) marketed a partial Monte Carlo solution under the trade name electron Monte Carlo (eMC), for electron beam dose calcula-tions. The fast eMC technique employed by Eclipse (Varian Medical Systems) is based on standard EGS4 Monte Carlo methods, but reduces the number of electron transport steps through the patient.4,5
The goal of this study is to experimentally validate the accuracy of the eMC algorithm in the peripheral dose region. The percentage per-ipheral dose distributions of electron beams were measured using parallel plate type ionisation chamber andfilm dosimetry and the accuracy of dose calculation algorithms of Eclipse, General Gaussian Pencil Beam (GGPB) and the eMC, for calculating out-of-field doses was investigated.
METHODS
Ionisation chamber measurements
The percentage peripheral dose distributions of electron beams were measured for Varian Triology linear accelerator having 6, 9, 12, 15, 18, 20 and 22 MeV electron energies using a parallel plate ionisation chamber (PTW Roos 34001; PTW, Friedberg, Germany) inserted into a 40 × 15 × 120 cm3(width × height × length) water-equivalent plastic phantom (RW3 Slab phantom; PTW). Great care was taken to ensure that there was no air gap while aligning the slabs.
The linear accelerator output was checked and monitored on a daily basis before each set of measurements. The outputs of the beam were measured with Roos ionisation chamber con-nected with Unidos Webline electrometer in RW3 solid water phantom. Absorbed dose measurements were done at zref= 0·6R50–0·1,
SSD= 100 cm using 10 × 10 cm2 cone for each energy. TRS 398 protocol was used to calculate absorbed doses. The absorbed dose at zref was
converted to absorbed dose at zmax using PDD
data. 1 cy= 1 MU at dmaxof each energy.
Dose distributions were measured for standard 6 × 6, 10 × 10 and 25 × 25 cm2 cones at 100 cm Source to Surface Distance (SSD) by giving 100 monitor unit (MU) at central axis maximum depth (dmax) of each energy. The applicator sizes
refer to the dimension of the projected lightfield at SSD= 100 cm.
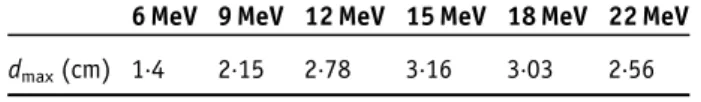
The measurements were done at dmaxof each
energy which are listed in Table 1.
The percentage peripheral doses were mea-sured up to 20 cm distances from the geometric field edge. Doses were measured with the increments of 0·5 cm. The collimator and gantry angle was 0°. Each measurement was repeated three times and the mean value of the readings were noted. The standard error was found to be within 1%. All the data were normalised to central axis at their respective dmax to calculate
percentage peripheral dose. These measured doses were then compared with values taken from the TPS and EBT3film measurement.
Film calibration
GafChromic EBT3 (International Specialty Products, NJ, USA) is a new model of radio-chromic film. As Sipila et al.6 found that the energy dependence of the EBT3film is uniform within 0·5%, with uncertainties close to 1·6% (k= 2) with electron beams ranging from 6 to 16 MeV and at reference measurement condi-tions in water. The GafChromic EBT3 films were used for the measurement of 2D dose distribution.
For calibration offilm, one sheet of film was cut to 24 pieces with a size of 2 × 2 cm. Thefilm pieces were divided into eight groups (three pieces in each group) for calibration. The groups were irra-diated with dose steps of 2, 5, 10, 25, 50, 75, 100 and 125 cGy. The calibration was performed for 10 × 10 cm2cone and 12 MeV electron energy at a depth of dmax in 30 × 30 × 20 cm3 RW3 solid Table 1. The dose maximum depth of each energy used in this study.
6 MeV 9 MeV 12 MeV 15 MeV 18 MeV 22 MeV dmax(cm) 1·4 2·15 2·78 3·16 3·03 2·56
water phantom. After irradiation, the films were left for a period of 48 hours for self-development and scanned with a EPSON XL 1000 flatbed scanner. SNC Patient software version 5 of Sun Nuclear (Melbourne, FL, USA) was used forfilm analysis. The resulted calibration curve of net optical density (netOD) versus dose was obtained.
Comparison of Roos chamber measured profile with film measurement
In order to see the agreement between film and ionisation chamber, in field cross beam profiles were measured in water phantom using Roos chamber for all electron energies and 10 × 10 cm2 cone. These profiles were compared with the profiles measured in slab phantom using EBT3 film. The cross plane profiles measured both Roos ionisation chamber and EBT3 film were normalised to central axis dose in order to get rid of the effects of different measurement enviro-ment (water and solid water, respectively). To provide comparisons of multidimensional dose distributions, dose comparison tools such as gamma dose distribution, distance-to-agreement, and dose difference have been developed.7,8 Gamma index analysis with the test criteria of ±3%/ ± 3 mm were used in this study. A gamma value of>1 would be assigned for points failing the gamma criterion. To reduce statistical uncertainty, the measurement for each plan was repeated three times.
Film measurement
The EBT3 films were horizontally positioned and the measurements were performed at dmaxof
each energy as a function of off-axis distances ranging from field edge to 20 cm; 100 MU was given at each irradiation. The film pieces with dimensions of 2 × 22 cm (from the same batch as calibration films) were utilised to measure per-ipheral dose distribution of electron beams. As the regions near the cutted edge would produce inaccurate results for the gamma analysis, thefilm pieces were in 22 cm length. Peripheral dose measurements were done for all energies and cone sizes used in ionisation chamber measure-ments. The red channel was used to convert the nOD of these films to dose. The region of interest for gamma analysis was chosen as a
2 × 20 cm. Then, the dose distribution received by the film and calculated by TPS using two algorithms were compared using gamma index analysis. The doses measured at field edge and 15 cm from field edge were compared with the doses measured by ionisation chamber at the same distances. The measurement for each plan was repeated three times.
External beam treatment planning calculations
The 40 × 15 × 120 cm3 water-equivalent plastic phantom was scanned with and without ionisa-tion chamber by a computerised tomography (Toshiba Aquilion; Toshiba Medical Systems, Japan) to obtain three dimensional (3D) image data sets of 1 mm slices and transferred to the TPS. The active volume of ionisation chamber was contoured manually on the CT to calculate the mean dose on this contour.
The electron beams were created in Eclipse for each cone size and energy with the collimator and gantry orientation 0° imitating the mea-surements under real conditions in solid water phantom. We calculated the prescribed doses to give 100 MU to the dmax at the central axis for
each energy and cone size. All plans were initially calculated with a GGPB algorithm. Plans were then recomputed (keeping everything same) within Eclipse using eMC. The plans were nor-malised to 100% at their respective dmax for
analysis.
The eMC has six user-selectable parameters for individual calculations: calculation grid size, accu-racy, maximum number of particle histories, ran-dom number generator seed, smoothing method and smoothing level. To attain accurate calcula-tions and consistency within a reasonable amount of time, the eMC calculation parameters used in this study are listed in Table 2. Based on research done by Popple et al.9 to achieve clinically acceptable results, grid sizes for eMC calculations should be varied based on energy. The grid size should be approximately one-tenth of the distal fall off distance of the electron depth dose curve.
For the ionisation chamber comparison, the percentage peripheral doses at varying off-axis
points were recorded from the TPS by transfer-ring contour which represent the active volume of ionisation chamber to measurement point using‘move structure’ option of the Eclipse and calculating the mean doses at this volume. The dose measured at every location was compared with the given dose as generated by the TPS for two different algorithms at corresponding volumes. The dose difference % was calculated as follows:
Dose Difference %
= Dose Eclipse- Dose Measured
Dose Measured ´ 100
For the EBT3film measurement comparison, plans were made in the same way as described above on the CT scan of slab phantoms without chamber. The dose profiles calculated using two different algorithm were transferred to SNC patient software in order to compare them with EBT3film measurements.
RESULTS
Comparison of calculated data with ionisation chamber measurements
Figure 1 shows the Roos chamber measured percentage peripheral dose distributions of 6, 12 and 22 MeV electron beams for 10 × 10 cm2 cone. It is seen from the figure that percentage peripheral dose increases with the increase in energy. The maximum percentage peripheral dose was 83·92 ± 3·2% for 22 MeV and it decreased
to 68·54 ± 3·8% for 6 MeV at 25 × 25 cm2 cone size. For the Varian Linac, the out-of-field dose decreases continuously with increasing distance. These doses, at 15 cm from the beam central axis, are 0·7, 0·8, 0·9, 0·9, 1·2 and 1·4% of dmax for
6, 9, 12, 15, 18 and 22 MeV at 10 × 10 cm2cone, respectively.
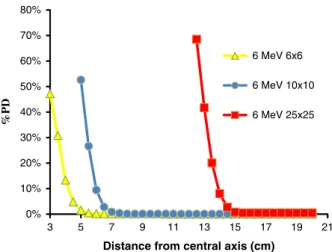
Figures 2 and 3 shows the Roos chamber measured percentage peripheral dose distribu-tions of 6 and 22 MeV electron beams for 6 × 6, 10 × 10 and 25 × 25 cm2 cone sizes. According to the figures, percentage peripheral dose
Table 2. Eclipse electron Monte Carlo calculation parameters used in this study.
Parameter Values
Calculation grid size 1 mm (6 MeV, 9 MeV) 1·5 mm (12 MeV, 15 MeV) 2 mm (18 MeV) 2 mm (22 MeV) Accuracy 1% Maximum number of particle histories
0 (calculates until desired accuracy goal is reached
Random generator seed number
1 to 3100000000 Smoothing method 3D Gaussian Smoothing level 1-Low
0% 10% 20% 30% 40% 50% 60% 70% 80% 5 7 9 11 13 15 17 19 21 %PD
Distance from central axis (cm)
6 MeV 10x10
12 MeV 10X10
22 MeV 10X10
Figure 1. The Roos chamber measured percentage peripheral dose distributions of 6, 12 and 22 MeV electron beams for 10× 10 cm2cone. 0% 10% 20% 30% 40% 50% 60% 70% 80% 3 5 7 9 11 13 15 17 19 21 %PD
Distance from central axis (cm)
6 MeV 6x6
6 MeV 10x10
6 MeV 25x25
Figure 2. The Roos chamber measured percentage peripheral dose distributions of 6 MeV electron beams for 6× 6, 10 × 10 and 25× 25 cm2cone sizes.
increases with the increase in cone size. The ratio of percentage peripheral doses for 10 × 10 to 6 × 6 cm2cones sizes was 1·02 and it was 1·18 for 25 × 25 to 10 × 10 cm2 cone sizes for 6 MeV at the field edge. The increase in percentage peripheral dose with cone size increases with electron beam energy. The ratio of percentage peripheral doses for 10 × 10 to 6 × 6 cm2 cones sizes was 1·08 and it was 1·25 for 25 × 25 to 10 × 10 cm2 cone sizes for 22 MeV at the field edge.
Figures 4a, 4b, 5a, 5b, 6a and 6b show the percentage difference graphs of 6, 9, 12, 15, 18 and 22 MeV electron beams at three different cone sizes, respectively. It is seen from the figures that the biggest difference between mea-surement and calculation was observed at the field edge. And as the distance from the field edge increased the difference between measurement and calculation decreased. The TPS calculated peripheral dose underestimated the measured ones.
The maximum difference between GGPB calculated peripheral dose and measurement was 8·72% for 22 MeV and 25 × 25 cm2 cone. The difference between GGPB calculated and measured percentage peripheral dose decreases with increasing energy up to 3 cm away from field edge. However, as the distance from field edge increases, the difference remains constant.
The minimum difference was 5·01% for 6 MeV and 6 × 6 cm2cone.
The difference between measurement and GGPB results increases withfield size. The maximum dif-ference between measurement and GGPB results for 22 MeV was 7·51, 8·21 and 8·72% for 6 × 6, 10 × 10 and 25 × 25 cm2cones, respectively. And the minimum difference between measurement and GGPB results for 6 MeV was 5·01, 5·51 and 6·02% for 6 × 6, 10 × 10 and 25 × 25 cm2cones, respectively.
The results of eMC algorithm were much closer to measurement results than GGPB algorithm. The maximum difference between eMC and measurement results was 4·29% for 22 MeV and 25 × 25 cm2 cone. Except for 22 MeV, the difference between eMC and measurement
0% 20% 40% 60% 80% 100% 3 5 7 9 11 13 15 17 19 21 %PD
Distance from central axis (cm)
22 MeV 6X6
22 MeV 10X10
22 MeV 25X25
Figure 3. The Roos chamber measured percentage peripheral dose distributions of 22 MeV electron beams for 6× 6, 10 × 10 and 25× 25 cm2cone sizes. 0% 1% 2% 3% 4% 5% 6% 7% 8% 3 8 13 18 P e rc en ta g e Diff er ence %
Distance from central axis (cm)
6X6 CONE 6 MeV Roos/GGPB 9 MeV Roos/GGPB 12 MeV Roos/GGPB 15 MeV Roos/GGPB 18 MeV Roos/GGPB 22 MeV Roos/GGPB 0.0% 0.5% 1.0% 1.5% 2.0% 2.5% 3.0% 3.5% 4.0% 3 8 13 18 P e rc en ta g e Diff er ence %
Distance from central axis (cm)
6X6 CONE 6 MeV Roos/eMC 9 MeV Roos/eMC 12 MeV Roos/eMC 15 MeV Roos/eMC 18 MeV Roos/eMC 22 MeV Roos/eMC (a) (b)
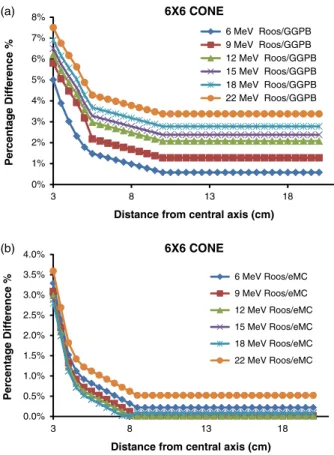
Figure 4. (a) The percentage difference between ionisation chamber measured and GGPB calculated data of 6, 9, 12, 15, 18 and 22 MeV electron beams for 6× 6 cm2 cone. (b) The percentage difference between ionisation chamber measured and eMC calculated data of 6, 9, 12, 15, 18 and 22 MeV electron beams for 6× 6 cm2cone.
results decreases with increase in energy. The minimum difference was 2·79% for 18 MeV and 6 × 6 cm2cone.
The difference between measurement and eMC results increases with field size. The maximum difference between measurement and eMC results for 22 MeV was 3·59, 4·19 and 4·29% for 6 × 6, 10 × 10 and 25 × 25 cm2 cone sizes, respectively. And the minimum difference between measurement and eMC results for 18 MeV was 2·79, 2·89 and 3·0%
for 6 × 6, 10 × 10 and 25 × 25 cm2 cone sizes, respectively.
Comparison of Roos chamber measured profile with film measurement
The cross beam profiles measured using Roos ioni-sation chamber and EBT3film for 10 × 10 cm2cone size were in agreement between 2·4%. The region of interest was chosen 8 × 8 cm2in order not to take into accountfield edges. The gamma index passing rates for±3%/3 mm criteria were given in Table 3.
0% 1% 2% 3% 4% 5% 6% 7% 8% 9% 5 10 15 20 P e rc en ta g e Diff e re nce %
Distance from central axis (cm)
10X10 CONE 6 MeV Roos/GGPB 9 MeV Roos/GGPB 12 MeV Roos/GGPB 15 MeV Roos/GGPB 18 MeV Roos/GGPB 22 MeV Roos/GGPB 0.0% 0.5% 1.0% 1.5% 2.0% 2.5% 3.0% 3.5% 4.0% 4.5% 5 10 15 20 P e rc en ta g e Diff er ence %
Distance from central axis (cm)
10X10 CONE 6 MeV Roos/eMC 9 MeV Roos/eMC 12 MeV Roos/eMC 15 MeV Roos/eMC 18 MeV Roos/eMC 22 MeV Roos/eMC (a) (b)
Figure 5. (a) The percentage difference between ionisation chamber measured and GGPB calculated data of 6, 9, 12, 15, 18 and 22 MeV electron beams for 10× 10 cm2cone. (b) The percentage difference between ionisation chamber measured and eMC calculated data of 6, 9, 12, 15, 18 and 22 MeV electron beams for 10× 10 cm2cone.
0% 1% 2% 3% 4% 5% 6% 7% 8% 9% 10% 13 15 17 19 21 P e rc en ta g e Diff er ence %
Distance from central axis (cm)
25X25 CONE 6 MeV Roos/GGPB 9 MeV Roos/GGPB 12 MeV Roos/GGPB 15 MeV Roos/GGPB 18 MeV Roos/GGPB 22 MeV Roos/GGPB 0.0% 0.5% 1.0% 1.5% 2.0% 2.5% 3.0% 3.5% 4.0% 4.5% 5.0% 12.5 13.5 14.5 15.5 16.5 17.5 18.5 19.5 20.5 P e rc en ta g e Diff e rence %
Distance from central axis (cm)
25X25 CONE 6 MeV Roos/eMC 9 MeV Roos/eMC 12 MeV Roos/eMC 15 MeV Roos/eMC 18 MeV Roos/eMC 22 MeV Roos/eMC (a) (b)
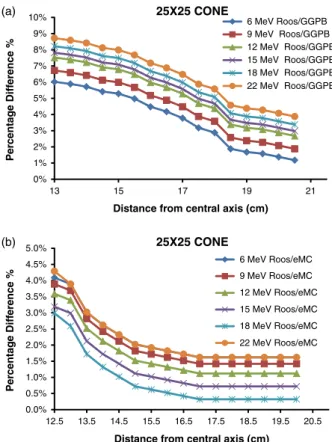
Figure 6. (a) The percentage difference between ionisation chamber measured and GGPB calculated data of 6, 9, 12, 15, 18 and 22 MeV electron beams for 25× 25 cm2cone. (b) The percentage difference between ionisation chamber measured and eMC calculated data of 6, 9, 12, 15, 18 and 22 MeV electron beams for 25× 25 cm2cone.
Table 3. The gamma index passing rates of in field cross plane profiles measured by ionisation chamber and film dosimetry for±3%/3 mm criteria
6 MeV 9 MeV 12 MeV 15 MeV 18 MeV 22 MeV
The EBT3 film measurements overestimated the dose in comparison with ionisation chamber measurements.
Comparison of calculated data with EBT3 film measurements
Percentage peripheral dose distributions were measured by EBT3 films by the red channel calibration curve for 6, 9, 12, 15, 18 and 22 MeV electron beams using 6 × 6 cm2, 10 × 10 cm2and 25 × 25 cm2cone sizes.
Table 4 shows a comparison of ionisation cham-ber measurements with film measurements, at two different off-axis distances. The EBT3 film mea-surements overestimated the dose in comparison with ionisation chamber measurements for all points. The measurement discrepancies between ionisation chamber and the film is about 7–8% at field edge, and it reaches up to 20% at 15 cm off-axis distance.
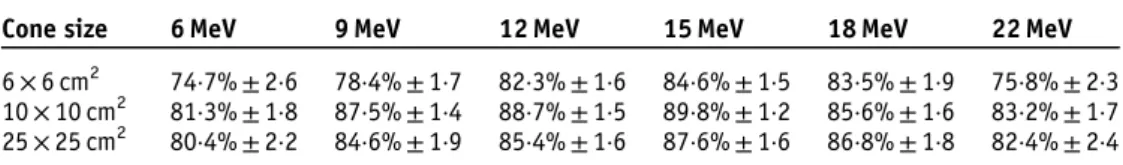
Gamma index passing rates for EBT3 mea-sured and GGPB and eMC calculated doses for all energies and cone sizes are shown in Tables 5 and 6, respectively.
There is no clinical acceptable agreement found between EBT3 measured and GGPB cal-culated percentage peripheral doses. For all energies and cone sizes analysed the gamma index passing rates were below 90%.
The agreement between measured and eMC calculated values was clinically acceptable for the 12, 15, 18 MeV with>97% of pixels passing our gamma requirements for all cone sizes tested. The 6 and 22 MeV showed poor results; the numbers of pixels passing our gamma requirements were below 95% for all cone sizes used.
The difference between ionisation chamber and film measurements can be arisen from the fact that spatial resolution of Roos chamber is lower than EBT3film.
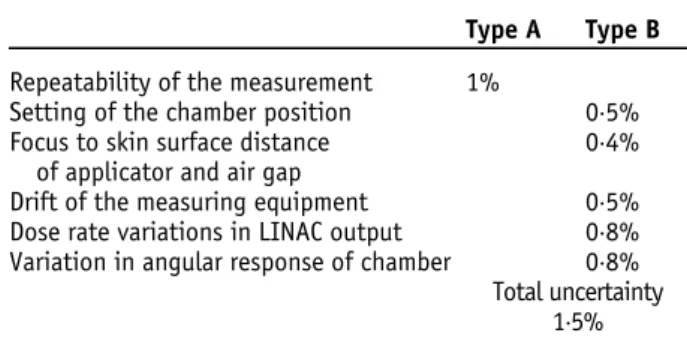
Uncertainity analysis of the ionisation chamber and EBT3 film measurements were given at Tables 7 and 8, respectively. Source of the uncertainty for intrinsic characteristics of EBT3 film measurement for red channel were taken from the study León et al.10
Table 4. Percentage dose difference (film measurement − ionisation chamber measurement/film measurement) between out-of-field doses measured with EBT3 film and Roos ionisation chamber at 10 × 10 cone
6 MeV 9 MeV 12 MeV 15 MeV 18 MeV 22 MeV
Field edge 8·11% ± 2·8 7·32% ± 2·7 6·96% ± 2·5 7·03% ± 2·6 7·21% ± 2·7 8·54% ± 2·7 15 cm 11·03% ± 2·2 16·52% ± 2·1 17·96% ± 1·8 17·97% ± 2·0 19·67% ± 1·9 20·38% ± 2·1
Table 5. Gamma index passing rates for EBT3 film measurement and GGPB calculation for ±3%/3 gamma index passing criteria
Cone size 6 MeV 9 MeV 12 MeV 15 MeV 18 MeV 22 MeV
6× 6 cm2 74·7% ± 2·6 78·4% ± 1·7 82·3% ± 1·6 84·6% ± 1·5 83·5% ± 1·9 75·8% ± 2·3 10× 10 cm2 81·3% ± 1·8 87·5% ± 1·4 88·7% ± 1·5 89·8% ± 1·2 85·6% ± 1·6 83·2% ± 1·7 25× 25 cm2 80·4% ± 2·2 84·6% ± 1·9 85·4% ± 1·6 87·6% ± 1·6 86·8% ± 1·8 82·4% ± 2·4
Table 6. Gamma index passing rates for EBT3 film measurement and eMC calculation for ±3%/3 gamma index passing criteria
Cone size 6 MeV 9 MeV 12 MeV 15 MeV 18 MeV 22 MeV
6× 6 cm2 92·2% ± 2·1 95·4% ± 0·9 97·3% ± 1·2 96·5% ± 1·6 97·2% ± 1·5 93·6% ± 1·9 10× 10 cm2 93·3% ± 1·1 96·5% ± 1·0 98·6% ± 0·8 97·9% ± 0·9 98·7% ± 1·3 94·5% ± 1·8 25× 25 cm2 92·6% ± 1·6 95·4% ± 1·2 98·1% ± 1·1 96·6% ± 1·0 96·8% ± 1·5 92·8% ± 1·4
DISCUSSION
The peripheral dose is the radiation dose received at points beyond the collimated radiotherapy field edge. The peripheral dose has two components; photons and electrons.11–13 The first component, Bremsstrahlung photons, occurs when relatively high energy electron beams interact with the applicator.14 The second component, scattered electrons, occur when electron beams penetrate with applicator and direct leakage into air from scatter foils during interaction with the applicator. In high energy electron beams, the direct escape to air mainly occurs during penetration and/or acti-vation with the applicator. In lower energy electron beams scattered electrons occur.15
TPSs are not commissioned for out-of-field dose calculations and the accuracy of TPS dose calculations is known to decrease beyond the field edge. While TPSs work well to calculate treatment dose in high-dose regions, they lack the ability to accurately model the doses to the periphery well beyond the extent of the field. Given the potential consequences of under or overestimation of dose it would be useful to
document the accuracy of peripheral dose for specific TPSs.16 Therefore, the objective of this work was to quantify the accuracy of out-of-field dose for a commonly used TPS, Eclipse version 13.0.28. The biggest difference between mea-surement and calculation was observed at the field edge and as the distance from the field edge increased the difference between measurement and calculation decreased. The difference between measured and calculated percentage peripheral dose increases as the cone size increases and except for 22 MeV it decreases as the energy of the beam increases. The TPS calculated peripheral dose underestimated the measured ones. In all cases, it is easy to note that the eMC models the dose dis-tribution more accurately than the GGPB does. The TPS underestimated the out-of-field doses. The differences between measured and calculated doses increase with the cone size. The largest deviation between calculated and measured dose distribution is <4·29% using the eMC, but can increase up to 8·72% using GGPB. eMC algorithms models medium energies best. The agreement is better for 18 MeV and small field sizes. However, for high energy and bigfield sizes the disagreement can reach 4·29%. One reason could be that in the current implementation of eMC algorithm in Eclipse, the EGSnrc precalculations for the MMC database have been carried out for monoenergetic electrons in certain steps which might not befine enough.
Alabdoaburas et al.17 measured the peripheral dose of electron beams by thermoluminescent dosimeter and EBT3 film for a Varian-type applicator. They found that the out-of-field dose from electron beams increases with the beam energy and the applicator size, and decreases with the distance from the beam central axis and the depth in water. The results of our work is in agreement with this work.
Xu et al.18 compared eMC calculations and measurements of depth doses, isodose distribu-tions and monitor units for several different energy and smallfield cutout size combinations at different SSDs. They measured using EBT film and a PinPoint ion chamber. They found that the eMC algorithm can accurately predict depth doses, isodose distributions, and monitor units (within 2·5%) for field sizes as small as 3·0 cm diameter for energies in the 6–20 MeV range at
Table 7. Source of the uncertainty for ionisation chamber measurement Type A Type B Repeatability of the measurement 1%
Setting of the chamber position 0·5% Focus to skin surface distance
of applicator and air gap
0·4% Drift of the measuring equipment 0·5% Dose rate variations in LINAC output 0·8% Variation in angular response of chamber 0·8%
Total uncertainty 1·5% Table 8. Source of the uncertainty for intrinsic characteristics of EBT3 film measurement
Red channel Response curves andfitting procedure 2·6% Dose resolution of the system 1·8%
Film reproducibility 0·2%
Film uniformity 0·2%
Relative orientation of thefilm 6·2% Reproducibility of the response of the
scanner
0·3% Homogeneity on the bed of scanner 2·0%
Total uncertainty 3·2%
100 cm SSD. However, at extended SSDs (105–110 cm), their results show good agree-ment (within 4%) only for higher energies (12, 16 and 20 MeV) for a field size of 3 cm.
Zhang et al.19 investigated dose calculation accuracy between pencil beam (PB) and eMC algorithms in the same treatment planning system for heterogeneous phantoms. They found that the eMC calculations generally agreed with the measurements to within 3% or 2 mm in both homogeneous and heterogeneous phantoms and large difference was observed for 20 MeV. However, the PB algorithm cannot predict the sharp dose gradients adjacent to the inhomo-geneity and results in large errors (up to 25%) beneath the inhomogeneities such as bone and lung.
CONCLUSION
Our results show that the Monte Carlo algorithm for electron planning in Eclipse is more accurate than previous algorithms for peripheral dose dis-tributions. It must be emphasised that the use of GGPB for planning large field treatments with 6 MeV could lead to inaccuracies of clinical sig-nificance. Even eMC algorithm underestimates the measured values. We concluded that per-ipheral dose data from TPS should only be used with a clear understanding of the accuracy of dose calculations outside the treatmentfield. Acknowledgements
None.
Conflicts of Interest None.
References
1. Podgorsak E B. Review of Radiation Oncology Physics: A Handbook for Teachers and Students. International Atomic Energy Agency Vienna, Austria 2003.
2 Hogstrom K R, Starkschall G, Shiu A S. Dose calculation algorithms for electron beams. In Purdy J A (ed.). Advances in Radiation Oncology Physics: Dosimetry, Treatment Planning and Brachytherapy. American Institute of Physics Monograph 19. New York, USA: American Institute of Physics, 1992: 900.
3. Strydom W, Parker W, Olıvares M. Electron beams: physical and clinical aspects’ Review of Radiation Oncol-ogy Physics: A Handbook for Teachers and Students Vienna. Austria: International Atomic Energy Agency 225–248.
4. Janssen J J, Korevaar E W, van Battum L J, Storchi P R, Huizenga H. A model to determine the initial phase space of a clinical electron beam from measured beam data. Phys Med Biol 2001; 46 (2): 269–286.
5. Fix M K, Frei D, Volken W, Neuenschwander H, Born E J, Manser P. Low Energy Electron Beam Dose Calculation Using eMC. Bern, Switzerland: Swiss Society of Radio-biology and Medical Physics, 2009.
6. Sipilä P, Ojala J, Kaijaluoto S, Jokelainen I, Kosunen A. Gafchromic EBT3film dosimetry in electron beams energy dependence and improvedfilm read-out. J Appl Clin Med Phys 2016; 17 (1): 360–373.
7. Low D A, Dempsey J F. Evaluation of the gamma dose distribution comparison method. Med Phys 2003; 30: 2455–2464.
8. Ezzell G A, Burmeister J W, Dogan N et al. IMRT com-missioning: multiple institution planning and dosimetry comparisons, a report from AAPM Task Group 119. Med Phys 2009; 36: 5359–5373.
9. Popple R A, Weinber R, Antolak J A et al. Comprehensive evaluation of a commercial macro Monte Carlo electron dose calculation implementation using a standard verifica-tion data set. Med Phys 2006; 33 (6): 1540–1551. 10. León M E Y, Herrera G J A, Camacho L M A, Villarreal B J E,
García-Garduño O A. Evaluation of the uncertainty in an EBT3 film dosimetry system utilizing net optical density. J Appl Clin Med Phys 2016; 17 (5): 466–481.
11. Chow J C, Grigorov G N. Peripheral dose outside appli-cators in electron beams. Phys Med Biol 2006; 51 (12): N231–N240.
12. Yeboah C, Karotki A, Hunt D, Holly R. Quantification and reduction of peripheral dose from leakage radiation on Siemens Primus accelerators in electron therapy mode. J Appl Clin Med Phys 2010; 11 (3): 154–172.
13. Shimozato T, Okudaira K, Fuse H, Tabushi K. Monte Carlo simulation and measurement of radiation leakage from applicators used in external electron radiotherapy. Phys Med 2013; 29 (4): 388–396.
14. Zhu T C, Das I J, Bjärngard B E. Characteristics of bremsstrahlung in electron beams. Med Phys 2001; 28 (7): 1352–1358.
15. Iktueren B, Bilge H, Karacam S, Atkovar G. The peripheral dose outside the applicator in electron beams of Oncor linear accelerator. Radiat Prot Dosimetry 2012; 150 (2): 192–197.
16. Howell R M, Scarboro S B, Kry S F, Yaldo D Z. Accuracy of out-of-field dose calculations by a commercial treatment planning system. Phys Med Biol 2010; 55 (23): 6999–7008.
17. Alabdoaburas M M, Mege J-P, Chavaudra J et al. Experi-mental assessment of out-of-field dose components in high energy electron beams used in external beam radiotherapy. J Appl Clin Med Phys 2015; 16 (6): 435–448.
18. Xu Z, Walsh S E, Telivala T P, Meek A G., Yang G. Evaluation of the eclipse electron Monte Carlo dose
calculation for small fields. J Appl Clin Med Phys 2009; 10(3): 2834–2843.
19. Zhang A, Wen N, Nurushev T, Burmeister J, Chetty I J. Comprehensive evaluation and clinical implementation of commercially available Monte Carlo dose calculation. J Appl Clin Med Phys 2013; 14 (2): 127–145.