Contents lists available atScienceDirect
Research in Veterinary Science
journal homepage:www.elsevier.com/locate/rvscEchocardiographic assessment of left ventricular systolic function in
neonatal calves with naturally occurring sepsis or septic shock due to
diarrhea
Amir Naseri
a,⁎, Ismail Sen
a,b, Kursad Turgut
a,c, Hasan Guzelbektes
a,b, Peter D. Constable
d aSelcuk University, Faculty of Veterinary Medicine, Department of Internal Medicine, Konya, TurkeybDepartment of Internal Medicine, Faculty of Veterinary Medicine, Kyrgyz Turkish Manas University, Bishkek, Kyrgyzstan cNear East University, Faculty of Veterinary Medicine, Department of Internal Medicine, Nicosia, North Cyprus, Turkey
dUniversity of Illinois at Urbana-Champaign, Department of Veterinary Clinical Medicine, College of Veterinary Medicine, Urbana, IL, United States
A R T I C L E I N F O Keywords:
Contractility Ejection fraction
Systemic inflammatory response syndrome Hypotension
A B S T R A C T
Sepsis is associated with clinically relevant cardiovascular changes. The objectives of this study were to evaluate the clinical value of echocardiography for monitoring left ventricular (LV) systolic function in septic calves. A prospective longitudinal study was performed using a convenience sample. Twenty septic calves and 10 healthy calves were enrolled in the study. Arterial blood pressure (BP) was measured and M-mode echocardiography performed to characterize LV systolic function; the latter included measurement of ejection fraction, EF; stroke volume, SVI and cardiac output indexed to body weight, CI; E-point of septal separation, EPSS; pre-ejection period, PEP; ejection time, LVET; ratio of PEP to LVET; velocity of circumferential shortening, Vcf, LV end-diastolic volume index (LVEDVI) and LV end-systolic volume index (LVESVI) on admission and 6, 24, 48 and 72 h later in septic calves and once in healthy calves. Admission data were compared using the Mann-Whitney U test and P < .05 was considered significant. Decreased preload and afterload were present in septic calves, as indicated by marked decreases in BP, LVEDVI, LVESVI, SVI, CI, EPSS when compared to healthy calves. Systolic function appeared adequate in septic calves, based on EF and FS compared to control calves. There was no difference in heart rate, LVET, PEP:LVET, or Vcf between septic and health calves. We conclude that circulatory dysfunction, rather than systolic dysfunction predominates in septic calves. Positive associations on admission between CI and LVEDVI, LVESVI, and SVI support this conclusion. Echocardiographic determination of LVEDVI and CI appears useful in directing treatment in septic calves.
1. Introduction
Many pathogens can result in sepsis if the immunologic response to an infectious challenge is inadequate (Constable et al., 2016;Martin et al., 2003). Sepsis and septic shock are associated with clinically re-levant cardiovascular changes in humans, including absolute or relative decrease in central blood volume (Rackow and Astiz, 1993), systolic and diastolic alterations of left ventricular (Landesberg et al., 2011; Ozier et al., 1984;Parker et al., 1984) and right ventricular (Chan and Klinger, 2008) function, marked peripheral vasodilation (Young, 2004), and increased vascular permeability (Lee and Slutsky, 2010). Sepsis-induced cardiovascular changes alter regional blood flow distribution and contribute to mortality in septic humans (Groeneveld et al., 1988) and presumably septic calves.
The widespread availability and decreased cost of ultrasound units
has resulted in the increased use of echocardiography to assess cardi-ovascular function (Bouhemad et al., 2009; Landesberg et al., 2011; Vieillard-Baron et al., 2008) and guide treatment (Au and Vieillard-Baron, 2012;Porter et al., 2015; Vincent et al., 2011) of humans in septic shock. A number of echocardiographic indices have been used to evaluate LV systolic function, including ejection fraction (EF), frac-tional shortening (FS), cardiac output (CO), E point of septal separation (EPSS), pre-ejection period (PEP), ejection time (ET), and the ratio of PEP to ET (Reant et al., 2010). Of these echocardiographic indices, EF is most commonly used for the initial evaluation of LV systolic function, and decreased EF is a common finding in humans with septic shock (Parker et al., 1984; Vieillard-Baron et al., 2008). However, studies examining the prognostic value of EF have provided conflicting results in humans with severe sepsis and septic shock (Griffee et al., 2010;Ho and Solomon, 2006;Nikitin et al., 2006), and the presence of systolic
https://doi.org/10.1016/j.rvsc.2019.08.009
Received 16 January 2019; Received in revised form 17 June 2019; Accepted 4 August 2019 ⁎Corresponding author.
E-mail address:[email protected](A. Naseri).
Research in Veterinary Science 126 (2019) 103–112
0034-5288/ © 2019 Elsevier Ltd. All rights reserved.
dysfunction is not associated with mortality in septic humans (Angus and Van Der Poll, 2013;Berrios et al., 2014;Huang et al., 2013;Repessé et al., 2013). This may be because echocardiographic indices, such as EF, CO, and EPSS provide an inaccurate evaluation of cardiac con-tractility (systolic performance) when there are concurrent changes in heart rate, preload, or afterload (Boudoulas et al., 1982; Boudoulas, 1990;Jardin et al., 1990;Lıghtowler et al., 2003;Thomas and Popović, 2006).
The authors are not aware of any studies that have evaluated the use of transthoracic echocardiography to guide treatment of septic calves, foals, dogs, or cats. We hypothesized that septic calves have echo-cardiographic evidence of LV systolic dysfunction and clinical evidence of circulatory abnormalities such as decreased MAP, that systolic and
circulatory function changes over time during treatment, and that echocardiography can be helpful in improving treatment protocols for septic calves and other domestic animals. Accordingly, the main ob-jective of the study reported here was to use non-invasive measures to characterize sepsis-induced cardiovascular changes in calves with naturally acquired sepsis and septic shock due to diarrhea, and to evaluate the value of echocardiography for monitoring cardiac function in response to treatment.
2. Materials and methods
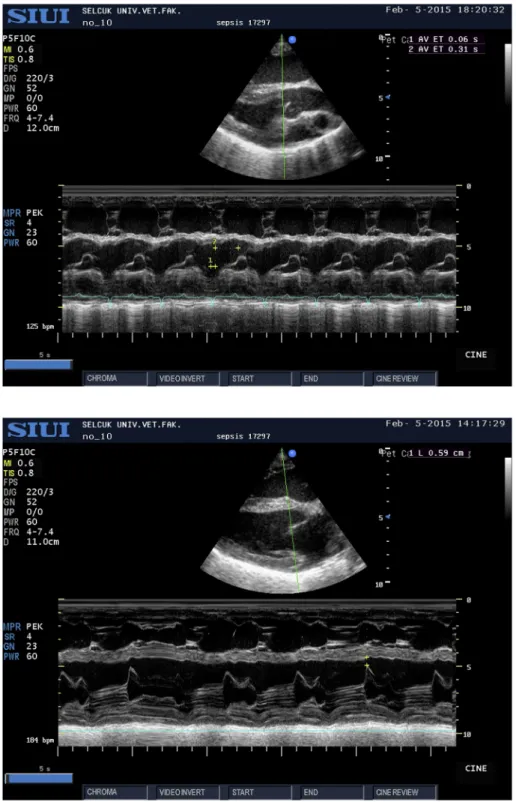
The study protocol was approved by the animal care and use com-mittee at Selcuk University (No. 2015/04) and conducted from Fig. 1. Representative right parasternal long-axis view in a septic calf for measurement of pre- ejection period (PEP: 60) and ejection time (ET: 310) in ms. The ejection time (ET) was measured by positioning the M-mode cursor over the aortic valve and mea-suring the time interval between opening and closing of the aortic valve and therefore the duration of ejection from the left ventricle.
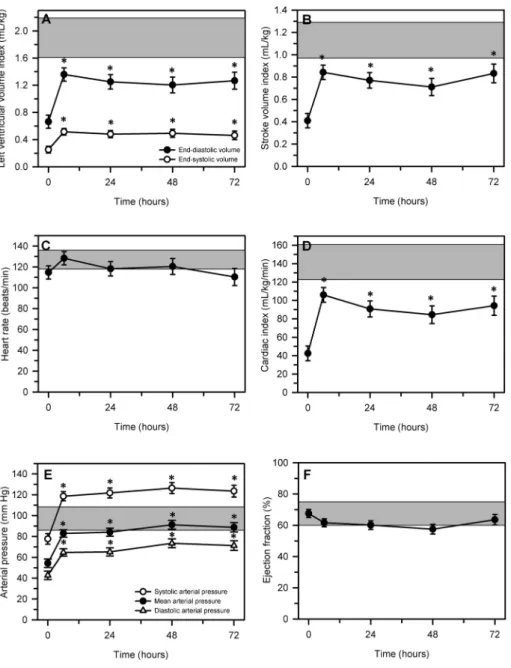
Fig. 2. Representative right parasternal long-axis view in a septic calf for measurement of the E-point to septal separation (EPSS) distance. The EPSS dis-tance was measured by positioning the M-mode cursor over the mitral valve and measuring the dis-tance between the E-point of the mitral valve and the most posterior point of the interventricular septum at end-diastole (yellow crosses). (For interpretation of the references to color in this figure legend, the reader is referred to the web version of this article.)
December 2014 to December 2016.
2.1. Healthy calves
A convenience sample of 10 healthy Holstein calves (6 male, 4 fe-male); 3 to 25 days old (mean, 15 ± 8) and weighing 26 to 45 kg (mean, 34.2 ± 6.1 kg) from the Faculty Farm were examined. Calves were determined to be healthy based on clinical examination findings and the results of complete blood count and serum biochemistry ana-lyses that were within the reference range (Constable et al., 2016).
2.2. Septic calves
A convenience sample of 20 calves admitted to the Large Animal Hospital of the Faculty of Veterinary Medicine, Selcuk University with a 1 to 2-day history of diarrhea and anorexia and depression were pro-spectively enrolled in the study. Calves were enrolled provided they met the study definition for sepsis, severe sepsis, or septic shock. Sepsis was defined as the existence of systemic inflammatory response syn-drome (SIRS) and clinical suspicion of infection, including, but not limited to pneumonia, meningitis, omphalophlebitis, and septic ar-thritis. Case definitions for SIRS in adult humans (Bone et al., 1992; Levy et al., 2003) and pediatrics (Goldstein et al., 2005) and established reference intervals for calves (Constable et al., 2016;Trefz et al., 2017) were used to diagnose the presence of SIRS provided that the calf had two or more of the following abnormalities: presence of an abnormal leukocyte count (i.e. leukocytosis or leukopenia; reference interval,
5000–12,000 cells/μL; or band neutrophils > 10%), abnormal rectal temperature (reference interval; 38.5–39.5 °C), tachycardia (> 120 beats per minute), and tachypnea (> 36 breaths per minute). The case definition for sepsis was that recommended for pediatrics (Goldstein et al., 2005): SIRS in the presence of, or as a result of, suspected or proven infection. Severe sepsis was defined as sepsis associated with one or more of the following: organ dysfunction, hypoperfusion, or hypotension. Septic shock was defined as the presence of sepsis with systemic arterial hypotension, as defined by systolic artery pressure (SAP) < 90 mm Hg or mean arterial pressure (MAP) < 65 mm Hg that was not responsive to intravenous fluid administration and required vasopressor therapy, and a plasmaL-lactate concentration > 2 mmol/L
that persisted after fluid resuscitation (Shankar-Hari et al., 2016). Calves were not enrolled in the study if they had received treatment before the initial examination, were diagnosed with a congenital heart abnormality, or poor-quality echocardiographic images were obtained. Calves meeting enrolment criteria were admitted to the neonatal in-tensive care unit and their rectal temperature, heart rate, respiratory rate, and capillary refill time determined. The mental status, suckling reflex, femoral pulse intensity, and degree of dehydration were also evaluated.
Venous blood samples for blood gas and analysis, serum biochem-ical analysis, and hematologic analysis were obtained at 0 h (on ad-mission) and at 6, 24, 48, and 72 h after admission. Blood samples were collected anaerobically from the jugular vein into heparin-containing polypropylene syringes for blood gas analysis, which was performed within 10 min of collection. Blood samples for serum biochemical analyses were collected into plain tubes, allowed to clot at room tem-perature, centrifuged, and the serum was harvested and stored at −20 °C until analyzed. Hematologic parameters were measured using blood samples collected into 2 mL EDTA containing tubes.
Each calf received a standardized treatment after blood samples and measurements had been obtained. The standardized treatment reflected a balance between the current understanding of optimal treatment protocols for septic shock and what was economically practical for a critically ill production animal. A 20 g butterfly venous catheter was placed into the vena auricularis as described (Berchtold, 2009) and secured for intravenous fluid administration. Intravenous fluid admin-istration was initiated using hydroxyethyl starch (10 mL/kg BW) at 10 mL/min and a 100 mL bolus of 30% dextrose. Calves with jugular venous pH < 7.20 due to strong ion (metabolic) acidosis were ad-ministered 1.3% NaHCO3solution at 65 mL/kg BW over the first hour of treatment, whereas calves with jugular venous pH ≥ 7.20 were ad-ministered 0.9% NaCl solution at 65 mL/kg BW over the first hour of treatment. Calves therefore received approximately 80 mL/kg BW of intravenous fluid during the first hour; after this time maintenance fluid therapy was administered using 0.9% NaCl at 20 mL/kg/day. Calves also received a 100 mL IV infusion of a solution1containing amino acids, vitamins (Vitamins B1, B2, B6, B12, nicotinamide, dexpanthenol) and electrolytes (calcium chloride hexahydrate, magnesium sulphate heptahydrate, and potassium chloride), and anhydrous dextrose each day. Intravenous fluids were warmed to 38 °C in a heated water bath immediately before infusion. Hypothermic calves were placed under an infra-red heat lamp to provide external warmth. Calves were fed fresh 500 mL of warmed cow's milk by ororuminal intubation three times a day (total of 1.5 L/day) for the first 72 h, then 2.0 L twice a day. This was based on recent recommendations to feed a trophic/hypocaloric diet to critically ill patients of up to 70% of target caloric goals for at least the first 48 h of treatment (Rhodes et al., 2017).
Antimicrobial and anti-inflammatory treatment were instituted using ceftiofur2(2.2 mg/kg BW, IM, q 12 h) and meloxicam3(0.5 mg/kg Table 1
Comparison of body weight, physiologic variables, selected cardiovascular variables and echocardiographic indices in 10 healthy and 20 septic calves, with data being expressed as median and range in parentheses. Please see text for explanation of abbreviations.
Variable Healthy calves Septic calves P-value
Body weight (kg) 32.9 (24.6–45.5) 34. 5 (26.0–50.0) 0.71 Heart rate (beats/min) 130 (110–140) 114 (50–170) 0.25 Rectal temperature (°C) 38.8 (38.6–38.0) 35.1 (32.0–38.0) < 0.001 Respiratory rate (breaths/min) 24 (16–30) 34 (12–80) 0.13 Systolic arterial pressure
(mm Hg) 126 (110–165) 77 (60–109) < 0.001 Mean arterial pressure
(mm Hg) 93 (79–132) 54 (46–66) < 0.001 Diastolic arterial pressure
(mm Hg) 77 (64–116) 43 (27–57) < 0.001 Measured echocardiographic indices
IVSd (cm) 0.63 (0.54–0.85) 0.84 (0.44–1.34) 0.0093 IVSs (cm) 0.92 (0.74–1.07) 1.11 (0.61–1.57) 0.022 LVIDd (cm) 3.77 (3.35–4.56) 2.16 (1.25–3.51) < 0.001 LVIDs (cm) 2.71 (2.00–3.50) 1.41 (0.23–3.04) < 0.001 LVFWd (cm) 0.86 (0.67–1.48) 1.54 (0.64–2.36) 0.0075 LVFWs (cm) 1.32 (1.11–1.78) 1.91 (0.74–3.12) 0.028 EPSS (cm) 0.50 (0.41–0.70) 0.25 (0–0.87) 0.0047 PEP (s) 0.05 (0.03–0.07) 0.06 (0.05–0.09) 0.023 LVET (s) 0.19 (0.17–0.21) 0.23 (0.12–0.69) 0.14 Calculated echocardiographic indices
LVEDV (mL) 61 (46–90) 19 (4–51) < 0.001 LVEDVI (mL/kg) 1.91 (1.08–2.50) 0.58 (0.08–1.60) < 0.001 LVESV (mL) 27 (13–41) 6 (1–36) < 0.001 LVESVI (mL/kg) 0.82 (0.30–1.03) 0.16 (0.01–1.13) < 0.001 SV (mL) 35 (27–49) 13 (3–37) < 0.001 SVI (mL/kg) 1.13 (0.76–1.52) 0.40 (0.07–1.09) < 0.001 CO (L/min) 4.77 (3.23–6.02) 1.31 (0.29–3.32) < 0.001 CI (mL/min/kg) 131 (106–197) 41 (8–98) < 0.001 EF (%) 58 (50–72) 67 (29–99) 0.040 FS (%) 30 (23–40) 35 (13–82) 0.048 PEP to LVET 0.26 (0.15–0.33) 0.28 (0.07–0.58) 0.84 LVETHR(s) 0.26 (0.24–0.29) 0.29 (0.22–0.72) 0.13 Vcf (%/s) 1.60 (1.11–2.26) 1.55 (0.30–3.58) 0.87 VcfHR(%/s) 1.40 (1.03–1.77) 1.42 (0.55–0.72) 0.54
1Duphalyte® solution, Zoetis, London, United Kingdom. 2Ceftivil, Vilsan, Istanbul, Turkey.
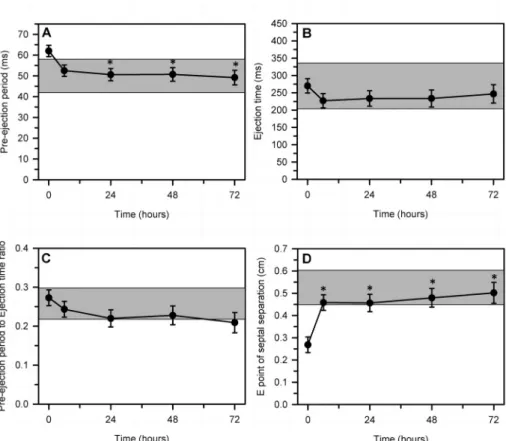
Fig. 3. Changes in echocardiographically de-termined left ventricular end-diastolic index and end-systolic volume index (panel A), stroke volume index (panel B), heart rate (panel C), cardiac index (panel D), systolic, mean, and diastolic arterial pressure (panel E), and ejection fraction (panel F) over 72 h after the start of a standardized treatment protocol in 20 septic calves. Data are presented as least squares mean and SE. The number of calves alive at each measurement time were 20 at 0 and 6 h, 17 at 24 h, 14 at 48 h, and 12 at 72 h. The gray shaded rectangle is the 95% confidence interval for the mean value for 10 healthy calves of similar age and body weight (Panel A, mean value for end-dia-stolic volume; Panel E, mean value for mean arterial pressure). *P < .0125 compared to time = 0 h value.
Table 2
Spearman correlation coefficients of selected cardiovascular variables and echocardiographic indices in 20 septic calves. Please see text for explanation of ab-breviations.
Variable HR LVEDVI LVESVI EF SV SVI CI EPSS ET PEP PEP/ET MAP HR 1 −0.53⁎ −0.40 0.22 −0.53⁎ −0.48⁎ 0.03 −0.39 −0.87⁎⁎ −0.11 0.70⁎⁎ 0.12 LVEDVI 1 0.87⁎⁎ −0.54⁎ 0.94⁎⁎ 0.95⁎⁎ 0.71⁎⁎ 0.71⁎⁎ 0.31 0.19 −0.18 −0.09 LVESVI 1 −0.86⁎⁎ 0.76⁎⁎ 0.77⁎⁎ 0.56⁎ 0.80⁎⁎ 0.30 −0.01 −0.28 0.15 EF 1 −0.36 −0.38 −0.23 −0.62⁎⁎ −0.20 0.27 0.31 −0.36 SV 1 0.96⁎⁎ 0.77⁎⁎ 0.58⁎⁎ 0.32 0.28 −0.14 −0.31 SVI 1 0.80⁎⁎ 0.62⁎⁎ 0.26 0.32 −0.07 −0.19 CI 1 0.38 −0.24 0.28 0.35 −0.33 EPSS 1 0.42 0.19 −0.32 0.06 ET 1 −0.04 −0.91⁎⁎ −0.17 PEP 1 0.41 −0.40 PEP/ET 1 −0.06 MAP 1 ⁎ P < .01. ⁎⁎ P < .001.
BW, IV, 24 h), respectively. Oxygen (100 mL/kg BW/min) was applied via a nasal oxygen mask to calves with SpO2< 90%. Vasopressor therapy was administered to the two hypotensive calves (SAP < 90 mm Hg or MAP < 65 mm Hg), despite one bolus of fluid therapy, by infusing norepinephrine (10 μg/kg BW/min) for sixty minutes, at which time SAP and MAP were measured and the need for continued vasopressor administration determined.
2.3. Echocardiography
Echocardiography was performed using a special echocardiography table as soon as possible after admission and 6, 24, 48 and 72 h later in septic calves and once in healthy calves. Calves were gently restrained in right lateral recumbency. The right thoracic area was clipped and ultrasonographic gel applied. Transthoracic echocardiographic ex-amination was performed using an echocardiographic unit and a 4.0 to 7.0 MHz sector probe4. M-mode echocardiographic examinations of the left ventricle were performed using a right parasternal long-axis view (5
chamber left ventricular outflow view) and right parasternal short-axis view at the level of the papillary muscles as described (Amory et al., 1991;Michima et al., 2007). Echocardiographic indices were obtained as the mean of measurements from 3 nonconsecutive cardiac cycles for each calf. Heart rate was determined at the same time as echocardio-graphy using a base-apex or lead II electrocardiogram5(Trefz et al., 2018).
2.4. Measured echocardiographic indices
M-mode echocardiography was used to determine the following dimensions: left ventricular internal diameter in diastole (LVIDd), left ventricular internal diameter in systole (LVIDs), intraventricular septal wall thickness in diastole (IVSWd), intraventricular septal wall thick-ness in systole (IVSWs), left ventricular free wall thickthick-ness in diastole (LVFWd), left ventricular free wall thickness in systole (LVFWs). The pre-ejection period (PEP) in ms was measured as the time interval be-tween the start of the QRS complex on the ECG and the opening of the aortic valve as detected by echocardiography. The ejection time (ET) in ms was measured by positioning the M-mode cursor over the aortic valve and measuring the time interval between opening and closing of the aortic valve and therefore the duration of ejection from the left ventricle (Boon et al., 1983;Slack et al., 2012;Fig. 1). The E-point to septal separation (EPSS) distance was measured by positioning the M-mode cursor over the mitral valve and measuring the distance between the E-point of the mitral valve and the most posterior point of the in-terventricular septum at end-diastole (Fig. 2).
2.5. Calculated echocardiographic indices
The echocardiographic software program applied the Teichholz method to calculate LVEDV and LVESV from the LVIDd and LVIDs, whereby LVEDV = 7 × (LVIDd)3/(2.4 + LVIDd), and LVESV = 7 × (LVIDs)3/ (2.4 + LVIDs). Currently, there is no generally accepted consensus on how to quantify LV size in large animals (Schwarzwald, 2019). The Teichholz method has not been validated in conscious calves but was used in a pre-vious study in conscious calves (Michima et al., 2007). Moreover, LVIDd and LVIDs measurements have a lower CV in the calf than ultrasonographic measurements of LV long axis length (Amberger, 2009), suggesting that the Teichholz method for estimating SV would have the greatest reproduci-bility, and was used in this study on this basis. Stroke volume (SV) was calculated as the difference between LVEDV and LVESV. Ejection fraction (EF) was calculated as the SV expressed as a percentage of the LVEDV. Fractional shortening (FS) was calculated as FS = (LVIDd − LVIDs) × 100/ LVIDd. Left ventricular volume indices, stroke volume and cardiac output were indexed to bodyweight to assist comparison with other studies.
The ratio of PEP to LVET was calculated to correct both indices for changes in heart rate. The LVET was corrected for changes in heart rate (LVETHR) using the following equation: LVETHR= LVET + (0.00055 × HR) where LVET was measured in units of seconds and HR in beats/min (Atkins and Snyder, 1992). The velocity of circumferential fiber shortening (Vcf), a systolic index that represents how fast the LV shortens, was calculated as: Vcf = (LVIDd − LVIDs)/(LVIDd × ET) = FS/(100 × ET) (Atkins and Snyder, 1992;Borde et al., 2014). The Vcf was corrected for changes in heart rate (VcfHR) as: VcfHR= Vcf × 110/HR (Boon, 2011) with the units for VcfHRremaining as %/s.
2.6. Pulse oximetry
Tissue oxygenation was determined by placing the clamp probe of a pulse oximeter5to an unpigmented portion of the buccal mucosa of the calf. The probe was used to measure oxygen saturation of the buccal mucosa (ie, O2saturation measured by use of pulse oximetry [SpO2]). Table 3
Comparison of selected physiologic, acid-base, biochemical, and hematologic variables in 10 healthy and 20 septic calves, with data being expressed as median and range in parentheses. Please see text for explanation of abbrevia-tions.
Variable Healthy calves Septic calves P-value
Acid-base pH 7.39 (7.35–7.42) 6.95 (6.80–7.25) < 0.001 Pco2(mm Hg) 46 (37–47) 53 (28–67) 0.065 Po2(mm Hg) 33 (30–35) 24 (13–47) 0.036 HCO3(mmol/L) 28.5 (20.4–33.6) 11.9 (5.2–26.4) < 0.001 BEb (mmol/L) 3.9 (1.6–8.0) −19.9 (−26.2 to −2.7) < 0.001 Oximetry Saturation O2(%) 71 (65–77) 18 (6–74) < 0.001 Biochemical analysis L-lactate (mmol/L) 1.2 (0.5–2.2) 3.4 (0.4–15.0) < 0.001 Glucose (mg/dL) 83 (46–103) 72 (5–222) 0.51 Na (mmol/L) 146 (143–152) 142 (127–159) 0.11 K (mmol/L) 4.0 (3.4–4.4) 6.2 (4.0–9.4) < 0.001 Urea nitrogen (mg/dL) 7 (3–17) 53 (19–111) < 0.001 Creatinine (mg/dL) 1.2 (0.7–1.6) 3.3 (0.8–9.9) < 0.001 Albumin (g/dL) 3.5 (2.9–4.0) 3.7 (2.1–4.4) 0.30 Total Protein (g/dL) 6.0 (5.0–7.5) 5.6 (3.1–9.7) 0.16 AST (U/L) 46 (39–76) 101 (2–361) < 0.001 ALT (U/L) 13 (10−22) 38 (8–92) < 0.001 ALP (U/L) 404 (233–877) 572 (113−1320) 0.33 GGT (U/L) 63 (43–97) 66 (0–1064) 0.80 Hematologic analysis Erythrocytes (×103cells/mL) 8.2 (6.1–9.9) 10.3 (5.8–13.4) 0.005 Hematocrit (vol%) 29 (17–36) 39 (20–59) 0.002 Hemoglobin (g/dL) 11.2 (6.6–13.7) 13.7 (6.8–19.2) 0.028 MCV (fL) 35.1 (27.2–38.9) 37.3 (33.5–46.5) 0.006 MCH (pg) 13.4 (10.8–14.2) 12.9 (10.6–15.4) 0.92 MCHC (g/dL) 38.1 (36.4–40.4) 34.7 (28.3–36.9) < 0.001 Leukocytes (cells/mL) 8.9 (6.5–12.0) 17.8 (4.3–39.4) < 0.001 Granulocytes (cells/mL) 2.9 (1.4–3.2) 12.3 (2.4–37.9) < 0.001 Lymphocytes (cells/mL) 2.4 (1.3–4.5) 3.7 (1.3–23.5) 0.091 Monocytes (cells/mL) 0.36 (0.19–0.54) 0.57 (0.23–1.39) 0.014 Platelets (cells/mL) 407 (180–771) 313 (93–1272) 0.65
4Shantou Institute of Ultrasonic Instruments Veterinary Digital Color Doppler Ultrasound Imaging System, Model: Apogee 3500V. Shantou, Guangdong,
Pulse oximetry measurements of buccal or vaginal mucosa have been validated in neonatal calves (Norton et al., 1996) but cannot be ob-tained from the tail or ears of calves because of pigmentation (Uystepruyst et al., 2000;Wittek et al., 2004).
2.7. Blood pressure measurement
Mean arterial pressure, SAP, and diastolic arterial pressure (DAP) were measured indirectly using an oscillometric technique5and a cuff on the coccygeal artery, with the cuff width ranging from 25 to 40% of the tail circumference (Geddes et al., 1977). The accuracy of this method in the calf has been investigated elsewhere (Kuckenberg, 2008). The calf was restrained in lateral recumbency for this measurement; consequently, measured pressures were not corrected for the distance between the cuff on the coccygeal artery and the right atrium (Smith et al., 2002).
2.8. Laboratory analysis
Blood gas analysis (pH; partial pressure of carbon dioxide, [Pco2] and oxygen [Po2]) was performed with a blood gas and pH analyzer6 and the values corrected for rectal temperature using standard algo-rithms (Trefz et al., 2017). Plasma bicarbonate concentration and ex-tracellular base excess value were calculated using standard equations (Trefz et al., 2017). Plasma sodium and potassium concentrations were measured via ion-selective potentiometry, and glucose and L-lactate concentrations was measured by glucose oxidase and lactate oxidase methods,6 respectively. Serum albumin concentration (bromcresol green assay) and total protein concentration (Biuret colorimetric assay) were measured in serum samples by use of a commercially available kit7 and a spectrophotometer.8All other biochemical analyses (urea
nitrogen, creatinine, albumin and total protein concentrations, AST, ALT, ALP, and GGT activities) were performed using spectro-photometric methods.9A automatic analyzer10was used for hemato-logic analysis.
2.9. Statistical analysis
Statistical analyses were performed using statistical software11and
P < .05 was considered significant. The Mann-Whitney U test was used
to compare variables for healthy and septic calves on admission, with admission data being expressed as median and range. Spearman's rho was used to characterize the curvilinear association between echo-cardiographic indices, heart rate, and mean arterial pressure on ad-mission for septic calves. Mixed-models ANOVA was used to detect the main effect of time on studied variables for septic calves, with time included in the model as a repeated variable. An autoregressive (1) covariance structure was used based on the lowest value for Akaike's information criterion. Whenever the F-test for time was significant, Bonferroni-adjusted P-values (P < .0125) were used to identify sig-nificant differences from the admission value. Data for septic calves were presented graphically as least squares mean and SEM because of ongoing calf mortality during the 72 h recording period. Data for healthy calves were presented graphically as mean and 95% confidence interval for the mean.
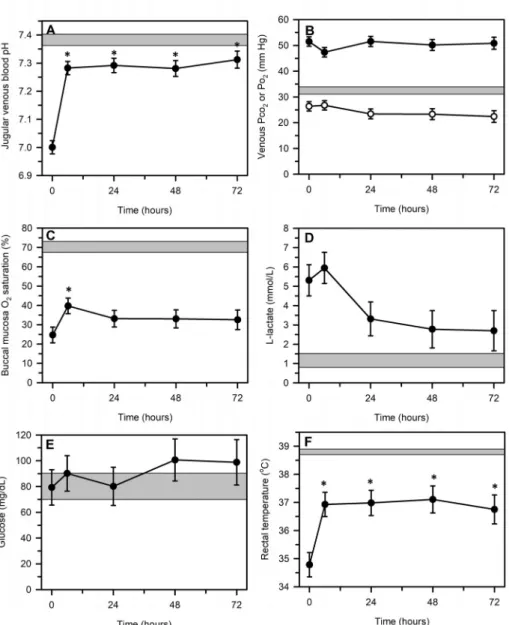
Fig. 4. Changes in echocardiographically de-termined indices of left ventricular systolic perfor-mance, including pre-ejection period (panel A), ejection time (panel B), pre-ejection period to ejec-tion time ratio (panel C), and distance at the E point of septal separation (panel D) over 72 h after the start of a standardized treatment protocol in 20 septic calves. Data are presented as least squares mean and SE. The number of calves alive at each measurement time were 20 at 0 and 6 h, 17 at 24 h, 14 at 48 h, and 12 at 72 h. The gray shaded rectangle is the 95% confidence interval for the mean value for 10 healthy calves of similar age and body weight. *P < .0125 compared to time = 0 h value.
6GEM Premier Plus, Instrumentation Laboratory, Lexington, Mass, USA. 7Spinreact, Spinreact SA, Olot, Spain.
8Shimadzu-UV-2100, Analytical Instruments Division, Shimadzu Corp,
(footnote continued) Kyoto, Japan.
9BT3000 plus automatic analyzer machine, Biotechnica Instruments S.p.A., Rome, Italy.
10Medonic CA 530 Thor Model Coulter Counter, Medonic AB, Sweden. 11PROC NPAR1WAY, PROC CORR, PROC MIXED, SAS 9.4, SAS Inst. Cary, NC, USA.
3. Results
3.1. Animals
Twenty calves (Holstein, 9; Brown Swiss, 7; Simmental, 3; Southeast Anatolian Red, 1; 9 male and 11 female) aged 1 to 15 days (mean, 8.5 ± 3.7) and weighing 26 to 50 kg (mean, 34.8 ± 5.6 kg) met the criteria for sepsis and enrollment in the study. Calves appeared dehy-drated on admission, based on the presence of eye recession into the orbit, prolonged skin tent duration in the cervical region, and tacky mucous membranes. Hypotension (SAP < 90 mm Hg or MAP < 65 mm Hg) was present in all calves at the time of admission. All septic calves appeared stuporous and had varying degrees of cya-notic mucosal membranes and prolonged capillary refill time. Two of the 20 calves had septic shock. Eight calves (40%) died during the first 72 h of hospitalization during the time of intensive treatment and monitoring. A total of 19 calves (95%) died during hospitalization; 3 of which died after 6 h, 3 died after 24 h, 2 died at 48 h, and 11 died after 72 h of treatment.
3.2. Echocardiography and blood pressure on admission
Decreased preload and decreased afterload were present in septic
calves, as indicated by marked decreases in LVEDVI, LVESVI SVI, and CI, a slight increase in PEP, and a decrease in systolic, mean, and dia-stolic BP when compared to healthy calves (Table 1,Fig. 3). There was no difference in heart rate, LVET, LVETHR, PEP:LVET, Vcf, and VcfHR between septic and health calves. The EF and FS were slightly increased in septic calves compared to control calves. Tissue oxygenation was markedly decreased on admission in septic calves as measured by buccal oximetry.
There were positive associations on admission between CI and LVEDVI, LVESVI, and SVI (Table 2); however, CI was not associated with heart rate or other echocardiographic variables of systolic per-formance, such as EF, EPSS, ET, PEP, or the PEP:ET. Mean BP was not associated with any echocardiographic variables on admission.
3.3. Acid-base, biochemical, and hematologic differences on admission
Septic calves were profoundly acidemic on admission (Table 3; Fig. 5). Acidemia was primarily due to a strong ion acidosis, based on similar jugular venous values for Pco2 as well as albumin and total protein concentrations, markedly decreased base excess value, and in-creased L-lactate, urea nitrogen, and creatinine concentrations. The plasma glucose concentration was more variable in septic calves on admission than healthy calves, but mean glucose concentrations were Fig. 5. Changes in selected jugular venous blood and plasma variables, and physical examination findings, including blood pH (panel A), blood Pco2 (filled circles) and Po2(open circles), buccal mucosa oxi-metry (% saturation; panel C), plasmaL-lactate con-centration (panel D), plasma glucose concon-centration (panel E) and rectal temperature (panel F) over 72 h after the start of a standardized treatment protocol in 20 septic calves. Data are presented as least squares mean and SE. The number of calves alive at each measurement time were 20 at 0 and 6 h, 17 at 24 h, 14 at 48 h, and 12 at 72 h. The gray shaded rectangle is the 95% confidence interval for the mean value for 10 healthy calves of similar age and body weight (Po2 in panel B). *P < .0125 compared to time = 0 h value.
similar for both groups. Serum aspartate aminotransferase and ALT activities were increased in septic calves on admission.
Septic calves appeared to be dehydrated at admission, based on the presence of erythrocytosis and increased hematocrit and blood he-moglobin concentration when compared to healthy calves (Table 3). Mean corpuscular volume was increased in septic calves, consistent with cellular edema. Septic calves also had a leukocytosis that was most likely due to neutrophilia, as the blood analyzer does not differentiate between neutrophils, eosinophils, and basophils.
3.4. Response to treatment
The LVEDVI, LVESVI, SVI, CI, and SAP, MAP, DAP significantly increased is septic calves within the first 6 h of initiating treatment (Fig. 3). However, LVEDVI, SVI, and CI remained low and failed to reach the mean value for healthy calves despite ongoing fluid therapy (Fig. 3). Mean arterial pressure increased within the first 6 h of treat-ment and approximated that of healthy calves by 48 h after the start of treatment.
The EPSS increased and the PEP decreased within the first 6 h of treatment and then remained similar to that of healthy calves until 72 h (Fig. 4). In contrast, there was no main effect of time during the 72 h treatment period for LVET (F test, P = .96; Fig. 4), LVETHR (F test,
P = .98), PEP:ET (F test, P = .23;Fig. 4), Vcf (F test, P = .46), or VcfHR (F test, P = .98). In all cases, the values of the systolic function indices for septic calves approximated those for healthy calves.
Jugular venous blood pH increased within 6 h of treatment to ap-proximately 7.30 but remained lower than healthy calves throughout the 72 h treatment period (Fig. 5). Venous blood Pco2and Po2remained unchanged for 72 h, with blood Pco2and Po2being higher and lower, respectively, than the mean value in healthy calves. Buccal mucosa SpO2in septic calves remained much lower than that of healthy calves for the duration of treatment, with a transient increase at 6 h after the start of treatment that was not sustained. Rectal temperature increased from 6 to 72 h after the start of treatment but did not reach the mean value for healthy calves.
Hyperlactatemia was sustained during the 72 h treatment period with no significant change over time (Fig. 5). Plasma glucose con-centration was also unchanged during treatment, with least squares mean concentration ranging from 80 to 101 mg/dL. Serum creatinine and urea nitrogen concentrations also remained unchanged during treatment (data not shown).
4. Discussion
The results of transthoracic echocardiography, indirect hemody-namic measurement, and pulse oximetry of buccal mucosa, combined with the presence of sustained hypothermia, hyperlactatemia and azotemia, indicated that circulatory dysfunction and impaired meta-bolism, rather than systolic dysfunction, predominated in the septic neonatal calves in this study. These findings were consistent with those observed in neonatal calves with experimentally-induced endotoxemia (Constable et al., 1991;Constable, 1999) and are suggestive of mal-distribution of venous blood (relative hypovolemia) (Anderson et al., 1979;Ellman, 1984) and impaired cellular metabolism.
The calculated LVEDVI and LVESVI indicated that an absolute or relative decrease in central blood volume (Rackow and Astiz, 1993) was an important cardiovascular derangement in septic calves. Expansion of the extracellular fluid volume by the intravenous and oral administra-tion of sodium containing fluids appeared inadequate in this study to address the lack of preload, as assessed by values for LVEDVI after admission. This observation suggested that periodic echocardiographic determination of LVEDVI, SVI, and CI would likely be clinically bene-ficial in optimizing the rate of intravenous fluid administration in septic calves. Interestingly, as demonstrated in critically ill human adults (Jardin et al., 1990;Vieillard-Baron et al., 2003), EF was not a useful
index of systolic performance in this case series, as there was no dif-ference in EF between healthy and septic calves. The most likely rea-sons for this was the decreased LV afterload (decreased LVESVI) and decreased LV preload (decreased LVEDVI) in septic calves. Persistent vasoplegia might be another explanation for our finding. Thus, normal LVEF may be observed in septic calves, in whom arterial tone is usually decreased. Consequently, LVEF may be considered more as a “marker” of reduced vascular tone than of intrinsic LV contractility in septic calves. The positive associations on admission between CI and LVEDVI, LVESVI, and SVI support this conclusion.
Systolic time interval indices (PEP, ET, PEP:ET) have been shown to be as accurate as invasive methodology for the assessment of LV per-formance in humans (Thomas and Popović, 2006). In the present study, the PEP was prolonged in septic calves on admission, probably because of the marked decrease in LVEDV. An increase in LVEDV due to in-travenous fluid administration after administration was the most likely reason for the subsequent decrease in PEP. Moreover, during treatment, the PEP, ET, and PEP:ET of septic calves approximated that of healthy calves, despite the inadequate preload. These findings suggest that these three systolic time intervals are not clinically useful indices of systolic performance in septic calves. Large variability in M-mode measured ET has been observed in foals and attributed to challenges with obtaining a suitable acoustic window to clearly visualize both the opening and closing of the aortic valve (Slack et al., 2012). Similar challenges were encountered when ET was measured in neonatal calves. Based on our findings, it would be better to evaluate systolic time interval indices using aortic or pulmonary Doppler flow recordings or tissue Doppler imaging of the left ventricular wall motion.
Our median echocardiographic values for 10 healthy Holstein calves were similar to mean values reported elsewhere for 25 Holstein calves aged 8 to 28 days old and weighing 27 to 57 kg: FS = 36%, EF = 65%, EPSS = 0.65 cm, LVEDVI = 1.69 mL/kg, LVESVI = 0.62 mL/kg, SV = 1.06 mL/kg, CI = 96 mL/min/kg (Michima et al., 2007). In con-trast, our estimated median value for LVET of 190 ms for healthy calves was less than half of the mean value (390 ms) reported elsewhere (Michima et al., 2007). This could be explained by high HR (mean, 130 beats/min) of healthy calves, because the healthy calves were re-strained in lateral recumbency.
Echocardiographic measurement of LV dimensions in diastole and systole in healthy calves in this study identified a median LVEDVI of 1.91 mL/kg and a median CI of 131 mL/min/kg. Previous studies in a co-author's laboratory identified mean LVEDVI of 2.57 mL/kg de-termined using a conductance catheter, and a mean CI of 164 mL/min/ kg determined using thermodilution in chloralose-anesthetized calves (Constable, 1999). Other studies of standing or sternally recumbent awake neonatal Holstein calves in our laboratory identified mean CI determined by thermodilution to be 139 mL/min/kg (Lewis et al., 1999), 186 mL/min/kg (Mathur et al., 2001), and 222 mL/min/kg (Walker et al., 1998). Left ventricular volumes in the study reported here were calculated using the Teichholz method, which has not been validated for calves. Comparing CI values determined using echo-cardiography and thermodilution in calves, echoecho-cardiography appears to underestimate CI when calculated from the LV dimensions using the Teichholz method. The velocity time integral of the pulsed-wave Dop-pler signal of the pulmonary artery provides an alternative method of calculating SV than the Teichholz method but is challenging to obtain in foals (Slack et al., 2012) and calves because of the limited acoustic window. In addition, echocardiographic determination of the variation in posterior vena caval diameter with respiration provides clinically useful information regarding fluid responsiveness in critically ill hu-mans, particularly those being ventilated (Bednarczyk et al., 2017; Griffee et al., 2010;McLean, 2016;).
An unanticipated finding in this study was that septic calves did not have a higher heart rate than healthy calves for the first 24 h of treat-ment, despite the presence of systemic hypotension that would have activated aortic and carotid artery baroreceptors. The lower than
expected heart rate in septic calves on admission was likely due to hypothermia as their mean rectal temperature was 3.7oC below that of healthy calves. Another potential reason was hyperkalemia-induced bradycardia, as 14 septic calves had a high serum potassium con-centration on admission (> 5.8 mmol/L) (Table 1,Table 3). However, bradycardia and bradyarrhythmias are not present in most calves with hyperkalemia, and there is no association between heart rate and plasma potassium concentration in diarrheic calves (Trefz et al., 2018). The high overall mortality rate (95%) was most likely due to the severity of the diarrhea and the severe sepsis and septic shock and their consequences. However, the mortality rate during the first 72 h of treatment when calves were more intensively monitored was lower at 40%. Septic calves in this study were fed fresh milk at approximately 4.3% BW each day for the first 3 days of the study. This nutritional level was below that typically fed daily to dairy calves (10 to 12% BW), and undernutrition may have contributed to the high overall mortality rate after 72 h of treatment. Larger daily volumes of milk were not fed in-itially because of concerns related to abdominal distention and ileus being common in critically-ill calves and associated with increased mortality (Trefz et al., 2017), and because of personal experiences that feeding larger volumes of milk to septic calves can lead to abdominal bloating.
Hyperlactatemia is a well-established proxy for a cellular metabolic abnormality and a biomarker of tissue hypoxia, disease severity and mortality in human and veterinary medicine (Kraut and Madias, 2016; Shankar-Hari et al., 2016). Measurement of blood L-lactate concentra-tion has attracted increasing attenconcentra-tion in bovine medicine due to the widespread availability and validation of inexpensive and portable L-lactate analyzers (Karapinar et al., 2013;Trefz et al., 2017;Trefz et al., 2018;Wittek et al., 2004).Yildiz et al. (2017)found that blood lactate levels with a cut-off value up to 7.5 mmol/L have prognostic im-portance in calves with respiratory distress syndrome. However, the change in blood L-lactate concentration following implementation of treatment is of greater clinical relevance than the actual value on ad-mission. When we evaluated the individual values of blood lactate concentrations of septic calves, there was no difference in the mortality rate between hyperlactatemic calves and those with blood lactate concentrations within the reference range.
Our study has additional limitations. First, the study population was relatively small, although similar in size to early echocardiographic studies in septic humans (Thys et al., 1987). Second, the high overall mortality rate of 95% precluded evaluation of potential prognostic factors. Third, the use of Doppler echocardiography or tissue Doppler echocardiography would have evaluated systolic function more accu-rately than M-mode echocardiography and permitted evaluation of some indices of diastolic function. However, we were interested in examining the clinical utility of using a widely available and basic echocardiographic evaluation of shocked calves (rapid cardiac assess-ment by echo, RACE) instead of an advanced echocardiographic eva-luation using Doppler imaging (McLean, 2016). Fourth, the study fo-cused on evaluating LV systolic function, and marked abnormalities of LV diastolic function or right ventricular function may have been pre-sent. Finally, we employed a standardized treatment protocol that in-volved administration of the plasma volume expander hydroxyethyl starch instead of a goal-directed protocol. International guidelines published in 2017 (Rhodes et al., 2017) after commencement of the study reported here recommended against the use of hydroxyethyl starches for intravascular volume replacement in patients with sepsis or septic shock due to increased risk of death.
We conclude that circulatory dysfunction (decreased preload, manifest by low LVEDVI; decreased afterload, manifest by low LVESVI), rather than systolic dysfunction, was the most clinically important cardiovascular abnormality in septic calves. The positive associations on admission between CI and LVEDVI, LVESVI, and SVI support this conclusion. Echocardiographic monitoring of LVEDVI, LVESVI, and CI appears clinically useful in septic calves.
Off-label antimicrobial declaration
Ceftiofur was administered in an extralabel manner twice a day instead of once a day and to some calves that did not have clinical evidence of respiratory disease.
Declaration of Competing Interest
None.
Acknowledgements
The manuscript has been produced from thesis of Dr. Amir Naseri. This study was supported by the Scientific and Technological Research Council of Turkey (Project number 1130218). Presented, in part in abstract form, at the XXIX World Buiatrics Congress, Dublin, Ireland in 2016.
References
Amberger, M., 2009. Echokardiographische untersuchungen von kälbern der rasse deutsches fleckvieh zur ermittlung von referenzwerten und prüfung des einflusses von xylazin und isofluran auf die herzdimensionen. Doctoral dissertation. Ludwig-Maximillians-Universität München, Germany.
Amory, H., Jakovljevic, S., Lekeux, P., 1991. Quantitative M-mode and two-dimensional echocardiography in calves. Vet. Rec. 128, 25–31.
Anderson, R.R., Holliday, R.L., Driedger, A.A., Lefcoe, M., Reid, B., Sibbald, W.J., 1979. Documentation of pulmonary capillary permeability in the adult respiratory distress syndrome accompanying human sepsis. Am. Rev. Respir. Dis. 119, 869–877.
Angus, D.C., Van der Poll, T., 2013. Severe sepsis and septic shock. N. Engl. J. Med. 369, 840–851.
Atkins, C.E., Snyder, P.S., 1992. Systolic time intervals and their derivatives for evalua-tion of cardiac funcevalua-tion. J. Vet. Intern. Med. 6, 55–63.
Au, S.M., Vieillard-Baron, A., 2012. Bedside echocardiography in critically ill patients: a true hemodynamic monitoring tool. J. Clin. Monit. Comput. 26, 355–360.
Bednarczyk, J.M., Fridfinnson, J.A., Kumar, A., Blanchard, L., Rabbani, R., Bell, D., Funk, D., Turgeon, A.F., Abou-Setta, A.M., Zarychanski, R., 2017. Incorporating dynamic assessment of fluid responsiveness into goal-directed therapy: a systematic review and meta-analysis. Crit. Care Med. 45, 1538.
Berchtold, J., 2009. Treatment of calf diarrhea: intravenous fluid therapy. Vet. Clin. N. Am. Food Anim. Pract. 25, 73–99.
Berrios, R.A.S., O'Horo, J.C., Velagapudi, V., Pulido, J.N., 2014. Correlation of left ven-tricular systolic dysfunction determined by low ejection fraction and 30-day mor-tality in patients with severe sepsis and septic shock: a systematic review and meta-analysis. J. Crit. Care 29, 495–499.
Bone, R.C., Balk, R.A., Cerra, F.B., Dellinger, R.P., Fein, A.M., Knaus, W.A., Schein, R.M., Sibbald, W.J., 1992. Definitions for sepsis and organ failure and guidelines for the use of innovative therapies in sepsis. Chest 101, 1644–1655.
Boon, J., 2011. Evaluation of size, function, and hemodynamics. In: Boon, J.A. (Ed.), Manual of Veterinary Echocardiography, 2nd edn. WB Saunders Co, Philadelphia, pp. 153–256.
Boon, J., Wingfield, W.E., Miller, C.W., 1983. Echocardiographic indices in the normal dog. Vet. Radiol. 24, 214–221.
Borde, L., Amory, H., Grulke, S., Leroux, A.A., Houben, R.M., Detilleux, J., Sandersen, C.C., 2014. Prognostic value of echocardiographic and Doppler parameters in horses admitted for colic complicated by systemic inflammatory response syndrome. J. Vet. Emerg. Crit. Care 24, 302–310.
Boudoulas, H., 1990. Systolic time intervals. Eur. Heart J. 11, 93–104.
Boudoulas, H., Karayannacos, P.E., Lewis, R.P., Leier, C.V., Vasko, J.S., 1982. Effect of afterload on left ventricular performance in experimental animals. Comparison of the pre-ejection period and other indices of left ventricular contractility. J. Med. 13, 373–385.
Bouhemad, B., Nicolas-Robin, A., Arbelot, C., Arthaud, M., Féger, F., Rouby, J.J., 2009. Acute left ventricular dilatation and shock-induced myocardial dysfunction. Crit. Care Med. 37, 441–447.
Chan, C.M., Klinger, J.R., 2008. The right ventricle in sepsis. Clin. Chest Med. 29, 661–676.
Constable, P.D., 1999. Acute endotoxemia increases left ventricular contractility and diastolic stiffness in calves. Shock 12, 391–401.
Constable, P.D., Schmall, L.M., Hoffsis, G.F., Shertel, E.R., 1991. Hemodynamic response of endotoxemic calves to treatment with small-volume hypertonic saline solution. Am. J. Vet. Res. 52, 981–989.
Constable, P.D., Hinchcliff, K.W., Done, S.H., Grünberg, W., 2016. Veterinary Medicine: A Textbook of the Diseases of Cattle, Sheep, Goats and Horses, 11th edition. (St. Louis, MO).
Ellman, H., 1984. Capillary permeability in septic patients. Crit. Care Med. 12, 629–633.
Geddes, L.A., Chaffee, V., Whistler, S.J., Bourland, J.D., Tacker, W.A., 1977. Indirect mean blood pressure in the anesthetized pony. Am. J. Vet. Res. 38 (12), 2055–2057.
Goldstein, B., Giroir, B., Randolph, A., The members of the International Consensus Conference on Pediatric Sepsis, 2005, January. International pediatric sepsis
consensus conference: definitions for sepsis and organ dysfunction in pediatrics. Pediatr. Crit. Care Med. 6, 2–8.
Griffee, M.J., Merkel, M.J., Wei, K.S., 2010. The role of echocardiography in hemody-namic assessment of septic shock. Crit. Care Clin. 26, 365–382.
Groeneveld, A.B.J., Nauta, J.J.P., Thijs, L.G., 1988. Peripheral vascular resistance in septic shock: its relation to outcome. Intensive Care Med. 14, 141–147.
Ho, C.Y., Solomon, S.D., 2006. A clinician's guide to tissue Doppler imaging. Circulation 113, e396–e398.
Huang, S.J., Nalos, M., McLean, A.S., 2013. Is early ventricular dysfunction or dilatation associated with lower mortality rate in adult severe sepsis and septic shock? A meta-analysis. Crit. Care 17, R96.
Jardin, F., Brun-Ney, D.O., Auvert, B., Beauchet, A., Bourdarias, J.P., 1990. Sepsis-related cardiogenic shock. Crit. Care Med. 18, 1055–1060.
Karapinar, T., Kaynar, O., Hayirli, A., Kom, M., 2013. Evaluation of 4 point-of-care units for the determination of bloodL-lactate concentration in cattle. J. Vet. Intern. Med. 27, 1596–1603.
Kraut, J.A., Madias, N.E., 2016. Lactic acidosis: current treatments and future directions. Am. J. Kidney Dis. 68, 473–482.
Kuckenberg, N.R., 2008. Validierung einer nichtinvasiven Methode für die Blutdruckmessung beim Kalb. In: Valuation of a Noninvasive Method for Blood Pressure Measurement in Calf Doctoral Dissertation. der Tierärztlichen Fakultät der Ludwig-Maximilians-Universität München.
Landesberg, G., Gilon, D., Meroz, Y., Georgieva, M., Levin, P.D., Goodman, S., Avidan, A., Beeri, R., Weissman, C., Jaffe, A.S., Sprung, C.L., 2011. Diastolic dysfunction and mortality in severe sepsis and septic shock. Eur. Heart J. 33, 895–903.
Lee, W.L., Slutsky, A.S., 2010. Sepsis and endothelial permeability. N. Engl. J. Med. 363, 689.
Levy, M.M., Fink, M.P., Marshall, J.C., Abraham, E., Angus, D., Cook, D., Cohen, J., Opal, S.M., Vincent, J.L., Ramsay, G., 2003. 2001 sccm/esicm/accp/ats/sis international sepsis definitions conference. Intensive Care Med. 29, 530–538.
Lewis, C.A., Constable, P.D., Huhn, J.C., Morin, D.E., 1999. Sedation with xylazine and lumbosacral epidural administration of lidocaine and xylazine for umbilical surgery in calves. J. Am. Vet. Med. Assoc. 214, 89–95.
Lıghtowler, C., Pıccıone, G., Fazıo, F., Pıdal, G., Cattáneo, M.L., 2003. Systolic time in-tervals assessed by 2-D echocardiography and spectral Doppler in the horse. Anim. Sci. J. 74, 505–510.
Martin, G.S., Mannino, D.M., Eaton, S., Moss, M., 2003. The epidemiology of sepsis in the United States from 1979 through 2000. N. Engl. J. Med. 348, 1546–1554.
Mathur, S., Constable, P.D., Eppley, R.M., Tumbleson, M.E., Smith, G.W., Tranquilli, W.J., Morin, D.E., Haschek, W.M., 2001. Fumonisin B1 increases serum sphinganine con-centration but does not alter serum sphingosine concon-centration or induce cardiovas-cular changes in milk-fed calves. Toxicol. Sci. 60, 379–384.
McLean, A.S., 2016. Echocardiography in shock management. Crit. Care 20, 275.
Michima, L.E., Leal, M.L., Bertagnon, H.G., Fernandes, W.R., Benesi, F.J., 2007. Avaliação ecocardiográfica em bezerros da raça Holandesa. Pesqui. Vet. Bras. 27, 481–486.
Nikitin, N.P., Loh, P.H., de Silva, R., Ghosh, J., Khaleva, O.Y., Goode, K., Rigby, A.S., Alamgir, F., Clark, A.L., Cleland, J.G., 2006. Prognostic value of systolic mitral an-nular velocity measured with Doppler tissue imaging in patients with chronic heart failure caused by left ventricular systolic dysfunction. Heart 92, 775–779.
Norton, J., Munro, J., Taylor, P., Jackson, P., 1996. Pulse oximetry for assessing oxygen status of neonatal calves. Vet. Rec. 138, 340.
Ozier, Y., Guéret, P., Jardin, F., Farcot, J.C., Bourdarias, J.P., Margairaz, A., 1984. Two-dimensional echocardiographic demonstration of acute myocardial depression in septic shock. Crit. Care Med. 12, 596–599.
Parker, M.M., Shelhamer, J.H., Bacharach, S.L., Green, M.V., Natanson, C., Frederick, T.M., Damske, B.A., Parrillo, J.E., 1984. Profound but reversible myocardial de-pression in patients with septic shock. Ann. Intern. Med. 100, 483–490.
Porter, T.R., Shillcutt, S.K., Adams, M.S., Desjardins, G., Glas, K.E., Olson, J.J., Troughton, R.W., 2015. Guidelines for the use of echocardiography as a monitor for therapeutic
intervention in adults: a report from the American Society of Echocardiography. J. Am. Soc. Echocardiogr. 28, 40–56.
Rackow, E.C., Astiz, M.E., 1993. Mechanisms and management of septic shock. Crit. Care Clin. 9, 219–237.
Reant, P., Dijos, M., Donal, E., Mignot, A., Ritter, P., Bordachar, P., Dos Santos, P., Leclercq, C., Roudaut, R., Habib, G., Lafitte, S., 2010. Systolic time intervals as simple echocardiographic parameters of left ventricular systolic performance: correlation with ejection fraction and longitudinal two-dimensional strain. Eur. J. Echocardiogr. 11, 834–844.
Repessé, X., Charron, C., Vieillard-Baron, A., 2013. Evaluation of left ventricular systolic function revisited in septic shock. Crit. Care 17, 164.
Rhodes, A., Evans, L.E., Alhazzani, W., Levy, M.M., Antonelli, M., Ferrer, R., Kumar, A., Sevransky, J.E., Sprung, C.L., Nunnally, M.E., Rochwerg, B., 2017. Surviving sepsis campaign: international guidelines for management of sepsis and septic shock: 2016. Intensive Care Med. 43, 304–377.
Schwarzwald, C.C., 2019. Equine echocardiography. Vet. Clin. 35, 43–64.
Shankar-Hari, M., Phillips, G.S., Levy, M.L., Seymour, C.W., Liu, V.X., Deutschman, C.S., Angus, D.C., Rubenfeld, G.D., Singer, M., 2016. Developing a new definition and assessing new clinical criteria for septic shock: for the Third International Consensus Definitions for Sepsis and Septic Shock (Sepsis-3). Jama 315, 775–787.
Slack, J., Durando, M.M., Belcher, C.N., Collins, N., Palmer, L., Ousey, J., Birks, E.K., Marr, C.M., 2012. Intraoperator, intraobserver and interoperator variability of echocardiographic measurements in healthy foals. Equine Vet. J. 44, 69–75.
Smith, G.W., Constable, P.D., Foreman, J.H., Eppley, R.M., Waggoner, A.L., Tumbleson, M.E., Haschek, W.M., 2002. Cardiovascular changes associated with intravenous administration of fumonisin B1 in horses. Am. J. Vet. Res. 63, 538–545.
Thomas, J.D., Popović, Z.B., 2006. Assessment of left ventricular function by cardiac ultrasound. J. Am. Coll. Cardiol. 48, 2012–2025.
Thys, D.M., Hillel, Z., Goldman, M.E., Mindich, B.P., Kaplan, J.A., 1987. A comparison of hemodynamic indices derived by invasive monitoring and two-dimensional echo-cardiography. Anesthesiology 67, 630–634.
Trefz, F.M., Lorenz, I., Lorch, A., Constable, P.D., 2017. Clinical signs, profound acidemia, hypoglycemia, and hypernatremia are predictive of mortality in 1,400 critically ill neonatal calves with diarrhea. PLoS One 12, e0182938.
Trefz, F.M., Lorenz, I., Constable, P.D., 2018. Electrocardiographic findings in 130 hos-pitalized neonatal calves with diarrhea and associated potassium balance disorders. J. Vet. Intern. Med. 32, 1447–1461.
Uystepruyst, C.H., Coghe, J., Bureau, F., Lekeux, P., 2000. Evaluation of accuracy of pulse oximetry in newborn calves. Vet. J. 159, 71–76.
Vieillard-Baron, A., Prin, S., Chergui, K., Dubourg, O., Jardin, F., 2003. Hemodynamic instability in sepsis: bedside assessment by Doppler echocardiography. Am. J. Respir. Crit. Care Med. 168, 1270–1276.
Vieillard-Baron, A., Caille, V., Charron, C., Belliard, G., Page, B., Jardin, F., 2008. Actual incidence of global left ventricular hypokinesia in adult septic shock. Crit. Care Med. 36, 1701–1706.
Vincent, J.L., Rhodes, A., Perel, A., Martin, G.S., Della Rocca, G., Vallet, B., Pinsky, M.R., Hofer, C.K., Teboul, J.L., de Boode, W.P., Scolletta, S., 2011. Clinical review: update on hemodynamic monitoring-a consensus of 16. Crit. Care 15, 229.
Walker, P.G., Constable, P.D., Morin, D.E., Drackley, J.K., Foreman, J.H., Thurmon, J.C., 1998. A reliable, practical, and economical protocol for inducing diarrhea and severe dehydration in the neonatal calf. Can. J. Vet. Res. 62, 205.
Wittek, T., Constable, P.D., Fürll, M., 2004. Comparison of abomasal luminal gas pressure and volume and perfusion of the abomasum in dairy cows with left displaced abo-masum or abomasal volvulus. Am. J. Vet. Res. 65, 597–603.
Yildiz, R., Aydogdu, U., Guzelbektes, H., Coskun, A., Sen, I., 2017. Venous lactate, pH and partial pressure of carbon dioxide levels as prognostic indicators in 110 premature calves with respiratory distress syndrome. Vet. Rec. 180, 611.