ORIGINAL PAPER / OBSTERICS ISSN 0017–0011 DOI: 10.5603/GP.a2018.0044
Proteinuria in preeclampsia: is it important?
Attila Özkara
1, Aşkı Ellibeş Kaya
2, Alper Başbuğ
2, Sabri Berkem Ökten
3,
Ozan Doğan
4, Mete Çağlar
5, Selahattin Kumru
51Department of Obstetrics and Gynecology,Giresun University Obstetrics and Pediatrics Training and Research Hospital, Giresun, Turkey
2Department of Obstetrics and Gynecology, Duzce University Hospital, Duzce, Turkey
3Department of Obstetrics and Gynecology, Başkent University Istanbul Health Practice and Research Center, Istanbul, Turkey 4Department of Obstetrics and Gynecology, Health Sciences University, Sisli Hamidiye Etfal Research and Training Hospital,
Istanbul, Turkey
5Department of Obstetrics and Gynecology, Akdeniz University Faculty of Medicine, Antalya, Turkey
ABSTRACT
Objectives: Our aim is to evaluate the laboratory results and proteinuria levels of preeclamptic women and their relation-ships to maternal and fetal outcomes.
Material and methods: One hundred preeclamptic pregnant women who gave birth in our clinic between 2013 and 2015 were included in our study retrospectively. The data collected from the patients included gestational week, age, gravidity, parity, abortus history, blood pressure, biochemical parameters, delivery method, maternal hospitalization time, cesarean indication, complications, blood products required, plasmapheresis use and dialysis need. The details about the newborns were recorded retrospectively. The relationships between preeclampsia signs and maternal and neonatal out-comes were analyzed. The protein amounts were analyzed via 24-hour collected urine analyses and spot urine analyses.
Results: A statistically significant positive correlation was observed between neonatal intensive care unit needs and pro-teinuria levels. Fetal growth restriction, respiratory distress syndrome and sepsis were observed as the level of propro-teinuria increased, but the result was not statistically significant. Eclampsia was observed only in patients with massive proteinuria, and it was statistically significant. An increase in cesarean sections, placental abruptions, antihypertensive drug needs and blood product replacement rates was observed as the amount of proteinuria increased in preeclamptic women, but the results were not statistically significant.
Conclusions: The severity of preeclampsia cannot be determined by the level of proteinuria. However, when massive proteinuria is detected, the clinician should be more cautious about maternal and fetal complications.
Key words: Complications, preeclampsia, proteinuria
Ginekologia Polska 2018; 89, 5: 256–261
Corresponding author: Ozan Doğan
Department of Obstetrics and Gynecology, Health Sciences University, Sisli Hamidiye Etfal Research and Training Hospital, Istanbul, Turkey Binbasi Refikbey sk, St. 9/5 Sisli, Istanbul, Turkey
tel.: +90 505 5060720 e-mail: [email protected]
INTRODUCTION
Gestational hypertensive disorders are seen in 5–10 per-cent of all pregnancies [1]. They are one of the most common complications seen in pregnancy and one of the most impor-tant causes of perinatal mortality and morbidity [1]. Gestatio-nal hypertensive disorders were first classified in 1972 by the American College of Obstetricians and Gynecologists (ACOG), and modified by the National High Blood Pressure Education Program Working Group in 1990 and 2000. According to this classification, the hypertensive disorders seen during
pregnancy are chronic hypertension, gestational hyperten-sion, preeclampsia superimposed upon chronic hypertension and preeclampsia-eclampsia [2–4].
Preeclampsia typically arises after 20 weeks of gestation and is diagnosed with a blood pressure reading of 140/90 or greater, measured on two separate times four hours apart, co-existing with proteinuria, or high blood pressure wi-thout proteinuria but accompanied by thrombocytopenia, renal failure, impaired liver function, pulmonary edema and prodromal signs like visual and cerebral symptoms.
Preeclampsia is a multisystemic disorder in which decreased organ perfusion is seen secondary to an endothelial disor-der and vasospasm, and it is peculiar to gravid humans. It’s a dynamic and progressive process. In these pregnancies, the risks of maternal-fetal mortality or severe morbidity are increased [5, 6].
Preeclampsia and eclampsia are responsible for 10– 15 percent of all maternal deaths worldwide due to obste-tric complications [7]. Early diagnosis and taking necessary precautions can reduce the risks, especially in preventing eclamptic seizures, and thus reduce maternal-fetal morbi-dity and mortality rates [8].
Proteinuria is a sign of glomerular damage. A +1 pro-tein value with urine dipstick analysis, more than 300 milli-grams (mg) of protein in a 24-hour collected urine sample, or a value of 0.3 milligrams/deciliter (mg/dL) or more of protein/creatinine is called proteinuria [1].
The quantitative analysis of the amount of protein in urine collected for 24 hours is the gold standard for the calculation of proteinuria. In cases in which immediate dia-gnosis is needed or the laboratory tools are not adequate, spot urine sample analysis with a dipstick can still be used [3]. Although the amount of proteinuria is excluded from the factors determining the severity of preeclampsia, it still has an important role in the diagnosis of preeclampsia. In the literature, there are studies showing that massive proteinuria has negative effects — especially on fetal outcomes and also on maternal outcomes. Based on these studies, we aimed to evaluate the amount of proteinuria, the other laboratory results of patients during pregnancy and their fetal and maternal outcomes in our study.
MATERIAL AND METHODS
One hundred and thirty-two preeclamptic pregnant wo-men who gave birth in our clinic between January 2013 and October 2015 were located. When a power analysis was done by taking the preeclampsia incidence as 7 percent, the number of patients needed was calculated to be 98 with 80 percent power and 5 percent type 1 error. The files of the patients were evaluated retrospectively. The age range of the patients was 16 to 42 years old. Twelve patients who had chronic hypertension, diabetes mellitus, renal or hepatic disorders, thrombophilia, the presence of congenital ano-malies diagnosed during pregnancy or multiple pregnancies were excluded, and the data of 20 patients could not be accessed. The data of 100 women was evaluated.
The preeclampsia diagnosis and classification were made according to the criteria of the ACOG Task Force on Hypertension in Pregnancy 2013 criteria.
Data collection started after ethics committee approval was obtained from Düzce University/Düzce/Turkey with decision number 2015/164.
The data collected from the women who were inclu-ded in our study encompassed the gestational week, age, gravidity, parity, abortion history, blood pressure, bioche-mical parameters, delivery method (normal vaginal birth or cesarean section), maternal hospitalization time, cesa-rean indication, complications (placental abruption, acute renal failure, pulmonary embolism, intracranial hemorrhage, disseminated intravascular coagulation and liver subcap-sular hematoma), blood products used, plasmapheresis use and dialysis use if needed. In addition, the data also included the details about the women’s newborns (their weight, height and gender, their apgar scores, their neo-natal intensive care unit requirements and hospitalization time, and the presence or absence of intrauterine growth restrictions, as well as the occurrence of transient tachyp-nea of the newborn, respiratory distress syndrome, sepsis, perinatal death and necrotizing enterocolitis). All of the data was recorded retrospectively. The relationships between preeclampsia signs and maternal and neonatal outcomes were analyzed. The amounts of protein were analyzed by 24-hour collected urine analyses and spot urine analyses. The 24-hour collected urine protein results were divided into three subgroups as 300–1,000 mg/day, 1,001–3,000 mg/day and more than 3,001 mg/day. These groups were named Group 1, Group 2 and Group 3, respectively. Proteinuria was observed in all diagnosed preeclampsia patients.
A comparison between continuous variables with a nor-mal distribution pattern was done via the independent samples t-test, while the Mann-Whitney U test was utilized with data that did not have a normal distribution pattern. Pearson’s correlation coefficient test was used to explore the relationship between continuous variables with a normal distribution, whereas Spearman’s rho correlation coefficient was used for those without a normal distribution and the Bonferroni test was calculated for subgroup analyses. Sta-tistical analyses were carried out with SPSS for Windows version 22.0 statistical software (SPSS Inc., Chicago, Illinois, United States), and a p value of less than 0.05 was considered as statistically significant.
RESULTS
The mean of the 24-hour collected urine volume was 2.432 mL/day (min-max: 1.240–3.010 mL); the mean of the protein amount in the urine was 2.342 mg/day (min-max: 302–7342 mg); and the mean of the protein/creatinine was 0.74 mg/dl (min-max: 0.31–5.6).
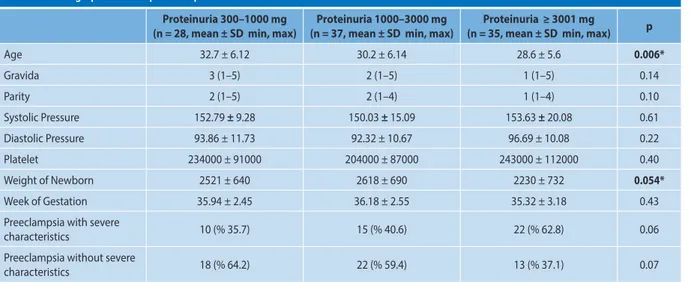
The patients’ demographic data is shown in Table 1. The relationship between the patients’ ages and protein amounts was statistically significant as verified by using a post-hoc test (p = 0.004). The mean age was lower in Group 3, and it was statistically significant. This negative relationship was confir-med with correlation analysis as well (p = 0.006, r = –0.271).
Massive proteinuria was observed in 35 percent of all the patients. Among those patients, 62.8 percent of them showed severe preeclampsia characteristics; while approximately one--third of them had preeclampsia with no severe characteri-stics. Seventy-five percent of the non-severe preeclampsia patients had proteinuria levels of less than 3 grams (g)/day.
The correlation between proteinuria levels and all the other parameters of preeclamptic patients were seen in Table 2.
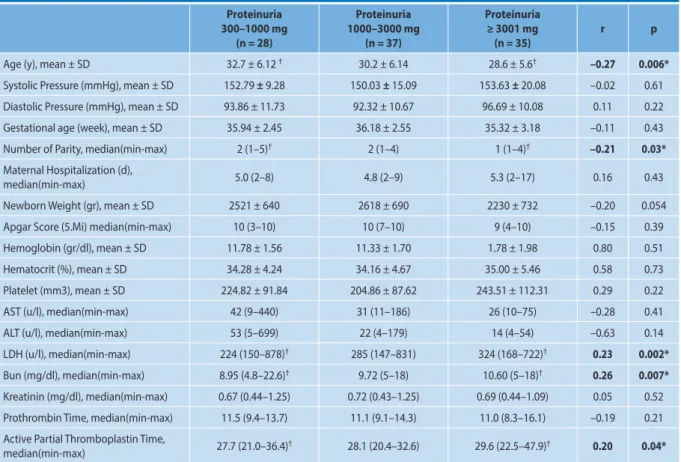
Among the hematologic parameters, there was an in-crease in the Lactate dehydrogenase (LDH), blood urea ni-trogen (BUN) and activated partial thromboplastin time (aPTT) values as the proteinuria levels increased, and this positive correlation was statistically significant. A positive correlation which was statistically significant was observed between the amount of proteinuria and BUN (r = 0.267, p = 0.007), LDH (r = 0.233, p = 0.002) and aPTT (r = 0.203, p = 0.043) (p < 0.05) (Tab. 2). There was a negative correlation between the amount of proteinuria in preeclamptic patients with the height of the newborn (r = –0.106), the weight of the newborn (r = –0.201), the apgar score (r = –0.154) and maternal hospitalization (r = –0.16), but none of these were statistically significant (Tab. 2).
An increase was observed in cesarean sections (p = 0.561), abruptions of the placenta (p = 0.312), the need for antihypertensive treatment (p = 0.323), and blood and blood products replacement (p = 0.319) rates as the prote-inuria levels increased in preeclamptic patients, but these values were not statistically significant. The amount of prote-inuria had a positive correlation with the need for Neonatal Intensive Care Unit (NICU) care and was statistically signi-ficant (p = 0.015), while the positive correlation with NICU indications like fetal growth restriction (p = 0.33), respiratory
distress syndrome (p = 0.613) and sepsis (p = 0.065) rates was not statistically significant. Eclampsia was only observed in the group 3 patients, who had proteinuria levels greater than or equal to 3 g, and the relationship was statistically significant (p = 0.018) (Tab. 3).
The cesarean section rates of patients in groups 1, 2 and 3 were 87.5 percent, 75.7 percent and 85.7 percent, while normal vaginal birth rates for the same groups were found to be 14.3 percent, 24.3 percent and 14.3 percent, respectively (p = 0.451) (Table 3). The rates for fetal growth restriction were calculated as 3.6 percent, 8.1 percent and 14.3 per-cent, respectively (p = 0.333). No dissemine intravascular coagulation (DIC), acute renal failure, pulmonary embolisms, intracranial hemorrhages, subcapsular hematomas, need for dialysis or perinatal mortality were detected.
DISCUSSION
In the bulletin they published in 2013, the ACOG re-ported that preeclampsia can be diagnosed without prote-inuria. The preeclampsia without proteinuria rate is about 10 percent [9]. Many studies showed that high levels of proteinuria were highly related to fetal and maternal morbi-dity [10–13]. In our clinic, we did not have any preeclampsia patients without proteinuria on the given dates, so no group was formed as “patients with no proteinuria or patients with proteinuria less than 300 mg.” The reason for that might be the accustomed strong coexistence of preeclampsia with proteinuria in most of the clinicians’ minds. Preeclamptic women with no proteinuria might be diagnosed and follo-wed as gestational hypertension or chronic hypertension. This is one limitation of our study.
Thornton et al. mentioned an increase in cesarean sec-tions, magnesium sulphate treatment and preterm birth rates
Table 1. Demographic data of preeclamptic women
Proteinuria 300–1000 mg
(n = 28, mean ± SD min, max) (n = 37, mean ± SD min, max) Proteinuria 1000–3000 mg (n = 35, mean ± SD min, max) Proteinuria ≥ 3001 mg p
Age 32.7 ± 6.12 30.2 ± 6.14 28.6 ± 5.6 0.006* Gravida 3 (1–5) 2 (1–5) 1 (1–5) 0.14 Parity 2 (1–5) 2 (1–4) 1 (1–4) 0.10 Systolic Pressure 152.79 ± 9.28 150.03 ± 15.09 153.63 ± 20.08 0.61 Diastolic Pressure 93.86 ± 11.73 92.32 ± 10.67 96.69 ± 10.08 0.22 Platelet 234000 ± 91000 204000 ± 87000 243000 ± 112000 0.40 Weight of Newborn 2521 ± 640 2618 ± 690 2230 ± 732 0.054* Week of Gestation 35.94 ± 2.45 36.18 ± 2.55 35.32 ± 3.18 0.43 Preeclampsia with severe
characteristics 10 (% 35.7) 15 (% 40.6) 22 (% 62.8) 0.06
Preeclampsia without severe
characteristics 18 (% 64.2) 22 (% 59.4) 13 (% 37.1) 0.07
* p < 0.05 indicates statistical significance. Patients were grouped into three according to proteinuria amount; Group 1: 300–1000 mg, Group 2: 1001–3000 mg, Group 3: ≥ 3001 mg
Table 3. Proteinuria Level relation with Maternal Morbidity and Neonatal Outcomes Proteinuria 300–1000 mg (n = 28) Proteinuria 1001–3000 mg (n = 35) Proteinuria ≥ 3001 mg (n = 35) p
Normal Vaginal Birth, n (%) 4 (14.3) 9 (24.3) 5 (14.3) 0.451
Cesarean Section, n (%) 24 (85.7) 28 (75.7) 30 (85.7) 0.561
Abruption of Placenta, n (%) 0 1 (2.7) 3 (8.6) 0.312
Blood Products Replacement, n (%) 1 (3.6) 1 (2.7) 4 (11.4) 0.319 Antihypertansive Treatment, n (%) 12 (42.9) 15 (40.5) 20 (57.1) 0.323 FGR, n (%) 1 (3.6) 3 (8.1) 5 (14.3) 0.333 RDS, n (%) 2 (7.1) 4 (10.8) 5 (14.3) 0.613 YDGT, n (%) 5 (17.9) 2 (5.4) 4 (11.4) 0.270 Sepsis, n (%) 5 (17.9) 12 (32.4) 16 (45.7) 0.065 NEC, n (%) 0 1 (2.7) 0 0.423
Neonatal Intensive Care Unit Need, n (%) 8 (28.6) 10 (27.0) 20 (57.1) 0.015*
Prematurity, n (%) 19 (67.9) 22 (59.5) 26 (74.3) 0.406
Eclampsia, n (%) 0 0 4 (11.4) 0.018*
HELLP, n (%) 0 2 (5.4) 0 0.329
* p < 0.05 statistically significant difference
Table 2. The correlation analysis between amount of proteinuria, demographic characteristics and laborotary findings
Proteinuria 300–1000 mg (n = 28) Proteinuria 1000–3000 mg (n = 37) Proteinuria ≥ 3001 mg (n = 35) r p
Age (y), mean ± SD 32.7 ± 6.12 † 30.2 ± 6.14 28.6 ± 5.6† –0.27 0.006*
Systolic Pressure (mmHg), mean ± SD 152.79 ± 9.28 150.03 ± 15.09 153.63 ± 20.08 –0.02 0.61 Diastolic Pressure (mmHg), mean ± SD 93.86 ± 11.73 92.32 ± 10.67 96.69 ± 10.08 0.11 0.22 Gestational age (week), mean ± SD 35.94 ± 2.45 36.18 ± 2.55 35.32 ± 3.18 –0.11 0.43 Number of Parity, median(min-max) 2 (1–5)† 2 (1–4) 1 (1–4)† –0.21 0.03*
Maternal Hospitalization (d),
median(min-max) 5.0 (2–8) 4.8 (2–9) 5.3 (2–17) 0.16 0.43
Newborn Weight (gr), mean ± SD 2521 ± 640 2618 ± 690 2230 ± 732 –0.20 0.054 Apgar Score (5.Mi) median(min-max) 10 (3–10) 10 (7–10) 9 (4–10) –0.15 0.39 Hemoglobin (gr/dl), mean ± SD 11.78 ± 1.56 11.33 ± 1.70 1.78 ± 1.98 0.80 0.51 Hematocrit (%), mean ± SD 34.28 ± 4.24 34.16 ± 4.67 35.00 ± 5.46 0.58 0.73 Platelet (mm3), mean ± SD 224.82 ± 91.84 204.86 ± 87.62 243.51 ± 112.31 0.29 0.22 AST (u/l), median(min-max) 42 (9–440) 31 (11–186) 26 (10–75) –0.28 0.41 ALT (u/l), median(min-max) 53 (5–699) 22 (4–179) 14 (4–54) –0.63 0.14 LDH (u/l), median(min-max) 224 (150–878)† 285 (147–831) 324 (168–722)† 0.23 0.002*
Bun (mg/dl), median(min-max) 8.95 (4.8–22.6)† 9.72 (5–18) 10.60 (5–18)† 0.26 0.007*
Kreatinin (mg/dl), median(min-max) 0.67 (0.44–1.25) 0.72 (0.43–1.25) 0.69 (0.44–1.09) 0.05 0.52 Prothrombin Time, median(min-max) 11.5 (9.4–13.7) 11.1 (9.1–14.3) 11.0 (8.3–16.1) –0.19 0.21 Active Partial Thromboplastin Time,
median(min-max) 27.7 (21.0–36.4)† 28.1 (20.4–32.6) 29.6 (22.5–47.9)† 0.20 0.04*
* p < 0.05 indicates statistical significance. Patients were grouped into three according to proteinuria amount; Group 1: 300–1000 mg, Group 2: 1001–3000 mg, Group 3: ≥ 3001 mg.
Abb; year: (y), day, (d), minutes (min).
when the amount of proteinuria is measured as 500 mg/day. Chan et al. found a statistically significant relationship be-tween proteinuria and maternal and fetal outcomes [9, 10].
Mi Jung Kim et al. observed a negative correlation be-tween age and the amount of proteinuria, and this data shows concordance with our results. In our study, we also observed that as the age of the patient decreases, the amo-unt of proteinuria increases. While the same study showed that the gestational week is significantly earlier at the time of diagnosis in massive proteinuria, we did not observe a statistically significant difference in our study. This study showed significantly high rates of retinal detachment and pleural effusion in patients with massive proteinuria, while in our study, we observed none of these complications. The same study also showed similar eclampsia rates between patients with massive vs. mild proteinuria [11]. Mateus et al. found no significant relationship between eclampsia and the amount of proteinuria in a recent study they did in 2017 [12]. However, in our study, eclampsia rates were significantly higher in patients with massive proteinuria. Mateus et al. also showed that massive proteinuria in pre-eclamptic patients had a negative effect on fetal outcomes in their recent study. They observed a significant decrease in birth weight, birth week and apgar scores [13]. In our study, we also found a significant increase in the duration of stay in neonatal intensive care units in babies of patients with massive proteinuria. The birth weight was found to be low, but this result was not statistically significant. In a similar study in which a massive proteinuria level was measured as 10 g / 24 hours, no significant difference was shown between subgroups in terms of maternal outcomes. In terms of fetal outcomes, respiratory distress syndrome and intravascular hemorrhage rates were detected to be higher, but statisti-cally, they were not significant [14].
In cases with severe preeclampsia, the appropriate ap-proach for 34 weeks and older gestational ages is immediate termination of the pregnancy, whereas for 34 weeks and younger gestational ages, termination of the pregnancy is needed if maternal or fetal stabilization cannot be mainta-ined [1]. A systematic review states that protein amounts should not be used to determine clinical decisions [15]. However, many studies, such as those mentioned above, show that massive proteinuria has negative effects on fetal outcomes. The reason for that might be that clinicians are apprehensive about massive proteinuria which leads them to terminate pregnancies in a hurry.
Von Dadelszen et al. published their PIERS study in 2011, and it showed no difference in terms of fetal and maternal outcomes between patients with and without proteinuria. However, parallel to our results, an increase in negative fetal and perinatal outcomes was found in patients with +3 and +4 proteinuria in spot urine samples [16].
Even though spot urinary analysis and proteinuria calcu-lations were performed, patients were grouped according to their protein amounts in urine collected over 24 hours because the false negative and positive rates can be high in spot analysis. It is known that the 24-hour urine collection method is the gold standard for the calculation of proteinu-ria [17]. Because of long collection times and other difficul-ties, in cases in which an immediate diagnosis is needed or the laboratory tools are not adequate, spot urine sample analysis can still be used [1]. In addition, other practical analysis tools such as albumin/creatinine rates, protein/cre-atinine rates and 12-hour urine analysis are becoming more popular in the literature [18].
According to the The National Institute for Health and Care Excellence (NICE) 2010 guidelines, urinary retesting to evaluate proteinuria is not needed [19]. We also included the 24-hour urine protein results in our study which were collected just after the patients were diagnosed as having preeclampsia. The repeated test results were not included in our study.
There is no solid evidence about the threshold of prote-inuria which classifies it as severe. Some studies identify the 24-hour urine protein level threshold for severe proteinuria as being at least 3 g or more, and some identify it as 5 g or more in the literature [11, 20, 21]. Because only 6 percent of our patient population had a proteinuria level of at least 5 g or more, in order to have an appropriate statistical ana-lysis between groups, we identified the severe proteinuria threshold as 3 g.
In our study, 35 percent of the preeclamptic patients had massive proteinuria. Of these patients, 62.8 percent of them showed severe preeclampsia characteristics, and approxi-mately one-third of them were followed as preeclampsia with no severe characteristics. In addition, 75 percent of patients who showed no severe preeclampsia features had proteinuria levels of less than 3 g/day. This data is similar to that in the literature [11].
A study by Bramham et al. showed an increase in the rates of gestational complications, low fetal birth weight and severe preeclampsia as the proteinuria levels increased and when the proteinuria levels were measured as 300 mg/day and 500 mg/day [22].
In our study, the severity of preeclampsia showed a positive correlation with the amount of proteinuria, but the results were not statistically significant. Preeclampsia severity cannot be determined by the level of proteinu-ria. However, when massive proteinuria is detected, the clinician should be more cautious about maternal and fe-tal complications. After the patient is stabilized, the birth should be planned in a center which is well-equipped and experienced in terms of a neonatal intensive care unit, and precautions should be taken to prevent eclamptic seizures.
CONCLUSIONS
Maternal and neonatal complications increased with the proteinuria levels, but the association was not statistically significant.
Conflict of interest
No conflict of interest was declared by the authors. Financial disclosure
The authors declared that this study has received no finan-cial support.
REFERENCES
1. American College of Obstetricians and Gynecologists. 2013. Task Force on Hypertension in Pregnancy. ACOG Hypertension in Pregnancy Task Force. Washington, DC: American College of Obstetricians and Gynecologists.
2. Hughes ec. Obstetric terminology. In: Mitchell Perry H Jr, editor. Lifelong management of hypertension. Springer Science and Business Media, Philadelphia 1972: 442–423.
3. Report of the National High Blood Pressure Education Program Working Group on High Blood Pressure in Pregnancy. Ameri-can Journal of Obstetrics and Gynecology. 2000; 183(1): s1–s22, doi: 10.1067/mob.2000.107928.
4. Heart Lung and Blood Institute. 2000. Working Group report on high blo-od pressure in pregnancy. Bethesda(MD): National Institutes of Health. 5. Hutcheon JA, Lisonkova S, Joseph KS. Epidemiology of pre-eclampsia
and the other hypertensive disorders of pregnancy. Best Pract Res Clin Obstet Gynaecol. 2011; 25(4): 391–403, doi: 10.1016/j.bpob-gyn.2011.01.006, indexed in Pubmed: 21333604.
6. Başbuğ A, Başbuğ D, Ünlü BS, et al. Preeklampside Maternal Serum IL-2, IL-10 Konsantrasyonları ve Th1/Th2 Dengesi. Turkiye Klinikleri J Gynecol Obst. 2012; 22(1): 1–7.
7. Duley L. The global impact of pre-eclampsia and eclampsia. Semin Perinatol. 2009; 33(3): 130–137, doi: 10.1053/j.semperi.2009.02.010, indexed in Pubmed: 19464502.
8. Cunningham FG, Gant NF, Leveno KJ, Gilstrap LC, Hauth JC, Wenstrom KD. Williams Obstetric. 21 st Edition. McGraw-Hill, New York 2001: Chapter 24. 9. Thornton CE, Makris A, Ogle RF, et al. Role of proteinuria in defining pre--eclampsia: clinical outcomes for women and babies. Clin Exp Pharmacol Physiol. 2010; 37(4): 466–470, doi: 10.1111/j.1440-1681.2009.05334.x, indexed in Pubmed: 19930427.
10. Chan P, Brown M, Simpson JM, et al. Proteinuria in pre-eclampsia: how much matters? BJOG. 2005; 112(3): 280–285, doi: 10.1111/j.1471--0528.2004.00395.x, indexed in Pubmed: 15713140.
11. Dong X, Gou W, Li C, et al. Proteinuria in preeclampsia: Not essential to diagnosis but related to disease severity and fetal outcomes. Pregnancy Hypertens. 2017; 8: 60–64, doi: 10.1016/j.preghy.2017.03.005, indexed in Pubmed: 28501282.
12. Mateus J, Newman R, Sibai BM, et al. Massive Urinary Protein Excretion Asso-ciated with Greater Neonatal Risk in Preeclampsia. Am J Perinatol Rep. 2017; 7(1): 49–58, doi: 10.1055/s-0037-1601866, indexed in Pubmed: 28348923. 13. Kim MiJ, Kim YN, Jung EJ, et al. Is massive proteinuria associated with mater-nal and fetal morbidities in preeclampsia? Obstet Gynecol Sci. 2017; 60(3): 260–265, doi: 10.5468/ogs.2017.60.3.260, indexed in Pubmed: 28534011. 14. Newman MG, Robichaux AG, Stedman CM, et al. Perinatal outcomes in
preeclampsia that is complicated by massive proteinuria. Am J Obstet Gynecol. 2003; 188(1): 264–268, doi: 10.1067/mob.2003.84, indexed in Pubmed: 12548227.
15. Thangaratinam S, Coomarasamy A, O’Mahony F, et al. Estimation of proteinuria as a predictor of complications of pre-eclampsia: a systematic review. BMC Med. 2009; 7: 10, doi: 10.1186/1741-7015-7-10, indexed in Pubmed: 19317889.
16. von Dadelszen P, Payne B, Li J, et al. PIERS Study Group. Prediction of adverse maternal outcomes in pre-eclampsia: development and validation of the fullPIERS model. Lancet. 2011; 377(9761): 219–227, doi: 10.1016/S0140-6736(10)61351-7, indexed in Pubmed: 21185591. 17. Shennan AH, Waugh J. The measurement of blood pressure and
prote-inuria in pregnancy. In: Critchley HH, MacLean A, Poston L, Walker J. ed. Pre-eclampsia. RCOG Press, London (UK) 2003: 305–24.
18. Nischintha S, Pallavee P, Ghose S. Correlation between 24-h urine protein, spot urine protein/creatinine ratio, and serum uric acid and their association with fetomaternal outcomes in preeclamptic women. J Nat Sci Biol Med. 2014; 5(2): 255–260, doi: 10.4103/0976-9668.136151, indexed in Pubmed: 25097393.
19. Hypertension in pregnancy: diagnosis and management of hyperten-sive disorders during pregnancy. NICE National Institute for Health and Clinical Excellence clinical guideline., 2010.
20. Tranquilli AL, Brown MA, Zeeman GG, et al. The definition of severe and early--onset preeclampsia. Statements from the International Society for the Stu-dy of Hypertension in Pregnancy (ISSHP). Pregnancy Hypertens. 2013; 3(1): 44–47, doi: 10.1016/j.preghy.2012.11.001, indexed in Pubmed: 26105740. 21. Lindheimer MD, Kanter D. Interpreting abnormal proteinuria in pregnan-cy: the need for a more pathophysiological approach. Obstet Gynecol. 2010; 115(2 Pt 1): 365–375, doi: 10.1097/AOG.0b013e3181cb9644, indexed in Pubmed: 20093912.
22. Bramham K, Poli-de-Figueiredo CE, Seed PT, et al. Association of proteinuria threshold in pre-eclampsia with maternal and perinatal outcomes: a nested case control cohort of high risk women. PLoS One. 2013; 8(10): e76083, doi: 10.1371/journal.pone.0076083, indexed in Pubmed: 24130760.