Contents lists available atScienceDirect
Bioresource Technology
journal homepage:www.elsevier.com/locate/biortech
Characterizing and optimizing (co-)pyrolysis as a function of different
feedstocks, atmospheres, blend ratios, and heating rates
Jingyong Liu
a,⁎, Limao Huang
a, Wuming Xie
a, Jiahong Kuo
a, Musa Buyukada
b,
Fatih Evrendilek
c,daGuangzhou Key Laboratory Environmental Catalysis and Pollution Control, Guangdong Key Laboratory of Environmental Catalysis and Health Risk Control, School of Environmental Science and Engineering, Institute of Environmental Health and Pollution Control, Guangdong University of Technology, Guangzhou 510006, China bDepartment of Chemical Engineering, Bolu Abant Izzet Baysal University, Bolu 14052, Turkey
cDepartment of Environmental Engineering, Bolu Abant Izzet Baysal University, Bolu 14052, Turkey dDepartment of Environmental Engineering, Ardahan University, Ardahan, 75002, Turkey
A R T I C L E I N F O Keywords: Co-pyrolysis performance Kinetics Thermodynamics Gaseous characterization Optimization A B S T R A C T
(Co-)pyrolysis behaviors were quantified using TG and Py-GC/MS analyses as a function of the two fuels of sewage sludge (SS) and water hyacinth (WH), five atmospheres, six blend ratios, and three heating rates. Co-pyrolysis performance, gaseous characterizations and optimization analyses were conducted. Relative to N2
atmosphere, co-pyrolysis was inhibited at low temperatures in CO2atmosphere, while the CO2atmosphere at
high temperatures promoted the vaporization of coke. The main (co-)pyrolysis products of SS and WH were benzene and its derivatives, as well as alkenes and heterocyclic compounds. Average apparent activation energy decreased gradually with the increased atmospheric CO2concentration and was highest (377.5 kJ/mol) in N2
atmosphere and lowest (184.7 kJ/mol) in CO2atmosphere. Significant interaction effects on the mean responses
of mass loss, derivative TG, and differential scanning calorimetry were found for fuel type by heating rate and atmosphere type by heating rate.
1. Introduction
The rapid generation rate of sewage sludge (SS) threatens en-vironmental and public health due to its toxic and harmful contents (Liu et al., 2016, 2018). Currently, China is producing over 4 × 10⁷tons of
SS 80% of which does not meet the essential treatment requirements of harmlessness and stability (Huang et al., 2018) and is expected to ex-ceed 6 × 10⁷tons by 2025 (Guo and Dai, 2017). There is a growing
change in the perception of sludge from an unwanted waste to a bioenergy resource, and thus, a growing need for a suitable thermal technology to be used in an environmentally and economically efficient way (Liu et al., 2015a,b). The present SS co-pyrolysis technology poses an effective method to recover resources, to avoid secondary pollutants, and to reduce dioxin and heavy metals (Raheem et al., 2018). However, the SS pyrolysis renders volatiles difficult to precipitate, thus inhibiting its large-scale applications (Raheem et al., 2018).
The co-pyrolysis performance of SS and different biomass materials in different ratios has been explored using thermogravimetric (TG) and pyrolysis–gas chromatography/mass spectrometric (Py-GC/MS) ana-lyses. For example,Alvarez et al. (2015)concluded that the ash content
of SS promoted the formation of bio-oils due to its catalytic function. Lin et al. (2014)reported that oil palm waste improved the pyrolysis of paper mill sludge.Wang et al. (2016) found a significant synergistic effect during co-pyrolysis of sludge and wheat straw that in turn in-creased the pyrolysis performance and the production of gaseous and liquid products.Zhao et al. (2018)reported an enhanced co-pyrolysis performance of municipal sludge and hazelnut shells whose mechanism was best described by a stochastic nucleation growth model.Lin et al. (2017)stated that the co-pyrolysis products of municipal sludge and bagasse led to the gaseous products of mainly aromatic compounds. Fang et al. (2015)pointed out that co-pyrolysis of household garbage and paper mill sludge reduced activation energy (Ea) value. However,
there exists no study about the co-pyrolysis of WH using TG and Py-GC/ MS analyses.
Water hyacinth (Eichhornia crassipes) (WH) has a widespread geo-graphical distribution, a strong reproductive ability, and high (hemi) cellulose and low lignin contents which all render it suitable for energy generation (Gunnarsson et al., 2007; Biswas et al., 2017; Sindhu et al., 2017; Huang et al., 2018). WH pyrolysis process mainly involved the decomposition of (hemi)cellulose (Luo et al., 2011) leading to the
https://doi.org/10.1016/j.biortech.2019.01.003
Received 2 December 2018; Received in revised form 31 December 2018; Accepted 2 January 2019
⁎Corresponding author. Tel.: +86 020 39322291; fax: +86 020 39322548.
E-mail addresses:[email protected],[email protected](J. Liu).
Bioresource Technology 277 (2019) 104–116
Available online 04 January 2019
0960-8524/ © 2019 Elsevier Ltd. All rights reserved.
products of hydrocarbon compounds, a variety of carboxylic acids, es-ters, alcohols, aromatic compounds, and furans (Hussain et al., 2013). Earlier studies about WH have focused on its uses in bioremediation (Gangulya et al., 2012), feed and adsorbent production ( Guerrero-Coronilla et al., 2015), and fuel and feedstock production (Aswathy et al., 2010; Huang et al., 2016, 2018). The co-pyrolysis of WH and SS is a promising disposal method that aims at waste reduction and energy generation. Energy quality and quantity obtained from co-pyrolysis depend on a better understanding of chemical composition of a given biomass material, and kinetic and thermodynamic parameters of op-erational conditions. For example, co-pyrolysis of SS and biomass ma-terials has been performed primarily in N2 atmosphere (Fang et al.,
2015; Alvarez et al., 2015; Lin et al., 2017; Zhuo et al., 2018). Recently, the reductive heat conversion technology has been utilized to promote CO2capture and to control the pyrolysis products of greenhouse gas
emissions by using CO2as the gasification/co-pyrolysis carrier and
fo-cusing on coal, and domestic and biomass wastes (Lai et al., 2012; Fang et al., 2017; Lee et al., 2017). However, to the best of our knowledge, there exists no study about the co-pyrolysis of WH and SS in terms of its performance characterization and optimization. Therefore, the objec-tives of this study were to quantify co-pyrolysis performance and be-haviors of WH and SS in N2, CO2and CO2/N2atmospheres
character-izing kinetic, thermodynamic and gaseous components based on TG and Py-GC/MS analyses as well as optimization based on empirical models. 2. Materials and methods
2.1. Materials
Sewage sludge samples were continuously collected at an interval of 0.5–8 h from a terminal conveyor belt of a wastewater treatment plant in Guangzhou of the Guangdong Province, China. WH samples were collected from canals surrounding Guangzhou University Mega Center in Guangzhou of the Guangdong Province, China. They were allowed to dry naturally in one week at room temperature in laboratory, crushed and sieved into the desired particle size of < 74 μm. They were then dried at 105 °C until a constant weight was achieved and kept in a desiccator for subsequent analyses. The ultimate and proximate ana-lyses and calorific values of the samples are presented inTable 1. 2.2. Experimental procedure
Thermogravimetric analysis was conducted using the three heating rates of 10, 20 and 40 °C·min−1and a total of five atmospheres: N
2,
CO2, and CO2/N2atmospheres with three mole ratios (8/2, 5/5, and 2/
8). Measurements were made at a flow rate of 50 ml·min−1from 25 to
900 °C using a simultaneous DSC-TG equipment (NETZSCH STA 409 PC). Approximately (5 ± 0.5 mg) of the samples were used in alumina crucibles in each analysis. Prior to the start of the experiment, several experiments without the samples were conducted to obtain the baseline against which to detect the systematic errors of the instrument. Also,
measurements of randomly selected samples in the same batch were replicated in three times to confirm the repeatability and authenticity of the generated data and to ensure that the errors were within ± 2%. The NETZSCH-T4-Kinetic 2 software provided both TG and derivative TG (DTG) curves.
Pyrolysis-gas chromatography/mass spectrometry was used to on-line monitor the releases of co-pyrolysis gases and organic products. Frontier Lab PY-2020id was used as a pyrolysis reactor to conduct co-pyrolysis at 800 °C for 24 s using purified He as the carrier gas. The composition of pyrolytic vapors was identified using a GC/MS equipped with a HP-5MS capillary column (30 m × 0.32 mm × 0.25 μm). The initial temperature of the GC/MS oven was kept at 40 °C for 2 min, elevated to 300 °C under a constant heating rate of 10 °C·min−1and
kept on for 10 min.
2.3. Co-pyrolysis performance evaluation
(Co-)pyrolysis performances were evaluated using the following seven indices of ignition temperature (Ti), burnout temperature (Tb),
peak temperature (Tp), maximum weight loss rate (Rp), average weight
loss rate (Rv), volatile combustion characteristic (D), and
comprehen-sive combustibility (CCI). The higher the D value was, the higher the samples released volatiles. The higher the CCI value was, the more vigorously the samples burned and the faster the char burnout was. D and CCI were estimated as a function of weight loss rate and char-acteristic temperatures as follows:
= × × D R T T T p i p 1/2 (1) = × × CCI R R T T ( p) ( v) i2 b (2)
whereRp andRvare maximum and average rates of mass losses (% ⋅min−1); T
i, Tp,Tband ΔT1/2are ignition, peak and burnout
tempera-tures, and time range at half value of Rp, respectively.
2.4. Kinetic analyses
Heterogeneous solid-state reaction rates are generally stated using Eq.(3):
= k T f d
dt ( ) ( ) (3)
Given the Arrhenius equation: =
k T( ) Ae(E RTa/ ) (4)
where = conversion degree; t = time; T = reaction temperature; A = pre-exponential factor; Ea= apparent activation energy; and R = universal gas constant (8.314 J/K⋅mol−1).
Conversion degree was described thus (Chen et al., 2017a):
Table 1
Ultimate, proximate and calorific analyses of sewage sludge (SS) and water hyacinth (WH) on an air-dried basis [10].
Sample Ultimate analysis (wt %) Proximate analysis (wt %) Qnet,da(MJ·kg−1)
C H Ob N S Mc Vd Ae FCf
SS 24.13 3.94 12.49 4.50 0.74 7.57 40.22 46.63 5.58 10.79
WH 36.62 5.28 27.49 3.01 0.25 9.95 56.30 17.40 16.35 14.77
a Q
net, d: higher heating value on an air-dried basis. b O: 100%–C–H–N–S–M−A.
c M: moisture. dV: volatile matters. e A: ash.
= m m
m m
t 0
0 (5)
where m0, m andmtrefer to initial, final, and actual sample masses,
respectively.
Eqs.(3) and (4)were coupled thus:
= A f
d
dt e( E RTa/ ) ( ) (6)
When the heating rate( ) (°C·s−1) was introduced as follows:
=dT
dt (7)
Eq.(6)became thus: =
d
dT Ae(E RTa/ )f( ) (8)
Kinetic analysis is essential to design, optimize and predict efficient, safe and robust processes of thermal degradations (Amanda and Leandro, 2016). Kinetic behaviors determined by a non-isothermal TG help to have controls over the decomposition mechanisms. To obtain the credible results, multiple methods were used in this study to esti-mate Eavalues of the pyrolysis process. The iso-conversional integral
methods of Ozawa and Flynn and Wall (OFW), distributed activated energy model (DAEM), and Starink were chosen since they estimate robust Eavalues without prior information about the kinetic models of
the reaction mechanisms. 2.4.1. OFW method
Eaestimates according to the OFW method eliminate errors
asso-ciated with the assumption of the reaction mechanism function and can be safely used to verify the accuracy of those obtained assuming a possible reaction mechanism function. The OFW method can be ex-pressed thus (Kim et al., 2010):
= C E R T ln( ) · a (9) where C is the function of conversion degree ( ).
2.4.2. DAEM
DAEM is suitable for multiple-stage reactions and is generally ap-plied to kinetic analyses of biomass pyrolysis under the assumptions of infinite parallel reactions and activation energy distributions. The Arrhenius equation can be simplified thus (Chen et al., 2017b):
= + T AR E E R T ln ln 0.6575 · a 2 (10)
A series of points for (ln
( )
T2 , 1/T) were obtained from the
experi-mental data for each conversion degree whose slopes (−Ea/R) were
used to calculate Eavalues.
2.4.3. Starink method
The Starink method is based on the Kissinger-Akahira-Sunoseis (KAS) and OFW methods to obtain reliable Eaestimates and can be
expressed thus (Zhao et al., 2018): = T C E R T ln 1.0037 · 1.8 a (11) A linear model was fitted into the plot of In
( )
T1.8 versus 1/T, and Eavalues were estimated using slopes as follows: 1.0037E R T· 2.5. Thermodynamic analyses
The thermodynamic parameters estimated using the Starink method at 20 °C·mol−1 included pre-exponential factor (A), and changes in
enthalpy (ΔH), free Gibbs energy (ΔG) and entropy (ΔS) which can be
expressed thus (Kim et al., 2010; Xu and Chen, 2013):
= E R T A · eE R T / · m ( / ·m) 2 (12) = H E RT (13) = + G E R T k T h A · ·ln · · m B m (14) = S H G Tm (15)
where kBis Boltzmann constant (1.381 × 10⁻³⁴J/K); h is Plank
con-stant (6.626 × 10⁻³⁴J/s); and T
mis DTG peak temperature.
2.6. Statistical analyses
One- and two-way multivariate analysis of variance (MANOVA) was performed to simultaneously detect significant mean differences among the three responses of remaining mass (RM), DTG, and differential scanning calorimetry (DSC) as a function of the main and interaction effects of atmosphere type, fuel type, and heating rate. The significant mean differences were further displayed performing Tukey’s multiple comparison tests following general linear models (GLM). Joint opti-mization of the three responses was based on the best-fit regression models. The best-fit regression models were built using a stepwise procedure with alpha-to-enter and –remove values of 0.001 as well as Pearson’s correlation matrix to deal with the issue of multicollinearity. All the statistical analyses were conducted at a significance level of p < 0.05 using Minitab 17.1 software.
3. Results and discussions
3.1. (Co-)pyrolysis performances in N2atmosphere
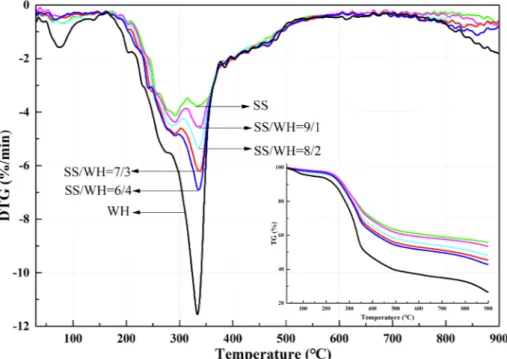
The (D)TG curves of co-pyrolysis in the N2 atmosphere at
20 °C·mol−1are shown inFig. 1. The (D)TG curves were positioned in
between those of the pure SS and WH samples, shifting with the in-creased WH blend ratios. The (D)TG curves reflected that the co-pyr-olysis performance of SS and WH was similar to that of SS and bagasse (Lin et al., 2017).
The maximum peak values of the individual pyrolysis curves ap-peared at the first and second peaks (Tp1and Tp2), respectively, while
those of the blends appeared at Tp2(Table 2). The residual quantities
(Mr) of SS and its blends after pyrolysis were 55.69, 53.42, 48.21, 45.37
and 42.63%, respectively. These were clearly higher than those fol-lowing co-combustion applied byHuang et al. (2016)due to lack of oxygen. The two weight loss peaks of the co-pyrolysis were con-centrated with the reduced maximum weight loss rate which was not consistent with the co-combustion (Huang et al., 2016).
With the 40% WH, the TG curves shifted significantly and gradually toward the low temperature region. As a result, the maximum and average weight loss rates (4.02–11.55%⋅min−1 and 1.057–1.762%
⋅min−1), D (3.238 × 10⁻⁸ to 5.914 × 10⁻⁸%·K−3·min−1), and CCI
(1.850 × 10⁻⁸ to 2.991 × 10⁻⁸ %2⋅K−3⋅min−2) increased. In other
words, 1.83 and 1.62 times increases in D and CCI, respectively, in-dicated that co-pyrolysis may offset the deficiency of SS pyrolysis and intensify its thermal volatilization and decomposition.
3.2. Interaction effects on multiple responses
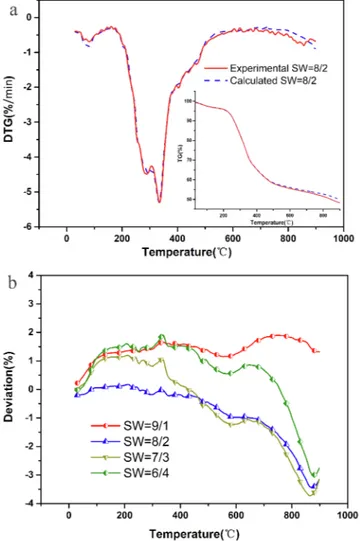
A synergistic effect between the fuels is a concern in many co-pyr-olysis applications. To determine whether or not there was a synergistic relationship between SS and WH, deviation was calculated using the following equation (Huang et al., 2018):
= ×
Deviation(%) TG TG
TG 100
exp cal cal
where TGexpis mass loss of the blends, while TGcalis calculated using
the average weight of SS and WH at the same temperature.
As shown inFig. 2a, the experimental and calculated (D)TG almost overlapped during the main reaction phase at 30 to 500 °C. The greater the deviation curves were, the stronger the synergistic effect of the co-pyrolysis process was. As shown inFig. 2a, the deviation in TG values of the blends ranged from 1.8 to 4.8%. The synergistic effect was small from 30 to 500 °C and large from 500 to 900 °C (p > 0.05). Overall, the synergetic effect on the mass loss of the blends was not as obvious during the co-pyrolysis as during the co-combustion in the CO2/O2
at-mosphere according toHuang et al. (2016).
Based on the three alternative but consistent p values (< 0.001), the below two-way MANOVA results showed significant interaction effects on the three responses (RM, DTG, and DSC) between the two fuel types (SS versus WH) and the three heating rates (10, 20 and 40 °C·min−1),
and between the five atmosphere types (CO2, N2, and CO2/N2with ratio
of 8/2, 5/5, and 2/8) and the heating rates: the fuel type by heating rate interaction effect: Wilk’s lambda (W): 0.915; F = 389.6; df = 6, 52004; Lawley-Hotelling trace (L): 0.091; F = 397.6; df = 6, 52002; and
Pillai’s trace (P): 0.084; F = 381.7; df = 6, 52,006 (n = 26010). The atmosphere type by heating rate interaction effect: W: 0.947; F = 148.6; df = 24, 188859; L: 0.055; F = 151.2; df = 24, 195347; and P: 0.084; F = 146.0; df = 24, 195,357 (n = 65134).
Tukey’s multiple comparisons were further conducted to detect significant mean differences for each of the responses as a function of the interaction effects.
3.3. Co-pyrolysis performances in response to different atmospheres and blends
Impacts of the five atmospheres (N2, CO2, CO2/N2= 8/2, CO2/
N2= 5/5, and CO2/N2= 2/8) on the co-pyrolysis of the blend (S/
W = 8/2) were evaluated at 20 °C⋅min−1 (Fig. 3). The co-pyrolysis
process for all the five atmospheres was divided into three stages (Fig. 3). For example, given the CO2/N2(5/5) atmosphere, water
eva-porated in stage I (< 175 °C) at a weight loss rate of 7.05%. Stage II (180–550 °C) mainly involved the pyrolysis of organic matters and fixed carbon including volatiles and carbon produced from the pyrolysis of
Fig. 1. (D)TG curves of (co-)pyrolysis of sewage sludge (SS), water hyacinth (WH), and their blends (SS/WH) as a function of temperature in N2atmosphere at a
heating rate of 20 °C·min−1.
Table 2
Characteristic (D)TG curves and associated parameters of sewage sludge (SS), water hyacinth (WH) and their blends (SW) in N2atmosphere.
Sample Tia(°C) Tpb(°C) Rpc(%·min−1) Rvd(%·min−1) Mre(%) Tbf(°C) Dg CCIh(10−8)
Tp1 Tp2 Rp1 Rp2 (10−8) SS 239.0 293.0 332.7 4.02 3.67 1.057 55.69 878.36 3.238 1.850 SW (9/1) 243.5 290.5 331.9 4.38 4.54 1.112 53.42 871.33 3.739 2.090 SW (8/2) 236.0 289.8 338.5 4.52 5.46 1.239 48.12 866.26 3.933 2.423 SW (7/3) 241.1 292.1 338.1 4.79 6.21 1.298 45.37 865.74 4.229 2.720 SW (6/4) 238.0 291.0 335.6 4.88 6.91 1.359 42.69 872.52 5.914 2.911 WH 267.0 274.5 335.0 5.64 11.55 1.762 17.32 877.24 11.766 4.363 a T
i: onset temperature for volatile release.
b T
p: the temperature associated to Rp.
c R
p: maximum weight loss rate.
dR
v: the average mass loss rate.
e M
r: residual mass at 900 °C.
f T
b: temperature of 98 °C conversion.
g D: volatile release characteristics index in %·K−3·min−1; and hCCI: comprehensive combustion index in %2⋅K−3⋅min−2.
(hemi)cellulose (200–430 °C) and lignin (>430 °C) at a weight loss rate of 69.05%. In stage III (> 550 °C), carbon residues and salts were de-composed at a weight loss rate of 23.90%.
The characteristic parameters of each co-pyrolysis stage are shown in Table 3. The (D)TG curves at low temperatures differed slightly among the five atmospheres, with the weight loss mainly concentrated from 200 to 550 °C. Relative to the N2atmosphere, the TG curves of the
CO2and CO2/N2atmospheres shifted to the right, with slightly high Tp2
and obviously low Rp2values. This may be caused by the difference in
the physical properties of the inert CO2and N2gases as CO2has higher
density and specific heat capacity than does N2. Thus, the co-pyrolysis
in the CO2atmosphere consumes more energy and lowers temperature
on the reactant particle surface (Chen et al, 2015a). In terms of the chemical reactions, the H2and CO concentrations in the volatilization
stage were relatively higher, and the existence of CO2appeared to
in-hibit the reaction: CO + OH CO2+ H. The free radical concentrations
(H, O and OH) were reported to decline during the pyrolysis of gases due to the existence of CO2 (Chen et al., 2013; Xie et al., 2018).
Therefore, at lower temperatures, the existence of CO2inhibited the
co-pyrolysis process.
However, in the CO2 and CO2/N2 atmospheres, the co-pyrolysis
became more intense at above 700 °C. With the increased CO2
con-centration, Rp3 (from 0.71 to 2.45%·min−1) and Rv (from 1.239 to
1.358%) rose clearly, while the pyrolysis residue quantity reduced from 48.21 to 42.87%. These findings showed that CO2 can significantly
promote the vaporization of coke at high temperatures (C + CO2 2CO)
consistent with the previous findings byZhuo et al. (2018).
Impacts of the six SS/WH blend ratios of (pure SS, 9/1, 8/2,7/3, 6/ 4, and pure WH) on (co-)pyrolysis performances were evaluated in the N2 atmosphere at 20 °C⋅min−1. The one-way MANOVA results
(n = 30647; p < 0.001) indicated a significant main effect of the blend ratio on the two responses (RM and DTG) based on the following three statistics: W: 0.859; F = 480.9; df = 10, 61,280; L: 0.163; F = 499.7; df = 10, 61,278); and P: 0.140; F = 462.1; df = 10, 61,282).
3.4. Joint optimization of multiple responses
The experimental data sets were best fitted in the multiple non-linear regression models for the three responses of RM, DTG, and DSC. The adjusted and predictive coefficients of determination (R2
adj and
R2
pred) were used to indicate the goodness-of-fit and predictive power of
the best-fit models, respectively. Variation inflation factor (VIF) below 40 was assumed to show no issue of multicollinearity. The Durbin-Watson (DW) statistics were used to detect the issue of autocorrelation, with values equal or close to 2, 0 and 4 suggesting no, strong positive and strong negative autocorrelations, respectively. The joint optimiza-tion of the responses was measured using the composite desirability (D) with a range of zero to one (the ideal case). Composite desirability is the weighted geometric mean of the individual desirabilities for the re-sponses. Optimal settings for the input variables were determined maximizing the D values.
3.4.1. Optimization in response to temperature, heating rate, and fuel type in the same N2atmosphere
The below best-fit regression models were derived as a function of temperature (T, oC), heating rate (HR) with the three levels (HR10,
HR20 and HR40, °C·min−1), fuel type with the two levels (SS and WH),
respectively, and their two- and three-way interaction terms (DW = 0; n = 26010; p 0.001):
RM (%) = 102.729 − 0.060702 T + 1.698 WH − 0.044536 T* WH + 0.005163 T*HR20*WH + 0.006039 T*HR40*WH (SE = 7.0; R2
adjand R2pred= 91.1%; VIF < 7)
DSC (mW/mg) = −0.9905 − 0.002548 T + 0.5156 HR20 − 0.9232 HR40 − 0.3325 WH − 0.007493 T*HR20 − 0.018019 T *HR40 − 0.001566 T*WH − 0.8371 HR20*WH − 0.885 HR40 *WH + 0.007506 T*HR20*WH + 0.009846 T*HR40*WH (SE =
1.5; R2
adjand R2pred= 88.2%; VIF < 16)
DTG (%/min) = −0.5352 − 1.0636 R20 − 2.9173 HR40 − 0.5060 WH + 0.001163 T*HR20 + 0.002815 T*HR40 − 0.082
HR20*WH − 0.992
HR40*WH − 0.000721 T*HR20*WH − 0.000533 T*HR40*WH (SE = 2.4; R2
adjand R2pred= 18.6%; VIF < 10)
Fig. 2. A comparison of experimental, calculated and deviation curves of blends (SW) as a function temperature: (a) (D)TG and (b) deviation.
Fig. 3. Effects of five co-pyrolysis atmospheres on (D)TG curves of blend (SW = 8/2) as a function of temperature at a heating rate of 20 °C·min−1.
For the categorical variables of the heating rate and the fuel type, 10 °C·min−1 and SS were selected as the baselines, respectively. The
three responses of mass loss, DSC, and DTG were concurrently max-imized when the individual factors of temperature, heating rate, and fuel type were optimally set to 898.9 °C, 10 °C·min−1, and WH,
re-spectively (D = 0.84).
3.4.2. Optimization in response to temperature, heating rate, and atmosphere type with the same SS/WH blend ratio (8/2)
The below best-fit regression models were built as a function of temperature, heating rate with the three levels, atmosphere type with the five levels of CO2, N2, and CO2/N2(2/8, 5/5, and 8/2), respectively,
and their two- and three-way interaction terms (DW = 0; n = 65134; p < 0.001): RM (%) = 101.286 − 0.071981 T + 1.384 N2+ 0.779 CO2/N2(2/ 8) + 1.740 CO2/N2(5/5) + 1.445 CO2/N2(8/2) + 1.153 HR20 + 2.521 HR40 + 0.001392 T*N2+ 0.000206 T*CO2/N2(2/ 8) − 0.000002 T*CO2/N2(5/5) + 0.000553 T*CO2/N2(8/ 2) + 0.001075 T*HR20 + 0.001201 T*HR40 − 2.274 N2*HR20 − 3.186 N2*HR40 − 0.866 CO2/N2(2/8)*HR20 − 2.473 CO2/N2(2/ 8)*HR40 − 1.882 CO2/N2(5/5)*HR20 − 3.338 CO2/N2(5/5)*HR40 − 0.409 CO2/N2(8/2)*HR20 − 1.569 CO2/N2(8/2)*HR40 (SE = 5.6; R2
adjand R2pred= 90.6%; VIF < 12)
DSC (mW/mg) = −1.4976–0.002494 T + 0.0651 N2 + 0.3474
CO2/N2(2/8) + 0.2176 CO2/N2(5/5) + 0.4086 CO2/N2(8/2) +
0.2280 HR20 − 2.0603 HR40 − 0.000512 T*N2 − 0.000622
T*CO2/N2(2/8) − 0.000022 T*CO2/N2(5/5) − 0.001249 T*CO2/
N2(8/2) − 0.005295 T*HR20 − 0.016383 T*HR40 + 0.1414 N2*HR20 − 0.5328 N2*HR40 − 0.0927 CO2/N2(2/8)*HR20 − 0.2829 CO2/N2(2/8)*HR40 − 0.3867 CO2/N2(5/5)*HR20 − 0.0709 CO2/N2(5/5)*HR40 − 1.7089 CO2/N2(8/2)*HR20 − 0.7217 CO2/N2(8/2)*HR40 − 0.003332 T*N2*HR20 + 0.003705 T*N2*HR40 − 0.000817 T*CO2/N2(2/8)*HR20 + 0.003009 T*CO2/N2(2/8)*HR40 − 0.000795 T*CO2/N2(5/5)*HR20 − 0.000982 T*CO2/N2(5/5)*HR40 + 0.004066 T*CO2/N2(8/
2)*HR20 + 0.005453 T*CO2/N2(8/2)*HR40 (SE = 1.4; R2adjand
R2 pred= 91.7%; VIF < 33) DTG (%/min) = −0.8530 + 0.000429 T − 0.8127 HR20 − 2.7667 HR40 + 0.000236 T*HR20 + 0.001597 T*HR40 − 0.2957 N2*HR20 − 0.4559 N2*HR40 − 0.0929 CO2/N2(2/8)*HR20 − 0.2967 CO2/N2(2/8)*HR40 − 0.0389 CO2/N2(5/5)*HR20 − 0.1903 CO2/N2(5/5)*HR40 + 0.0553 CO2/N2(8/2)*HR20 + 0.0631 CO2/N2(8/2)*HR40 + 0.000903 T*N2*HR20 + 0.001381 T*N2*HR40 + 0.000307 T*CO2/N2(2/8)*HR20 + 0.000768 T*CO2/N2(2/8)*HR40 + 0.000111 T*CO2/N2(5/5)*HR20 + 0.000406 T*CO2/N2(5/5)*HR40 − 0.000042 T*CO2/N2(8/
2)*HR20 − 0.000076 T*CO2/N2(8/2)*HR40 (SE = 1.7; R2adjand
R2
pred= 20.8%; VIF < 20)
For the categorical variables of the heating rate and the atmosphere type, 10 °C·min−1and the CO
2atmosphere were selected as the
base-lines, respectively. The three responses were concurrently maximized when the individual factors of temperature, heating rate, and
atmosphere type were optimally set to 854.8 °C, 10 °C·min−1, and CO 2/
N2(5/5), respectively (D = 0.91).
3.4.3. Optimization in response to temperature and blend ratio at the same heating rate of 20 °C·min−1in the same N
2atmosphere
The below best-fit regression models of RM and DTG were built as a function of temperature, the blend ratio of SS/WH with the six levels of pure SS, 9/1, 8/2, 6/4, 7/3, and pure WH, respectively, and their two-way interaction terms (DW = 0; n = 65134; p < 0.001):
RM (%) = 98.919 − 0.052740 T + 0.736 blend9/1–0.131 blend8/ 2 + 0.591 blend6/4 + 0.419 blend7/3–1.529 WH − 0.003065 T*blend9/1–0.007821 T*blend8/2–0.014714 T*blend6/ 4–0.011921 T*blend7/3–0.033571 T*WH (SE = 7.2; R2
adjand R2pred
= 88.7%; VIF < 8)
DTG (%/min) = −1.6497 + 0.001235 T − 0.0736 blend9/ 1–0.2424 blend8/2–0.3890 blend6/4–0.3326 blend7/3–1.0122 WH + 0.000064 T*blend9/1 + 0.000196 T*blend8/2 + 0.000238 T*blend6/4 + 0.000237 T*blend7/3 + 0.000552 T*WH (SE = 1.3; R2
adjand R2pred= 11.3%; VIF < 8)
For the categorical variables of the blend ratio of SS/WH, SS was selected as the baseline. The two responses were concurrently max-imized when the individual factors of temperature, and blend ratio were optimally set to 1049.1 °C, and WH, respectively (D = 0.96). 3.5. Gaseous products of (co-)pyrolysis
Volatiles generated by the (co-)pyrolysis processes were detected at 800 °C using the Py-GC/MS analysis. The yields of the compounds were computed using the characterized GC-MS spectra according to standard solution calibration, NIST library database and previous reports. There were several identifiable peaks which indicated the complex composi-tion of the volatiles. The (co-)pyrolysis products were identified ac-cording to the standard spectrum library NIST14.L that consisted of 65, 56 and 47 compounds for SS, WH and their blend, respectively (Table 4).
The two most common (co-)pyrolysis products were toluene and benzene for SS, 1-pentene-3 acetylene and toluene for WH, and toluene and 1-pentene-3 acetylene for their blend (Table 4). In terms of their structure, the volatiles organic matters were divided into the following six categories: acids (containing carboxyl) (AC), aldehydes (containing aldol) (AL), nitriles (containing nitriles) (N), olefins (containing un-saturated bond hydrocarbons) (A), heterocycles (cyclopentane, pyrrole, pyridine and furan) (H), and benzene and its derivatives (containing benzene ring) (BD). The (co-)pyrolysis products were mainly alkenes, heterocycles, benzene and their derivatives. The organic matter content of SS mainly consisted of fat, protein, carbohydrates, and cellulose (Zhou et al., 2017), while that of WH mainly contained (hemi)cellu-loses, and lignin (Sindhu et al., 2017). Among all the (co-)pyrolysis products, benzene and its derivatives were the most abundant compo-nents due mainly to the decomposition of lignin, and partly, to the aromatization of (hemi)celluloses (Lin et al., 2017; Biswas et al., 2017). Cellulose, and protein were the main substrates of the aromatic
Table 3
Characteristic (D)TG curves and associated parameters in five atmospheres.
Atmosphere Ti(°C) Tp(°C) Rp(%·min−1) Rv(%·min−1) Mr(%) Tb(°C)
Tp1 Tp2 Tp3 Rp1 Rp2 Rp3 N2 236 289.8 338.5 843.3 4.52 5.46 0.79 1.239 48.12 866.26 CO2/N2(2/8) 239 298.9 339.5 886.9 4.54 5.32 2.01 1.309 44.97 884.30 CO2/N2(5/5) 238 292.3 339.1 870.3 4.65 5.35 2.12 1.346 43.3 886.51 CO2/N2(8/2) 236 290.0 338.1 867.9 4.45 5.35 2.45 1.321 44.74 883.28 CO2 238 291.9 338.8 860.4 4.51 5.19 2.31 1.358 42.87 880.14
Table 4
(Co-)pyrolysis products of sewage sludge (SS), water hyacinth (WH) and their blend (SW) based on Py-GC/MS analyses.
No Compound name Molecular structure Group SS WH SW
PT (min) Area (%) PT (min) Area (%) PT (min) Area (%)
1 2-Butene A 1.25 6.13 1.27 5.69 1.26 6.46 2 Isoprene A 1.38 2.04 – – – – 3 Cyclopentadiene A 1.42 3.07 – – – – 4 1-Penten-3-yne A 1.46 2.81 1.48 10.28 1.47 10.52 5 Propanenitrile N 1.58 1.05 – – – – 6 1-Hexene A 1.61 0.49 – – – – 7 2,4-Hexadiene A 1.68 1.28 – – – – 8 Cyclohexadiene A – – – – 1.69 1.6 9 Cyclohexadiene A – – – – 1.81 0.42 10 Cyclohexadiene A 1.89 2.97 1.91 4.14 1.9 4.02 11 Benzene BD 2.05 8.35 2.07 7.62 2.06 7.4 12 Cyclohexene A – – 2.23 0.26 2.13 1.46 13 Cyclopentane H 2.28 0.45 – – – – 14 x,y-dimethyl- Cyclopentane H – – 2.3 0.47 2.22 0.4 15 2,5-dimethyl- Furan H 2.46 0.3 2.48 0.32 2.29 0.52 16 1-methyl- Cyclohexadiene A 2.92 2.15 2.89 2.91 2.47 0.29 17 Pyrrole H 3.06 2.05 3.08 1.97 3.08 2.55 18 Toluene BD 3.2 10.08 3.21 9.56 2.65/3.21 0.71/10.92 19 1-Octene A 3.54 0.38 – – – – 20 1-methyl- Cyclohexadiene A – – – – 2.89 2.88 21 x-methyl- Pyridine H – – 3.55 0.42 3.55 0.44 22 x-methyl- Pyridine H – – 3.92 1.04 3.92 1.47 23 2-methyl- Pyridine H 3.91 1.39 – – – –
Table 4 (continued)
No Compound name Molecular structure Group SS WH SW
PT (min) Area (%) PT (min) Area (%) PT (min) Area (%)
24 2,5-dimethyl- Furan C 4.2 0.4 – – – – 25 Acetaldehyde Al – – 4.21 1.32 4.21 0.89 26 x-methyl- Pyrrole H – – 4.35 1.45 4.35 2.01 27 Diazine BD 4.35 2.05 – – – – 28 Diazine BD 4.5 1.2 – – – – 29 x-methyl- Pyrrole H – – 4.5 0.74 4.5 1.2 30 Ethylbenzene BD 4.68 3.59 4.68 3.89 4.68 2.65 31 Xylene BD 4.81 1.53 – – – – 32 o-Xylene BD – – 4.82 1.46 4.82 1.51 33 Styrene + Xylene A 5.17 5.89 5.18 5.25 5.19 5.9 34 x,y-dimethyl- Pyrrole H – – 5.81 0.7 5.81 1.02 35 4-methyl- Benzenamine BD 5.83 0.35 – – – – 36 2-ethenyl-Pyridine H 5.88 0.3 5.9 0.33 5.9 0.47 37 Propenyl-Benzene A 6.08 0.42 – – – – 38 Propyl-Benzene BD 6.21 0.31 – – – – 39 n-propylbenzene BD – – 6.25 0.47 – – 40 Cyclopropyl- Benzene BD – – – – 6.26 0.41 41 Dimethyl- Pyridine H 6.26 0.87 – – 6.3 0.83 42 3-picoline H – – 6.29 0.48 – – 43 x-ethyl-Toluene BD – – 6.42 0.93 – –
Table 4 (continued)
No Compound name Molecular structure Group SS WH SW
PT (min) Area (%) PT (min) Area (%) PT (min) Area (%)
44 Phenol BD – – 6.73 5.09 6.75 3.52 45 Phenol + Benzonitrile BD + N 6.74 3.14 – – – – 46 1-ethenyl-x-methyl- Benzene BD 6.91 0.95 – – 6.89 0.79 47 2-Propyl- Pyridine H 7.38 0.4 – – 7.39 0.5 48 Propenyl-Benzene BD 7.44 0.54 – – – – 49 1-propynyl- Benzene BD – – – – 7.73 1.62 50 Indene BD 7.74 1.81 – – – – 51 1-propynyl- Benzene BD – – 7.75 1.67 – – 52 2-methyl-Phenol BD 7.91 0.58 7.91 1.01 7.89 0.62 53 4-methyl- Phenol BD 8.24 5.99 8.24 3.39 8.25 4.86 54 1-Undecene A 8. 48 0.66 – – – – 55 Benzyl nitrile N 9.25 1.85 9.24 1.47 9.24 1.84 56 x-methyl- Indene BD 9.39 1.56 9.39 1.22 9.39 1.51 57 x-ethyl- Pheno BD 9.65 1.44 9.62 1.66 – – 58 Naphthalene BD 9.92 2.15 9.92 2.01 9.92 2.08 59 Pyrocatechol BD – – 10.15 0.81 – – 60 Coumaran BD – – 10.25 0.35 – – 61 Phthalan BD 10.42 1.72 10.38 1.77 10.4 1.84 62 2-(1-methylethoxy)- Phenol BD – – 10.59 0.49 – – 63 Quinoline BD 10.7 0.69 10.69 0.78 – –
hydrocarbon production (Luo et al., 2011; Zhou et al., 2017; Sindhu et al., 2017). In order to explain why the (co-)pyrolysis products were mainly alkenes, heterocycles, benzene, and their derivatives, the con-version pathways of cellulose and protein into aromatics were showed separately. Compared to SS and WH, their blend had the minimum amount of benzene and its derivatives but the maximum amount of alkenes and heterocycles, with the appearance of some new products (Table 4). This suggests that the quantity of the co-pyrolysis products was not a simple sum of SS and WH but their product.
3.6. Kinetic and thermodynamic analyses
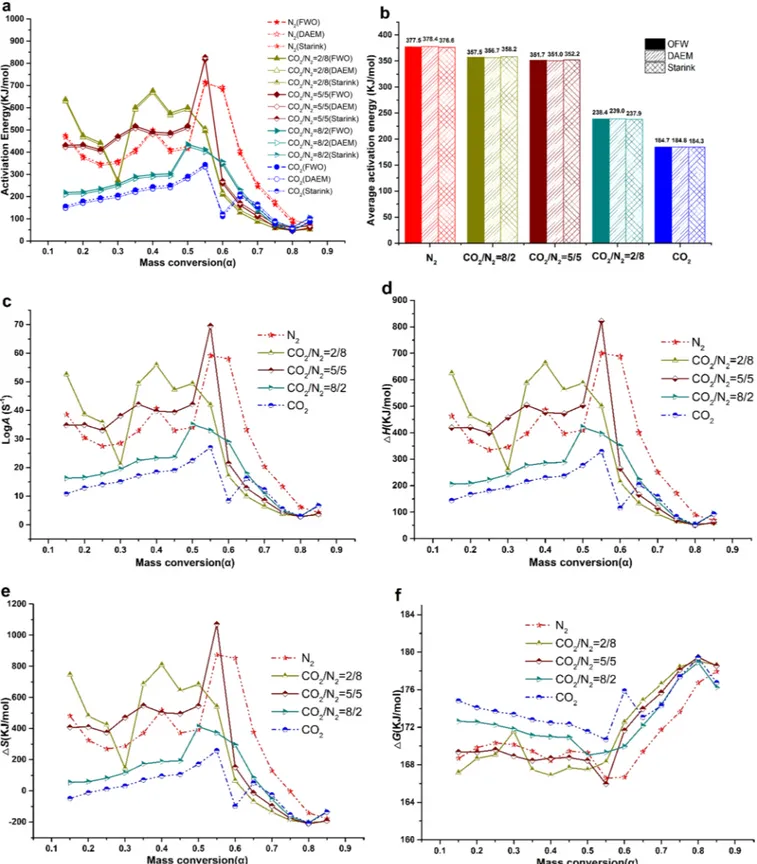
Activation energy represents the energy absorbed by the reactant molecule when it changes from the initial stable state to the activated molecule. To accurately estimate Eavalues of the co-pyrolysis, the OFW,
DAEM and Starink methods were used in the five atmospheres with the conversion rates ( = 0.15–0.85) (Fig. 4). In general, the r2values of
the best-fit equations were above 0.90.Fig. 4a shows that Eaestimates
by the OFW, DAEM and Starink methods had similar trends.
In response to the five atmospheres, the Eaestimates of the
co-pyrolysis differed significantly (Fig. 4a). The average activation energy (Ead) estimates by the OFW/DAEM/Starink methods were 377.5/378.4/
376.6; 357.5/356.7/358.2; 351.7/351.0/352.2; 238.4/239.0/237.9; and 184.7/184.8/184.3 kJ/mol in the N2, CO2/N2(2/8, 5/5 and 8/2)
and CO2atmospheres, respectively (Fig. 4b). With the increased CO2
concentration, the Eadvalue decreased gradually and was lowest in the
CO2 atmosphere which indicated that the different atmospheres
in-duced the different reaction mechanisms (Lai et al., 2012). The acti-vation energy required was higher in the N2 than CO2 atmosphere
which was supported byLai et al. (2012).
LogA, ΔH and Eawere positively correlated (Fig. 4c–f). The Eaand
LogA estimates changed dramatically as a function of the conversion rate which implied that the co-pyrolysis process was composed of multiple reaction steps (Xu and Chen, 2013). ΔH indicates the differ-ence in energy between the reagents and the activation complexes (Amanda and Leandro, 2016). A slight difference implies a very small energy barrier towards the formation of an activated complex. A posi-tive ΔH value indicated the necessity to absorb external energy to in-crease the energy level of the reactants to its transition state and that the co-pyrolysis reaction was an endothermic reaction (Huang et al., 2016). The CO2atmosphere appeared to be more favorable to the
for-mation of activated complex (Table 5).
Related to the formation of compound active substances. both po-sitive and negative ΔS values appeared inFig. 4e, and its trend was
Table 4 (continued)
No Compound name Molecular structure Group SS WH SW
PT (min) Area (%) PT (min) Area (%) PT (min) Area (%)
64 Benzocycloheptatriene BD – – – – 11.5 3.92 65 x-methyl- Naphthalene BD 11.74 0.93 – – 11.74 0.8 66 Biphenyl BD 12.64 0.37 – – – – 67 7-methyl-1H-lndole BD 12.74 2.1 12.73 1.26 12.73 1.62 68 Acenaphthene BD 13.28 0.25 – – – – 69 Acenaphthylene BD 13.54 0.3 13.55 0.22 – – 70 Lepidine BD 13.96 0.61 – – – – 71 1-Naphthol BD – – 14.36 0.46 – – 72 Phenanthrene BD 17.37 0.31 17.37 0.2 17.37 0.24 73 Carbazole BD 17.95 0.29 17.94 0.18 17.95 0.26 74 Hexadecanoic acid AC 19.1 0.44 19.09 0.31 19.1 0.34
similar to Ea. A positive ΔS value indicated that the reaction increased
the disorder degree of the system. The N2atmosphere was more
fa-vorable to the reaction than the CO2atmosphere (Table 5). A low ΔS
value meant that the reactant just passed through a physical or che-mical reaction process and reached a state close to its own
thermodynamic equilibrium. In this situation, the reactant reactivity was very small prolonging the time required for the formation of an activated complex. While a high ΔS value showed that the reaction did not reach its thermodynamic equilibrium state and was not carried out quickly to produce the activated complex which resulted in a shorter
reaction time and a higher weight loss rate (Huang et al., 2016). Therefore, during the co-pyrolysis process, the reaction occurred faster in the range of 0.4–0.6.
Gibbs free energy reveals the direction in which the reaction unfolds as well as the increased total energy of the system during the formation of activated complex. The higher the ΔG value is, the more difficultly the reaction occurs (Amanda and Leandro, 2016). ΔG was lower in the N2than CO2atmosphere, an indication of the conduciveness of the N2
atmosphere for their actions (Fig. 4e). ΔG grew gradually with of over 0.6 due to the reduced quantity of the co-pyrolysis reactants. ΔG de-clined with of over 0.8 since the existence of CO2was conducive to the
vaporization of coke at high temperatures (Table 5). The ΔG values corresponding to the maximum weight loss rates in the N2, CO2/N2(2/
8), CO2/N2(5/5), CO2/N2(8/2) and CO2atmospheres differed slightly
thus: 169.2, 168.0, 168.7, 170.9 and 172.3 kJ/mol, respectively. 4. Conclusions
Compared to the N2atmosphere, the co-pyrolysis process was
in-hibited at low temperatures in the CO2atmosphere but was conducive
to the sample burnout at high temperatures. The main (co-)pyrolysis products consisted of benzene and its derivatives, olefins, and hetero-cyclic compounds. On average, the apparent activation energy de-creased gradually with the inde-creased atmospheric CO2concentration,
peaked (377.5 kJ/mol) in the N2atmosphere and bottomed out (184.7
kJ/mol) in the CO2atmosphere. The fuel type by the heating rate, and
the atmosphere type by the heating rate exerted significant interaction effects on all the responses (p < 0.001).
Acknowledgements
This work was financially supported by the National Natural Science Foundation of China (No. 51608129), the Scientific and Technological Planning Project of Guangzhou, China (No. 201704030109; 2016201604030058), the Science and Technology Planning Project of Guangdong Province, China (No. 2015B020235013; 2017A040403063; 2017A090905043; 2018A050506046; 2016A050502059), and Bolu Abant Izzet Baysal University, Turkey (BAP Grant No. 2015.09.02.914). Appendix A. Supplementary data
Supplementary data to this article can be found online athttps:// doi.org/10.1016/j.biortech.2019.01.003.
References
Alvarez, J., Amutio, M., Lopez, G., Bilbao, J., Olazar, M., 2015. Fast co-pyrolysis of sewage sludge and lignocellulosic biomass in a conical spouted bed reactor. Fuel 159, 810–818.
Amanda, A.D.M., Leandro, C.M., 2016. Kinetic parameters of red pepper waste as biomass to solid biofuel. Bioresour. Technol. 204, 157–163.
Aswathy, U.S., Sukumaran, R.K., Devi, G.L., Rajasree, K.P., Singhania, R.R., Pandey, A.,
2010. Bio-ethanol from water hyacinth biomass: an evaluation of enzymatic sac-charification strategy. Bioresour. Technol. 101, 925–930.
Biswas, B., Sing, R., Krishna, B.B., Kumar, J., Bhaskar, T., 2017. Pyrolysis of azolla, sar-gassum tenerrimum and water hyacinth for production of bio-oil. Bioresour. Technol. 242, 139–145.
Chen, J.C., Liu, J.Y., He, Y., Huang, L.M., Sun, S.Y., Sun, J., Chang, K.L., Kuo, J.H., Huang, S.S., Ning, X.A., 2017a. Investigation of co-combustion characteristics of sewage sludge and coffee grounds mixtures using thermogravimetric analysis coupled to artificial neural networks modeling. Bioresour. Technol. 225, 234–245.
Chen, J.B., Mu, L., Cai, J.C., Yao, P.K., Song, X.G., Yin, H.C., Li, A.M., 2015. Pyrolysis and oxy-fuel combustion characteristics and kinetics of petrochemical wastewater sludge using thermogravimetric analysis. Bioresour. Technol. 198, 115–123.
Chen, C., Lu, Z., Ma, X., Long, J., Peng, Y., Hu, L., Lu, Q., 2013. Oxy-fuel combustion characteristics and kinetics of microalgae Chlorella vulgaris by thermogravimetric analysis. Bioresour. Technol. 144, 563–571.
Chen, G., He, S., Cheng, Z., Guan, Y., Yan, B., Ma, W., Leung, D.Y.C., 2017b. Comparison of kinetic analysis methods in thermal decomposition of cattle manure by themo-gravimetric analysis. Bioresour. Technol. 243, 69–77.
Fang, S.W., Yu, Z.S., Lin, Y.S., Hu, S.C., Liao, Y.F., Ma, X.Q., 2015. Thermogravimetric analysis of the co-pyrolysis of paper sludge and municipal solid waste. Energ. Convers. Manage. 101, 626–631.
Fang, S.W., Yu, Z.S., Ma, X.Q., Lin, Y., Lin, Y.S., Chen, L., Fan, Y.L., Liao, Y.F., 2017. Co-pyrolysis characters between combustible solid waste and paper mill sludge by TG-FTIR and Py-GC/MS. Energ. Convers. Manage. 144, 144–1122.
Gangulya, A., Chatterjee, P.K., Dey, A., 2012. Studies on ethanol production from water hyacinth-a review. Renew. Sustain. Energy Rev. 16, 966–972.
Guerrero-Coronilla, I., Morales-Barrera, L., Cristiani-Urbina, E., 2015. Kinetic, isotherm and thermodynamic studies of amaranth dye biosorption from aqueous solution onto water hyacinth leaves. J. Environ. Manage. 152, 99–108.
Gunnarsson, C., Petersen, C., 2007. Water hyacinths as a resource in agriculture and energy production: a literature review. Waste Manage. 27, 117–129.
Guo, Q., Dai, X.H., 2017. Analysis on carbon dioxide emission reduction during the anaerobic synergetic digestion technology of sludge and kitchen waste: taking kitchen waste synergetic digestion project in Zhenjiang as an example. Waste Manage. 69, 360–364.
Huang, L.M., Liu, J.Y., He, Y., Sun, S.Y., Chen, J.C., Sun, J., Chang, K.L., Kuo, J.H., Ning, X.A., 2016. Thermodynamics and kinetics parameters of co-combustion between sewage sludge and water hyacinth in CO2/O2atmosphere as biomass to solid biofuel.
Bioresour. Technol. 218, 631–642.
Huang, L.M., Xie, C.D., Liu, J.Y., Zhang, X.C., Chang, K.L., Kuo, J.H., Sun, J., Xie, W.M., Zheng, L., Sun, S.Y., Buyukada, M., Evrendilek, F., 2018. Influence of catalysts on co-combustion of sewage sludge and water hyacinth blends as determined by TG-MS analysis. Bioresour. Technol. 247, 217–225.
Hussain, Z., Alamgir, K., 2013. The conversion of biomass into liquid hydrocarbon fuel by two step pyrolysis using cement as catalyst. J. Anal. Appl. Pyrol. 101, 90–95.
Kim, Y.S., Kim, Y.S., Kim, S.H., 2010. Investigation of thermodynamic parameters in the thermal decomposition of plastic waste-waste lube oil compounds. Environ. Sci. Technol. 44, 5313–5317.
Lai, Z.Y., Ma, X.Q., Tang, Y.T., Lin, H., 2012. Thermogravimetric analysis of the thermal decomposition of MSW in N2, CO2and CO2/N2atmospheres. Fuel Process. Technol.
102, 18–23.
Lee, S.R., Lee, J., Lee, T., Tsang, Y.F., Jeong, K.H., Oh, J.I., Kwon, E.E., 2017. Strategic use of CO2for co-pyrolysis of swine manure and coal for energy recovery and waste
disposal. J. CO2Util. 22, 110–116.
Lin, Y.S., Ma, X.Q., Yu, Z.S., Cao, Y.W., 2014. Investigation on thermochemical behavior of co-pyrolysis between oil-palm solid wastes and paper sludge. Bioresour. Technol. 166, 444–450.
Lin, Y., Liao, Y.F., Yu, Z.S., Fang, S.W., Ma, X.Q., 2017. A study on co-pyrolysis of bagasse and sewage sludge using TG-FTIR and Py-GC/MS. Energ. Convers. Manage. 151, 190–198.
Liu, J.Y., Zeng, J.J., Sun, S.Y., Huang, S.S., Kuo, J.H., Chen, N.W., 2016. Combined effects of FeCl3and CaO conditioning on SO2, HCl and heavy metals emissions during the
DDSS incineration. Chem. Eng. J. 299, 449–458.
Liu, J.Y., Zhuo, Z.X., Xie, W.M., Kuo, J.H., Lu, X.W., Musa, B., Fatih, E., 2018. Interaction effects of chlorine and phosphorus on thermochemical behaviors of heavy metals during incineration of sulfur-rich textile dyeing sludge. Chem. Eng. J. 351, 897–911.
Liu, J.Y., Fu, J.W., Ning, X.N., Sun, S.Y., Wang, Y.J., Xie, W.M., Huang, S.S., Zhong, S., Huang, S.J., Zhuo, Z.X., Huang, L.M., 2015a. An experimental and thermodynamic equilibrium investigation of the Pb, Zn, Cr, Cu, Mn and Ni partitioning during sewage sludge incineration. J. Environ. Sci 35, 43–54.
Liu, J.Y., Huang, S.J., Sun, S.Y., Ning, X.N., Li, X.M., Chen, T., Luo, G.Q., Xie, W.M., Wang, Y.J., Yang, Z.Y., 2015b. Effects of sulfur on lead partitioning during sludge combustion based on experiments and thermodynamic calculations. Waste Manage. 38, 336–348.
Luo, G.E., Strong, P.J., Wang, H.L., Ni, W.Z., Shi, W.Y., 2011. Kinetics of the pyrolytic and hydrothermal decomposition of water hyacinth. Bioresour. Technol. 102, 6990–6994.
Raheem, A., Sikarwar, V.S., He, J., Dastyar, W., Dionysiou, D.D., Wang, W., Zhao, M., 2018. Opportunities and challenges in sustainable treatment and resource reuse of sewage sludge: a review. Chem. Eng. J. 337, 616–641.
Sindhu, R., Binod, P., Pandey, A., Madhavan, A., Alphonsa, J.A., Vivek, N., Gnansounou, E., Castro, E., Faraco, V., 2017. Water hyacinth a potential source for value addition: an overview. Bioresour. Technol. 230, 152–162.
Table 5
Thermodynamic and kinetic parameters of blend (SW) estimated at peak tem-perature in five atmospheres at 20 °C·min−1.
Atmosphere N2 CO2/N2(2/8) CO2/N2(5/5) CO2/N2(8/2) CO2 peak 0.493 0.465 0.446 0.433 0.445 Tm(K) 611.65 612.65 612.25 611.25 612.65 Ea(kJ/mol) 414.90 567.12 476.95 293.42 241.75 Log A (s−1) 34.08 47.14 39.41 23.57 19.02 ΔH (kJ/mol) 409.82 562.14 471.85 288.30 236.65 ΔG (kJ/mol) 169.29 168.00 168.76 170.93 172.34 ΔS (J/mol) 393.26 643.35 495.05 192.03 104.97
Wang, X.B., Deng, S.H., Tan, H.Z., Adeosun, A., Vujanovic, M., Yang, F.X., Duic, N., 2016. Synergetic effect of sewage sludge and biomass co-pyrolysis: a combined study in thermogravimetric analyzer and a fixed bed reactor. Energ. Convers. Manage. 118, 399–405.
Xie, W.H., Wen, S.T., Liu, J.Y., Xie, W.M., Kuo, J.H., Lu, X.W., Sun, S.Y., Chang, K.L., Buyukada, M., Evrendilek, F., 2018. Comparative thermogravimetric analyses of co-combustion of textile dyeing sludge and sugarcane bagasse in carbon dioxide/oxygen and nitrogen/oxygen atmospheres: thermal conversion characteristics, kinetics, and thermodynamics. Bioresour. Technol. 255, 88–95.
Xu, Y., Chen, B., 2013. Investigation of thermodynamic parameters in the pyrolysis conversion of biomass and manure to biochars using thermogravimetric analysis.
Bioresour. Technol. 146, 485–493.
Zhao, B., Xu, X.Y., Li, H.B., Chen, X., Zeng, F.Q., 2018. Kinetics evaluation and thermal decomposition characteristics of co-pyrolysis of municipal sewage sludge and ha-zelnut shell. Bioresour. Technol. 247, 21–29.
Zhou, P., Xiong, S.J., Zhang, Y.X., Jiang, H., Chi, Y.C., Li, L., 2017. Study on the nitrogen transformation during the primary pyrolysis of sewage sludge by GC/MS and Py-FTIR. Int. J. Hydrogen Energ. 42, 18181–18188.
Zhuo, Z.X., Liu, J.Y., Sun, S.Y., Kuo, J.H., Sun, J., Chang, K.L., Fu, J.W., 2018. Thermogravimetric analysis of textile dyeing sludge (TDS) in N2/CO2/O2